Category: Main

  • Ladder Predictor

    Ladder Predictor

    Start of the season always brings Max Laughton’s great work over at fox on the ladder prediction.

    Rather than selecting a winner and loser for each match through the season, Max uses a win % for each game to calculate projected wins.

    This makes a lot of sense. A team like Brisbane might go into every game as a warm (or hot) favourite. However, they’re very unlikely to run the table and finish 23-0. Using Win % and calculating an expected value gives you a much more realistic look at how the ladder will finish up.

    There’s a few different ladder predictors out there (I’m fond of the squiggle predictor) but all of them have you select a winner and margin.

    So I’ve put together a quick ladder predictor that instead of a margin, has you put in your estimated win % for each game and spits out a ladder accordingly.

    You can find it at charting.football/ladder/ or a simple mobile layout at charting.football/ladder/mobile/

    Once we’ve got some games in the can I’ll revisit and have it lock in the results that have already occurred.

  • Moving places

    Moving places

    Hey just a quick note, I’m in the process of moving from SquareSpace to a WordPress based site. As such, there are going to be things with the older blog posts that are probably going to break.

    For the moment, the old squarespace version is still up on CreditToDuBois.com so your first call should be there.

    If that doesn’t work and there’s something specific you want, hit me up on Twitter and I’ll see what I can do

  • Chasing 100 career AFLW goals

    Chasing 100 career AFLW goals

    We’re in the tenth season of the AFLW and there’s a solid chance this is the season we see someone break the 100 career goals barrier.

    The increase in scoring, as Joe talks about above, has lead to individual players kicking more goals.

    There are four players who, if they maintain their current 2025 goals average for the rest of the season would hit 100 goals before finals.

    We should place an asterisk on Jasmine Garner though, as she’s set to miss two to three weeks through injury so would need to pick up a couple of goals when she returns.

    How did we get here?

    There have been a total of 8 players who have held the careers goals record at some point, either jointly or by themselves. From Lauren Arnell sharing it for three minutes in game 1 of season 1, to Darcy Vescio holding it a combined three and a half years.

    It is a seriously accomplished list. Darcy Vescio, Erin Phillips, Tayla Harris, and Jasmine Garner are among the most recognizable players in the competition’s history. 

    Kate Hore is a club captain, premiership player, and three-time All Australian. Danielle Ponter was a key part of Adelaide’s 2019 and 2022 premierships, while Jess Wuetschner is one of the most dangerous small forwards the league has seen. 

    Lauren Arnell isn’t notable as a goalkicker but is a premiership player, three-time all Australian, and the first AFLW player to go from playing in the league to coaching in it.

    Here’s the progression of those eight players goalkicking tallies – goal by goal, minute by minute.

    And an alternate way to look at it, each title reign so far.

    If there was a favourite right now for who’s going to get to 100 goals first, Kate Hore seems like an easy choice. Whoever it is it will be a moment for the whole competition to celebrate.

  • The AFLW S10 meta shaping up

    The AFLW S10 meta shaping up

    Note: this article is published during AFLW indigenous round, and I have used the names six teams have adopted for the duration of the round. You can read more about indigenous round and those teams here: https://www.afl.com.au/aflw/indigenous/clubs

    As a Narrm (Melbourne) supporter it should surprise noone that I have been absolutely hanging out for the Women’s season so that’s where I’m diving into again. We’re still obviously really early, so I’m going to focus mostly on the teams that appear to be separating from the pack two rounds in. As per last week, I’m still building a lot of this data gathering infrastructure as I go, so I’ll have more time to dive into what it tells us as that settles in later in the season.

    First I wanted to build upon my very brief look at scoring shots in AFLW last week.

    Sydney and Melbourne have very similar profiles for where their scores are being generated and conceded – big positive turnover differentials, and a healthy stoppage differential.

    Essendon share a similar, but lesser, turnover differential but they’ve actually got a negative differential on stoppage scoring shots.

    Where it gets really interesting though is the Kangaroos. Of their 33 scores they’ve generated 28 of them from turnover, 2 from centre bounces, and just 3 from other stoppages. If we look at their stats more broadly they’re actually in the negative for clearance differential (-0.5 per game) which is a stark difference to the other undefeated sides who make up the 4 best clearance differentials range from +10 (Hawthorn) to +4.5 (Sydney).

    Where they’re leading the competition is generating turnovers (1st at +9/game) and uncontested possessions.

    The Kangaroos have had 55.5 more uncontested possessions per game than their opponents, with Sydney and Narrm inches behind at +55. The next best is Brisbane a massive step back with 19.5. To me there’s a clear meta forming around uncontested possession, and I think success will be driven by harnessing or countering it.

    For Narrm this is something of a return to past success. In their flag-winning season 7 campaign they recorded twice the uncontested possession differential of the next best team.

    Even among the three leaders there are significant differences though. Sydney and North are finding a lot more uncontested marks, each about 20% above the league average. They’re also two of the top three teams for retaining uncontested possession from a kick (the third being Kuwarna (Adelaide)). Narrm by comparison find themselves in the bottom 6 for kick retention.

    Accordingly, Narrm are below league average in uncontested marks, despite leading the league in possession differential. Where Narrm do stand out is their handball use and pressure. 46% of the Demon’s disposals are by hand, compared to a league average of 39%. Sydney are at league average while the Roos are slightly below.  Their handball receives are 15% above the next best (Sydney) and 50% above the league average.

    Narrm are also leading the league for opposition disposals per tackle. With the stricter interpretation on holding the ball, a combination of quick hands to release and tackling pressure on the opposition bodes well for them.

    One other thing I found in my travels leads me to giving a shout out to Georgie Cleaver. Waalitj Marawar (West Coast) have some real problems structurally, conceding a mark inside 50 from 36% of their opponent’s entries. But, they’ve had 17 defensive one-on-ones and are yet to lose one. This is led by Cleaver who is 0 from 7, leading the league (along with Sydney’s Alice Mitchell). If the Eagles can sort out some of their structures they’ve potentially got an elite pillar to build around and she’s only 20.

  • Scoring sources from the first round of AFLW Season 10

    Scoring sources from the first round of AFLW Season 10

    With the first week of AFLW in the books it’s worth spending some time looking at what we can get out of the early data available.

    I’ve started off by trying to identify score sources. This is relatively easy to get for the Men’s competition, but faces some extra challenges in the Women’s. This is still a work in progress, so take with a grain of salt. Because the sources are new, there’s no prior year comparison available.

    Overall we can see scores from kick-in even more negligible in AFLW than AFLM, and we also see a bigger prevalence of scores from turnover.

    Let’s now look at it on a game-by-game basis:

    Port are the only team to have scored a goal from kick in, with Katelyn Pope’s last quarter goal.

    Essendon and Melbourne had the most scoring events from turnover, while the Sydney v Richmond match saw both teams scoring as many times from stoppage as from turnover.

  • AFLW S10 List Construction

    AFLW S10 List Construction

    With Season 10 of the AFLW launching this week I wanted to have a look at how the 18 squads for 2025 have come together.

    There are 22 players still with their original Season 1 clubs, and each of the founding clubs has at least one original player – Adelaide having the most with 5.

    Carlton have made the most new additions for Season 10 with 10 new players – only one of whom comes from a previous club (Tara Bohana having played 31 games for Gold Coast).

    Brisbane have made the fewest changes with just three additions to their list – Neasa Dooley, Lilly Baker, and Claudia Wright all new to the AFLW.

    Melbourne have the most homegrown talent with 27, while Richmond and Essendon have the most players with prior club experience at 17.

    Essendon and Carlton both enter the season with 10 players yet to play a game for the club (Sophie McKay, Poppie Scholz, and Tara Bohana all played in the opening match of the season, so Carlton are already down to 7 uncapped players).

  • History doesn’t repeat itself, but often it rhymes

    History doesn’t repeat itself, but often it rhymes

    Simon Goodwin’s tenure as coach can, more than any other, be defined by a rule. Fitting for the coach of the Demons that this rule would be 6-6-6.

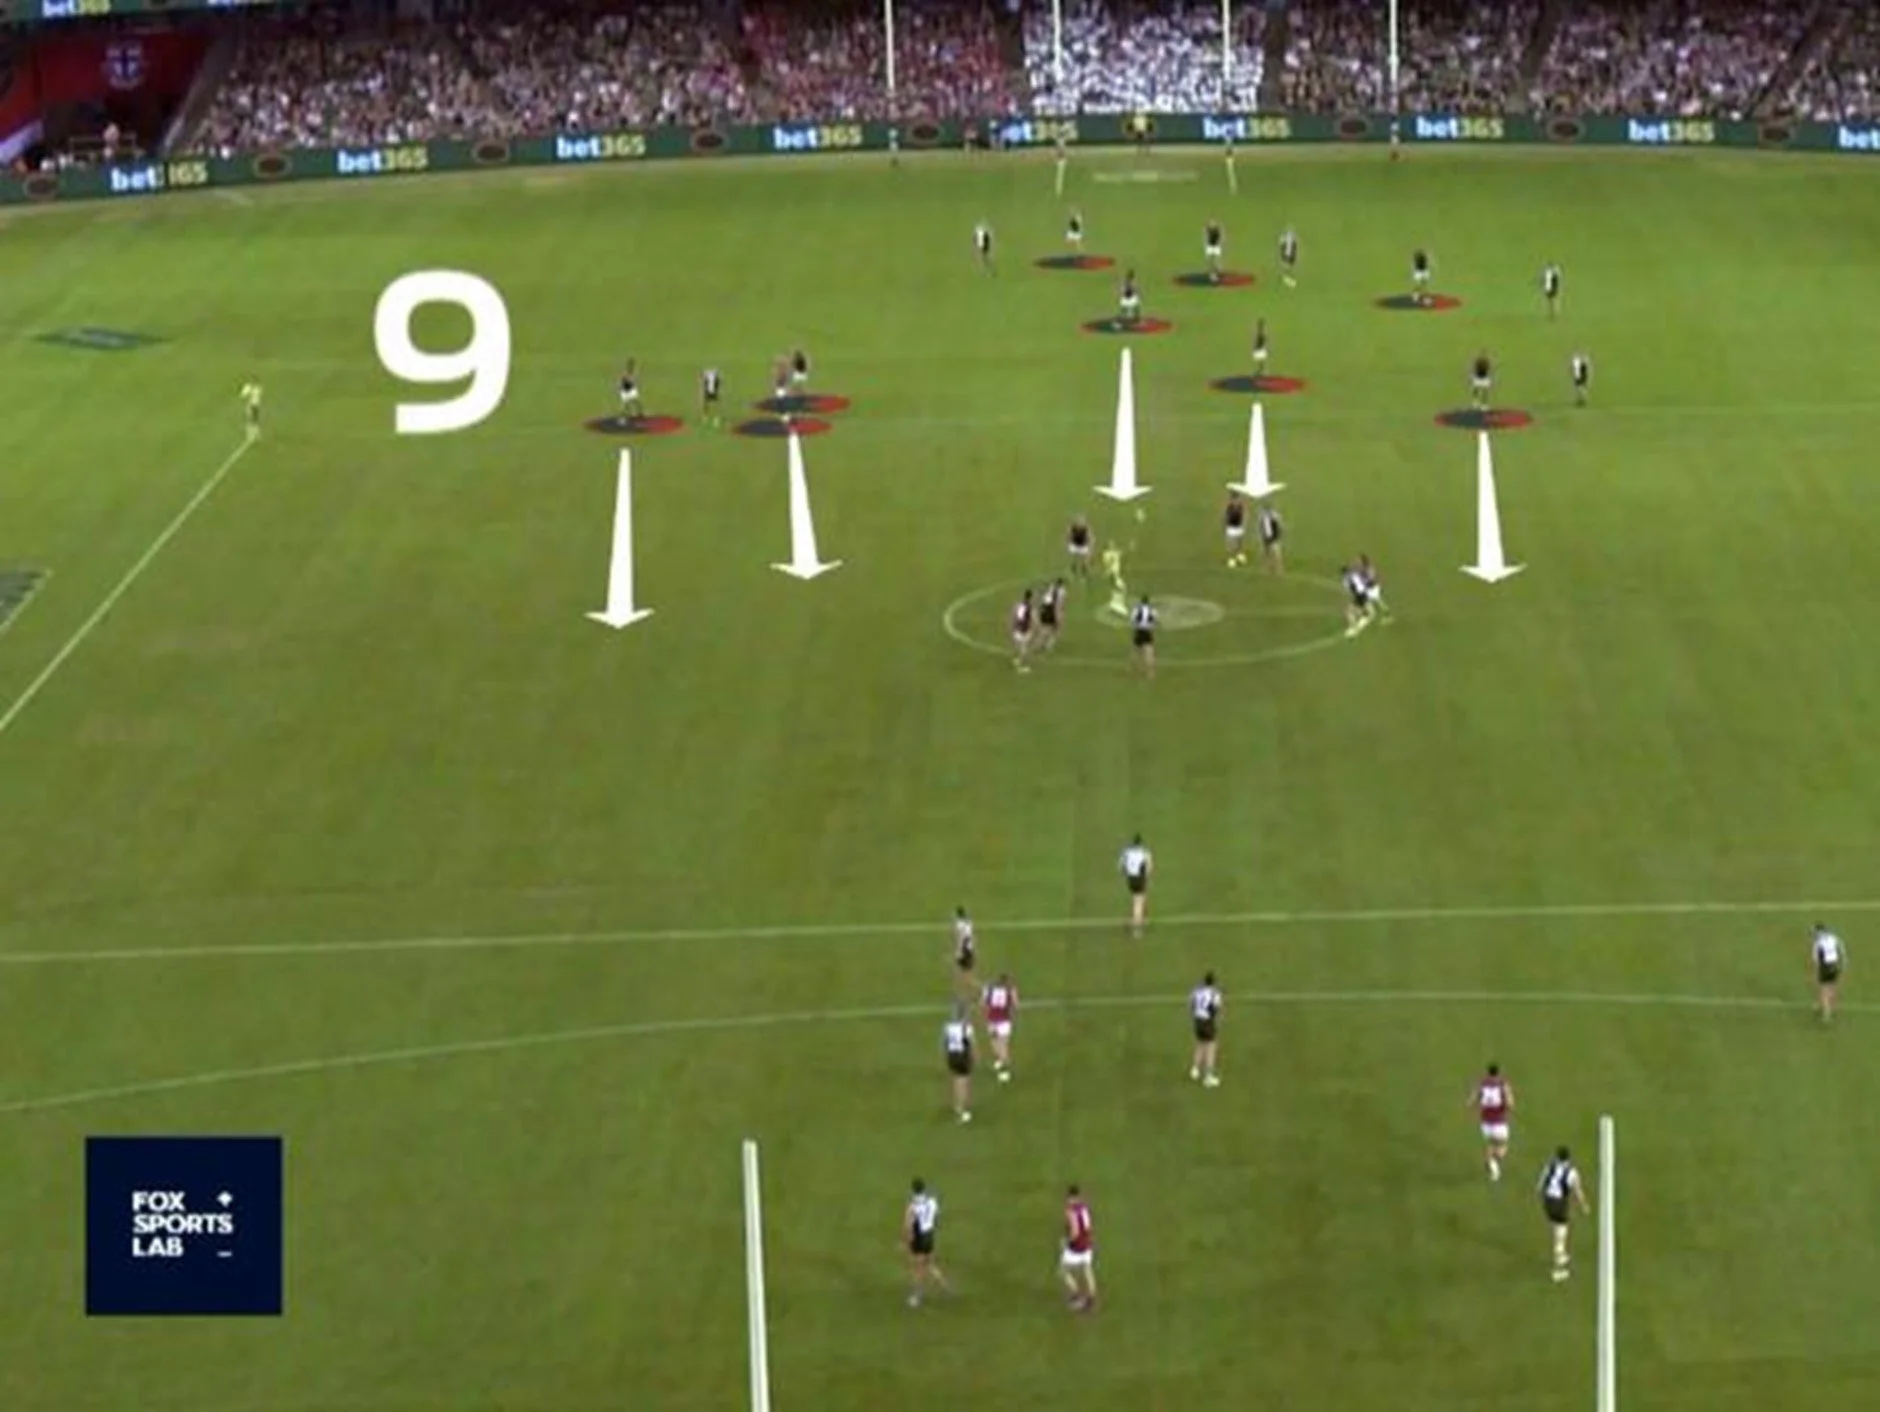
    Round 1 2017 – Simon Goodwin’s first game as Melbourne Coach. The Demons take on Alan Richardson’s St Kilda. All time Saints great Nick Riewoldt kicks two goals in the first quarter continuing his long-running torment of Melbourne. The 6-6-6 rule isn’t even a gleam in Steve Hockings eye and Goodwin has up to 9 players starting in defence at times. This isn’t a flooding strategy though – as the ball bounces they move into the centre square to provide attacking options. It sees them win 10 consecutive centre clearances and helps turn the match with a run of 10 goals.

     Source: Fox Sports
    Source: Fox Sports

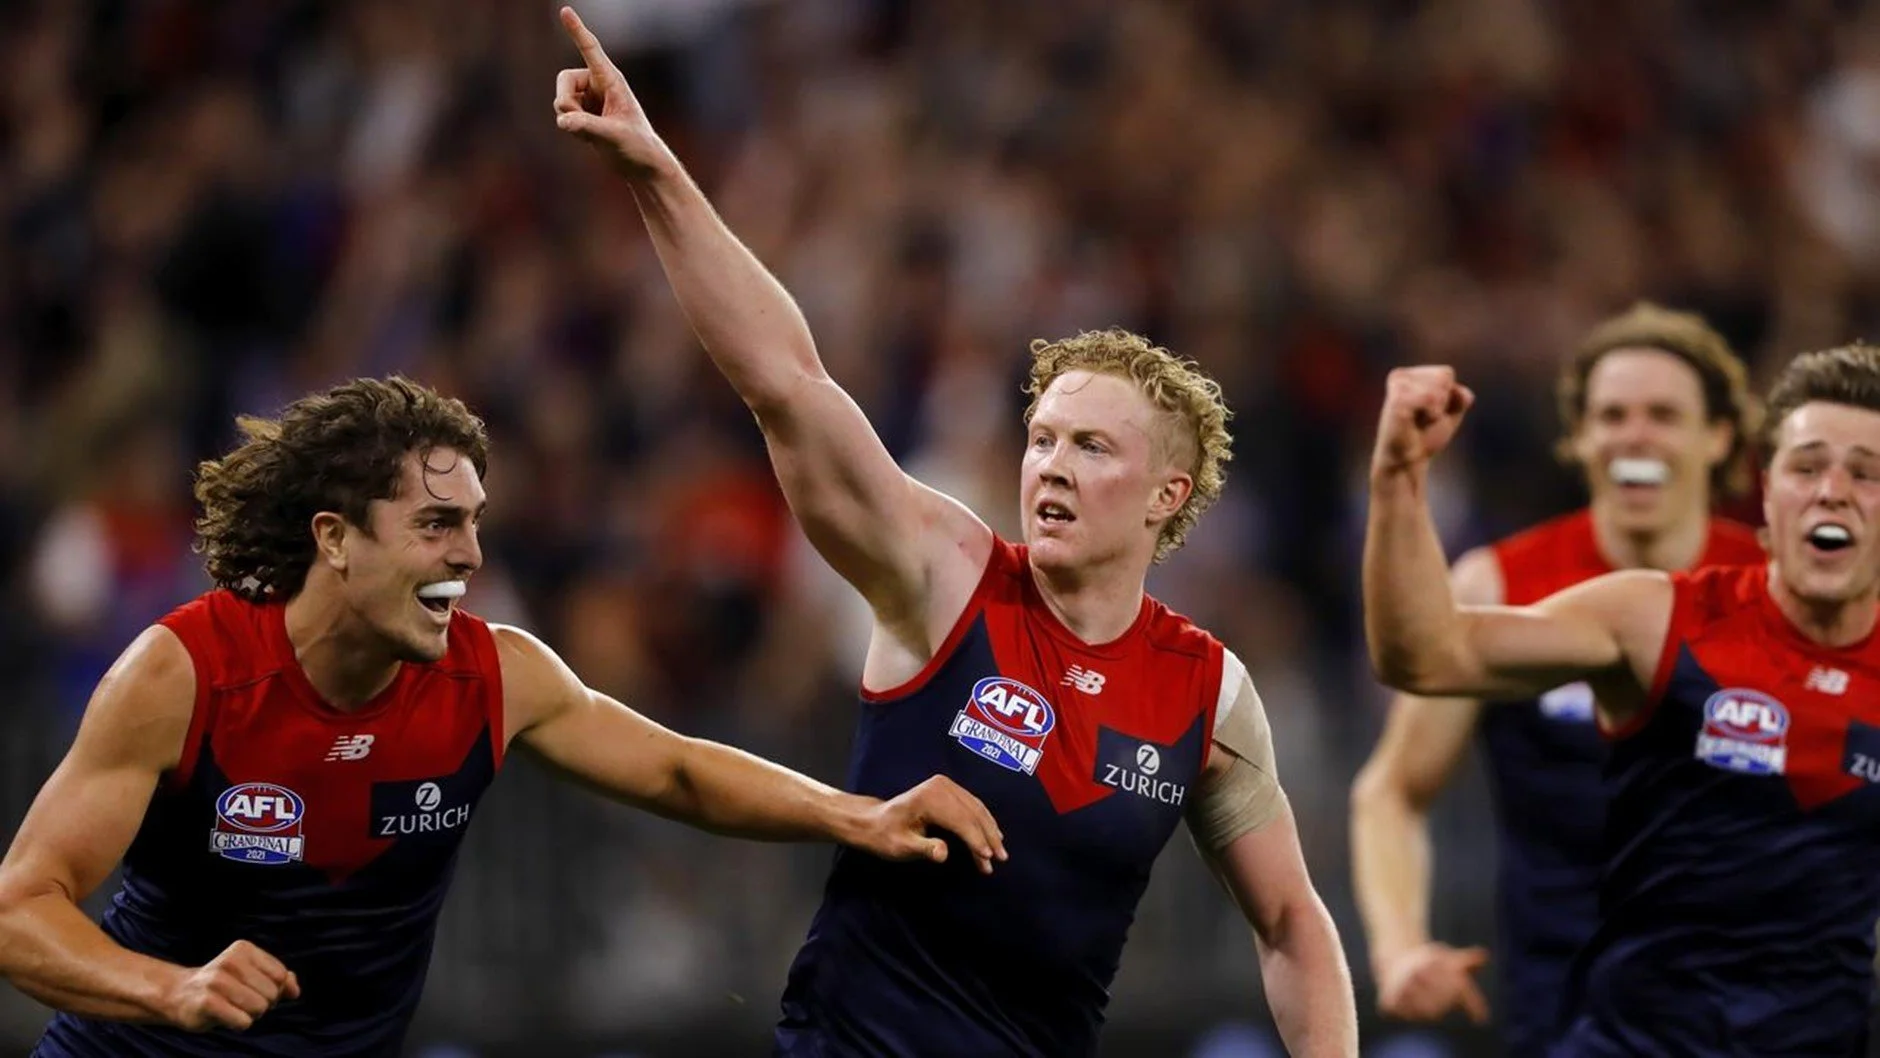
    Four years later and as far away from a Round 1 twilight game at Docklands as you can get – the 2021 Grand Final in Perth. We turn to the middle of the match. Marcus Bontempelli has put his Bulldogs three goals up and Melbourne are on the ropes. A goal to Bayley Fritsch sees the margin closed and the ball returned to the centre. In less than a minute of game time the Demons rip the ball out of the middle and score a further two. Even more astoundingly, ten minutes later they do the same again, scoring three goals in the final minute of the quarter.

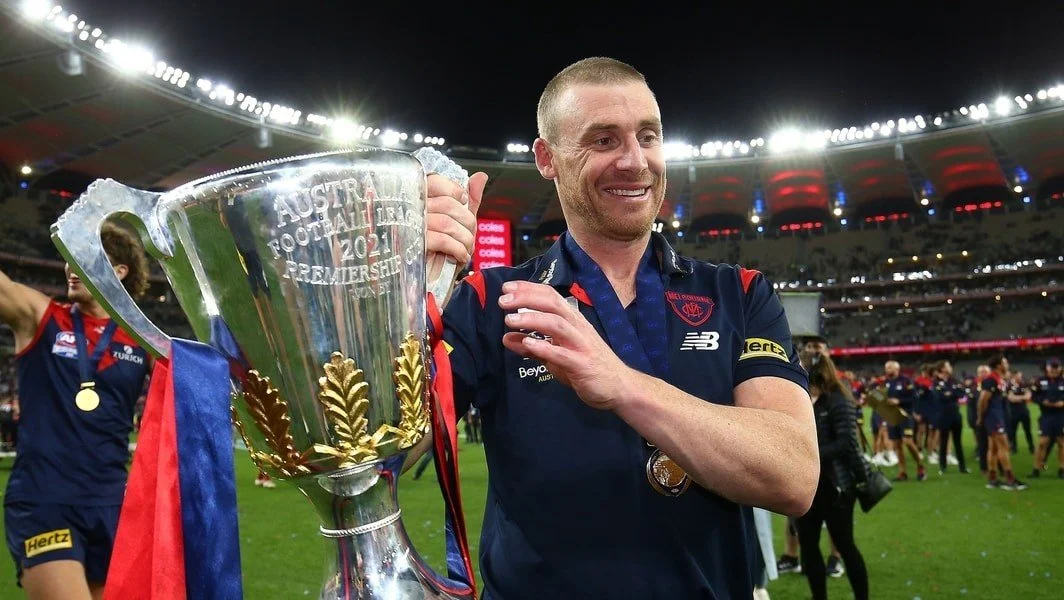
    The 6-6-6 rule means nowhere to hide and few ways for the Dogs to mitigate the damage. The result is the most astounding display of pure football since the peak of Geelong’s time under Mark Thompson, and possibly ever. Melbourne score 100 of the last 107 points of the match and Goodwin breaks the longest active premiership drought in the league.

    We move forward another four years, but like many stories we return to where it started. Docklands. Twilight time-slot. The opponents are once again St Kilda, although faces have changed or moved roles. Alan Richardson now plays confidant to Goodwin rather than competitor. Nick Riewoldt provides commentary as Nasiah Wanganeen-Milera anoints himself as the heir to St Nick in the St Kilda mythos with two last quarter goals.

    Like the Bulldogs four years prior, Melbourne finds their options limited in blunting a withering 9-goal onslaught. However, 6-6-6 still has an even more central role to play. Melbourne goes where few teams before have tread, and none with such dire consequences. They concede a free kick for a 6-6-6 infringement at the final centre bounce with scores tied. This leads to a Wanganeen-Milera mark and a goal after the siren to seal Goodwin’s fate.

    He would go on to coach the following week, and Brad Green denies the result played a part in his sacking, but it’s plain to see this is where Goodwin’s career at Melbourne was decided

    Throughout Goodwin’s coaching tenure his contribution to his game and club have continually and unfairly been diminished. Now is as good a time as any to look at his legacy.

    Taking the team to a preliminary final in 2018 was largely credited to the framework Paul Roos set up. Make no mistake though, this was light years away from anything Roos had coached.

    People finally gave Goodwin ownership of results when Melbourne finished in the bottom two the following year.

    The ultimate success of 2021 was attributed to hyperbolic assessment of Melbourne as one of the greatest playing lists ever assembled. Yet it was seen as Goodwin’s responsibility when those same players kicked themselves out of consecutive finals in 2023.

    Simon Goodwin took over from one of the more defensively-minded coaches of the modern era. Within two seasons he had forged the team into one of the most potent offences we’ve seen in a decade. He was then able to transform it once again into one of the greatest defensive sides in the game’s history. Most coaches don’t succeed in one style, yet Goodwin appears to be criticised more than anything else for not being able to guide a playing group through a third successful metamorphosis.

    Attack to defence

    David King’s analysis of Goodwin’s first match officially in charge heralded this as a new look – numbers behind the ball to generate rather than stymie attack.

    Goodwin wasn’t alone in using unconventional centre bounce setups through 2017-18 – Richmond, Adelaide, and North Melbourne each strayed from 6-6-6 more frequently in 2018. He was however a noted early mover and the results were significant.

    Goodwin also had something none of those other coaches had – Max Gawn.

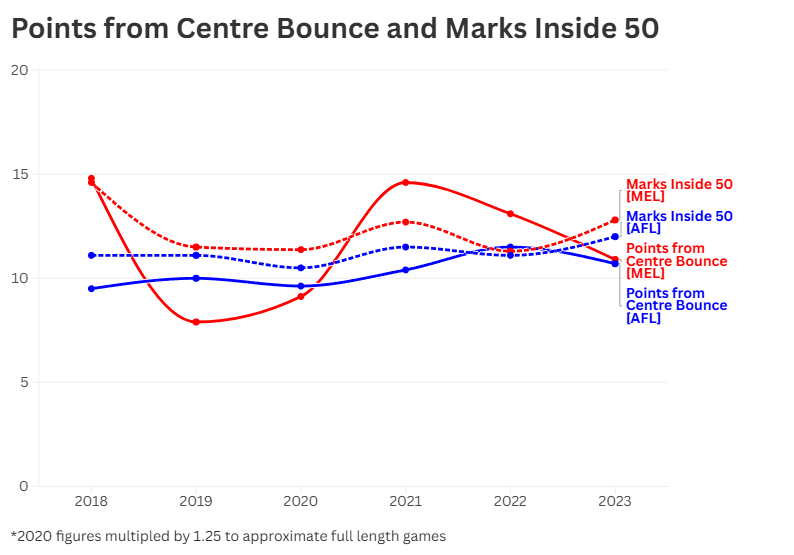
    He correctly backed Gawn to give them great starting position. By the time the plan had matured in 2018 Max was getting a hitout to advantage from 22.4% of ruck contests he attended compared to a league average of 13%. If they were getting first hands on it, having the players running through off the back of the square would create havoc for the opposition, offering multiple lanes to attack resulting in a league high 14.6 marks inside 50 per game (Only 2022’s Geelong bettering that figure since).

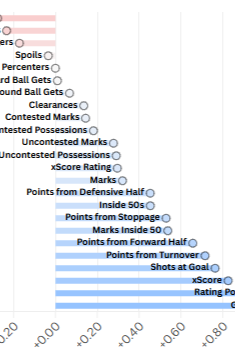
    Then between the 2018 and 2019 seasons the AFL brought in the 6-6-6 rule. Ostensibly this was to reduce the ability of teams to defend a lead by flooding numbers backwards. For Melbourne the impact was the reverse. From 2018 to 2023 points from centre bounce went up across the league but down for Melbourne, bringing the demons from +5.3 points vs the average to within 0.2 of it. Similarly, Melbourne’s advantage in marks from inside 50 would also evaporate over this time.

    It’s worth noting as a comparison that Adelaide faced a similar challenge. Their tactics were affected similarly by the introduction of 6-6-6. 2025 will be the first year since their 2017 grand final and minor premiership that they finish above 10th.

    The rule change alone can’t be blamed. Melbourne’s primary target up front, Jesse Hogan, went home to Perth after the 2018 season. Melbourne spent the capital gained from Hogan’s departure to bring in Gold Coast captain Steven May. Melbourne were pilloried for high-priced acquisitions of key defenders in consecutive seasons. Despite common wisdom being that defence wins more premierships than offence, paying for defenders seemed the greatest offense of all.

    >
    They’ve gone May and Lever as part of their big spend, who are very good players, but what influence can they really have on winning games of football?
    — David King

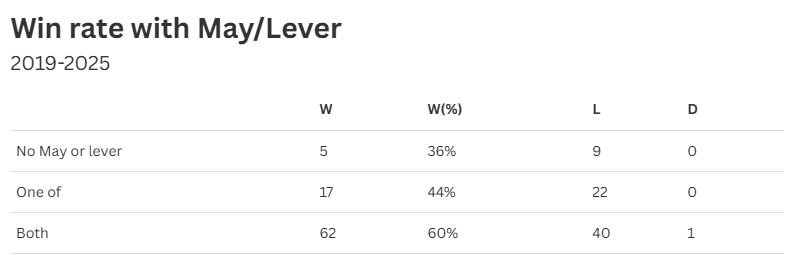
    Goodwin and his supporting team had correctly identified that in Gawn they not only had an elite ruck, but an imposing behind the ball presence. Coupled with May and Lever, and supported by pressure on the ball, they would form a wall that few teams from 2021-2023 were able to penetrate. This would be the best version of Simon Goodwin’s Melbourne – suffocating the opponent by controlling territory and denying the opportunity to convert possession into scoring.

    Another deployment of resources from attack to defence is worth noting – Highly regarded assistant Troy Chaplin. Chaplin started as a forwards/offence coach, but by 2021 had transitioned to defence and that’s where he won and finished runner up in the AFLCA Assistant Coach of the Year Award. This year saw him moved back to the forward line, perhaps indicating another shift in overall game style from Goodwin, though ultimately not one he would see out. Chaplin has since been appointed caretaker coach for the remaining three games.

    A dynasty gone begging

    Much is made of the idea of a wasted dynasty at Melbourne under Goodwin. This argument is absurd. Goodwin achieved what only three other coaches have, and none for six decades before him – bringing the Melbourne Football Club to the top of the mountain. Many of the same critics pushing this narrative now, were deriding the state of the list in 2020 and arguing that Melbourne had severely over-estimated the talent it had available.

    Across the entirety of 2021-2023 Melbourne spent a total of two rounds outside the top 4. This included an unbroken two years, bettered in the AFL era only by Essendon across 1999-2002. They dominated the 2021 finals series with margins of 33, 83, and 74. In 2022 both finals saw them in winnable positions, up by three goals in the second quarter against Sydney and five goals just before half time against Brisbane.

    2023 saw them lose to eventual premiers Collingwood by 7 points. Errant kicking and a career ending injury to Angus Brayshaw early in the match proving impactful. The following week against Carlton they surrendered a lead late while kicking 9.17 and losing by just two points.

    Football is like poker. There are elements outside your control, but you can make sure the decisions you’re making leave you in a winnable position. Goodwin’s game plan consistently put Melbourne in a position to win. In 2021 the cards fell for him, the following two years they didn’t. That shouldn’t invalidate the process behind it.

    The final act

    2025 has been a curious year as a Demons supporter. While the results speak for themselves, it’s possible to read either optimism or pessimism into the broader picture.

    Melbourne came in with high internal expectations. They had also traded their 2025 first round pick away to help secure Xavier Lindsay and Harvey Langford in the previous draft.

    It was a surprise then that they named 5 debutants for their Round 1 match vs GWS. Excluding the first matches played by a new club, only three teams have named five debutants in the AFL era – Melbourne in 2025, Collingwood in 1995, and Richmond in 1993 – all in Round 1. The team got within a kick and arguably should have won.

    If Round 1 was a surprise Round 2 was a seismic shock. A dismal 10 goal loss to the Kangaroos, who they previously hadn’t lost to since 2019. The result was comprehensive enough for pundits to declare that not only had North Melbourne finally arrived, but that Tristan Xerri had taken the mantle of best ruck in the competition from Gawn. Both claims would prove premature.

    Melbourne limped to 0-5 with a percentage of 60 before a 6-week uptick in form saw them recover to 5-6. The most impressive performance was a two goal win against the reigning premiers Brisbane at the Gabba, having trailed all day.

    The next three matches saw them lose comfortably against fellow bottom-dwellers Port Adelaide and St Kilda, yet come within a point of beating Collingwood.

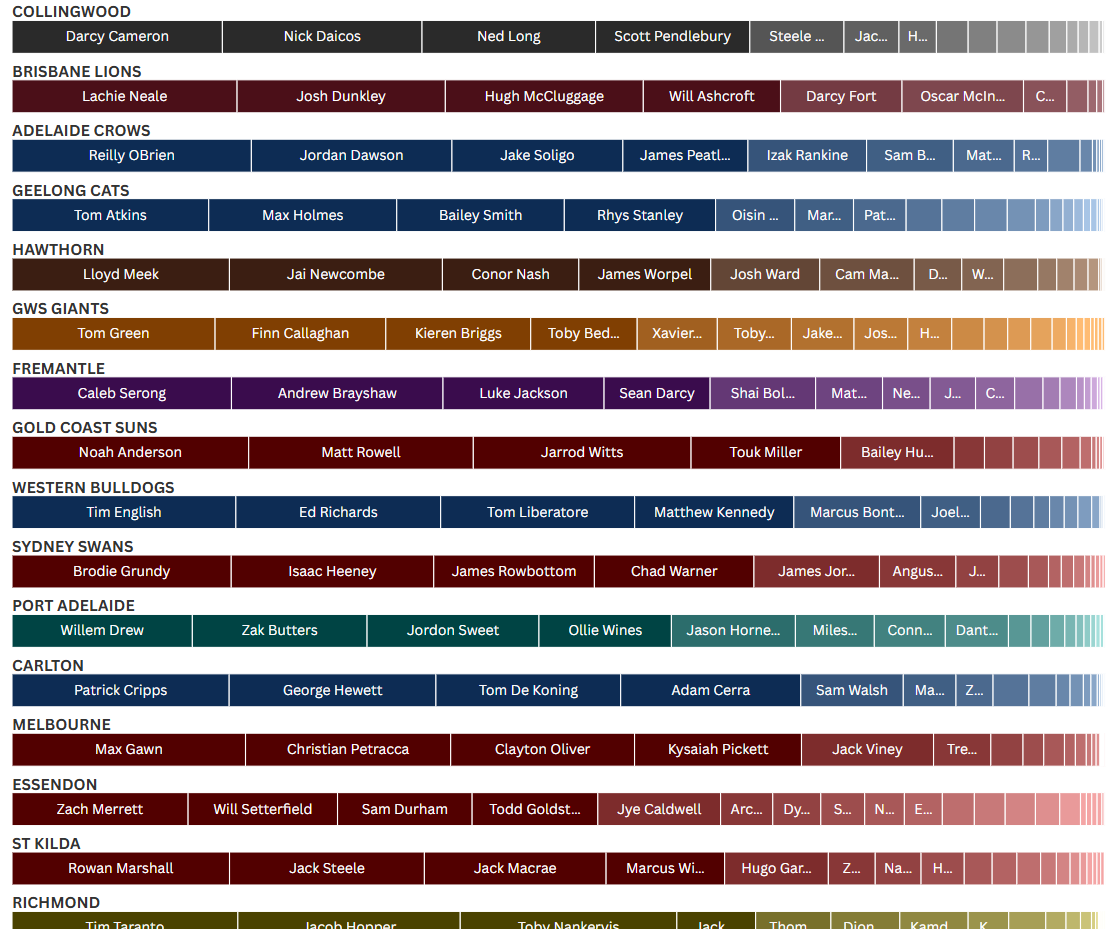
    To Round 19 Melbourne had been fairly unadventurous with it’s centre bounce mix. 84% of its total centre bounce attendances were taken up by the top 5 players, second only to Gold Coast. With the exception of Kysaiah Pickett’s move into the midfield, the names were familiar – Gawn, Petracca, Oliver, Viney.

    Caleb Windsor has finally seen some time at the coalface since then, but arguably the picture is even more static over the last 5 weeks. Only 8 Melbourne players have attended a centre bounce in that period – this includes 2 attendances by Xavier Lindsay and Jacob van Rooyen relieving Gawn in the Ruck. The season has been dead for a long time, but Goodwin has likely been coaching for results out of necessity. In doing so he has gone back to the old guard. It’s hasn’t given a great look at what the midfield of tomorrow will eventually be. It also hasn’t provided results. You can’t afford to waste a game in footy. I’d argue that’s what the tail end of this season has largely been.

    The attitude to selection has faced similar criticism. Established players have been given leeway despite poor form while fresher faces have seen a revolving door. To some degree this is understandable. The older players have a body of work to show what they can return to. Goodwin trusts them to reach that level again. However, this needs to be balanced with allowing younger players to find their feet in a team.

    Excluding injuries and suspension, each of these players have been given single-match selection stints at AFL level this season: Turner (twice), Langford, Woewodin, Johnson, Howes, van Rooyen, Jefferson, Laurie, Tholstrup, and Sharp.

    Laurie’s only game for the season saw him named Substitute and get just 20% time on ground before being dropped again the following week. Similarly Taj Woewodin and Harvey Langford saw single-week call-ups used as the sub, although Langford has since cemented his spot in the side.

    From the outside it looks like the club was pulled in two different and incompatible directions. Elements saw this as the launching pad for a list refresh, while the mounting pressure on Goodwin seemed to have him coaching for the result week by week. In the end neither side got what they wanted.

    The end should not be the whole of it though. Simon Goodwin made huge achievements in his time at Melbourne. I’ll never forget sitting in 90,000+ crowds in the finals against Geelong and Hawthorn in 2018. The images of the 2021 Grand Final will forever be etched in my mind, even if I didn’t really believe we were safe until Luke Jackson put us 10 goals clear 24 minutes into the final quarter.

    I feel an immense and enduring sense of gratitude to Simon Goodwin and a love for his era as coach. I could turn up week in week out knowing I was going to see a truly elite team perform. While I’m sure there are raw and deep wounds now, I hope more than anything that in time he’ll feel that fondness and take great pride in what he has done.

    I also hope that the club leadership recognises that trusting a process to identify the best assistant coach available is almost universally a better option than going for a big name. We needed Paul Roos when he was appointed, not so much for his coaching ability but for the stability he provided. We were at ground zero as an organisation and needed a rock to build on. I hope we’ve come somewhat past that and can look not just to survival, but to success as we did when handing the reins over to Goody.

  • In the Margins

    In the Margins

    What statistics are correlated with winning and losing in season 2025? And how do those correlations differ for different teams with different strengths and game styles?

    This article comes with an acknowledgement and a few disclaimers. I wouldn’t have been able to do this without the incredible work of Andrew Whelan of WheeloRatings.com – having such a rich data source as a base meant I could take the time to pull together the analysis.

    The disclaimer, for the purposes of this piece, is that I’ve used really simple linear regression with r2 as the basis for determining correlation. It’s not something you’d use to try to put a predictive model together, but it does enough to allow us to draw some interesting points.

    Another disclaimer is that correlation is not causation, and doesn’t establish directionality. For example, West Coast’s margins are more strongly correlated to their ruck output than the rest of the league. Is that because when Bailey Williams and Matt Flynn have managed to win the battle, Harley Reid is able to go to work, or is it that an opposing ruck getting bested by them is emblematic of a team ripe to be beaten by West Coast?

    It could also be that a given stat is a real non-negotiable for a team, it’s something they can be relied to win week in week out regardless of the end result – which would be reflected in a low correlation. The data can hopefully lead us to some interesting points for discussion, but can’t be definitive one way or the other.

    Lastly,it is worth noting that I have used stat differentials (team minus opponent) rather than raw stats when correlating to margin, so keep that in mind.

    With that out of the way, let’s get into the statistical correlations.

    As you’d expect, kicking more goals than your opponent is very strongly tied to the final result. Champion Data’s rating points are also very closely correlated.

    We can see that xScore has a higher correlation with victory than the pure number of shots, which we’d expect from a measure that incorporates not just the volume but the level of difficulty of shots taken.

    Among score sources, Points from Turnover appear more valuable than Points from Stoppage, unsurprising as turnover is the primary scoring source. Points from forward half are a better predictor than points from defensive half.

    xScore rating, that is how well the teams are executing on the shots at goal they generate, appears to be worth about as much as a gap in uncontested possessions, which is a better predictor than contested possessions or clearances.

    Commit more clangers than your opponent and you’re likely to lose, however the correlation is relatively weak (to have a clanger you’ve generally got possession first).

    Defensive half pressure acts is a rare example of a “positive” stat with a negative correlation to margin. If you’re racking them up, it means both that the ball is in your defensive half and the opponent has control of it.

    We’ve got the league averages, so where and how does each team diverge on individual statistics?

    The arrow indicates the direction a team diverges from – a red arrow to the left means that stats correlates less (or more negatively) with margin for the team than for the league at large and blue indicates stronger correlation.

    Adelaide win through having a better spread of goalkickers than their opponents. They’ve had more unique goalscorers on 10 occasions for an eye-watering average margin of +62 points. Handballs are more valuable in their games than average, and kicks less so. The gap in value of points from forward half compared to defensive half expands.

    They also don’t rely on a high mark inside 50 differential as much as the rest of the league. To revisit our disclaimer, this doesn’t necessarily mean they’re bad at it, just that it hasn’t correlated with winning and losing to the same degree it has for other teams. Adelaide has lost 5 games for the year – in three of them they won marks inside 50 and in a fourth they drew. They’ve lost marks inside 50 three times, and won two of those games. They’ve drawn it three times for a three point loss and two 10+ goal wins. They’ve also managed to win by 10+ goals with a +0,+0,+1, and +2 marks inside 50.

    Brisbane aren’t converting xScore into wins particularly well (because they’re 4th worst in goal accuracy this year). They’re getting more value from centre clearances than most teams, and appear to not be as affected by turnovers. This is partly driven by the fact that they haven’t had a turnover differential larger than 8 in the positive or negative whereas a quarter of games league-wide have blown out past this.

    Carlton don’t often lose more defensive 1 on 1s than their opponent, only on four occasions so far and never by more than two. Their biggest wins against West Coast and North saw them win the stat by 6 and 4 respectively. When they’ve been required to make more defensive half pressure acts than their opponent however they’ve got an average margin of -24 compared to +20 the other way. 

    Similar to Adelaide, Collingwood benefit from having a better spread of goalkickers than their opponents. All of Collingwood’s losses have come while winning the inside 50 count and three of the four came while also winning the marks inside 50 count, including a three point loss to Geelong while recording their best differential for the year (+9).

    They’ve only lost the tackle count once all year, in their opening round drubbing by GWS. While they recorded a solid +21 tackles in their 1 point loss to Fremantle, the other two losses saw low differentials (for Collingwood) of 8 and 10. Three of their four biggest wins have matched up with their three biggest tackle differentials. Their pressure game also helps explain why they can lose the kick count convincingly and still come out on top. 

    Essendon want clean hands. Their average result is a 47 point loss when recording more ineffective handballs than their opponent, compared to just a 9 point loss when recording fewer. This is mirrored in effective disposal tallies. It’s not surprising, decimated by injury my best guess is that they just don’t have the drilled structures in place to respond to errors so when things go bad there is little damage mitigation.

    It’s been a common theme of criticism that Fremantle can tend to rack up meaningless uncontested possessions. They’re 7-3 in games they win the count and 6-3 when losing it, but with a slightly better average margin. By comparison their average margin when winning contested possession is +26.2 compared to -10 when losing it.

    Geelong benefit from winning the intercept game as well as tackles inside 50. When the Cats have recorded +8 tackles inside 50 or better they average a 65 point win. On the two occasions they’ve achieved -8 or worse they’ve lost by 18 and 41. They also don’t mind getting on the positive end of some xScore variance. Points from stoppage aren’t as big a predictor for them as others.

    Gold Coast are towards the bottom of the league for post-clearance ground ball, but they’re 8-1 when they’ve won the stat. They boast the same record when winning crumbing possessions, but are dead average in the stat across the season.

    GWS have only won points from centre bounce in 6 games this season, but they’re 6-0 with an average margin of +45 when doing so. They’re not as dependent as most teams on building an xScore advantage to win, because they outperform their opponents on xScore rating by a maddening 10+ points per game.

    I’ll be back next week to step through the remaining nine teams as well as hopefully looking at which teams do or don’t have their performance captured well by Rating Points.

  • Where it all begins

    Where it all begins

    Centre bounces are one of the things that sets Australian football apart. Not so much for the novelty of the bounce, but because after a major score possession is reset to neutral. In most sports play restarts with the ball in possession, whether alternating (e.g. netball) or given to the team who conceded (e.g. basketball, soccer).

    That makes centre bounces an incredibly potent weapon. There aren’t any brakes that the rules applied, only what the opposition can summon. A patch of dominance can reshape the course of a game in mere moments.

    Who’s delivering at centre bounces this year then?

    Getting the clearance isn’t the only way a player can contribute at a centre bounce. First possession is important, rucks can add a lot through hitouts to advantage, and defensive pressure is critical. For the purpose of a single number to measure impact though clearances work pretty well.

    As expected, down the bottom right in the “high attendance, low clearance” group we see the primary rucks. Solo rucks are there 80% or more of the time, but they’re generally not going to be winning clearances themselves at a high rate.

    Above that we’ve got some of the other heavily used midfielders. Caleb Serong stands out among them as the only player attending a high number of clearances to keep a clearance rate (clearances / bounces attended) above 15%.

    The top left is where things probably get the most interesting. We’ve got three players who have attended (relatively) few bounces this year but when they do are making things happen at an alarming rate.

    Going back as far as 2021 (and limiting only to players with 100+ CBAs in a full season (or 75+ so far this year), Nasiah Wanganeen-Milera, Joel Freijah, and Cam Rayner are the only players to have a clearance rate above 20% across a season (Paddy Dow finished with exactly 20% in 2023).

    How these three got to their CBA numbers is quite different though.

    Wanganeen-Milera has had four games with 40%+ attendance, including 79% last week, his other 14 games have seen two in the 20s, three below 10%, and the rest with no attendances. It seems clear the Saints are looking to build into him the capacity to be an elite primary midfielder, rather than a half-back who rotates through.

    Freijah on the other hand has seen between 20% and 40% of bounces in 11 of his 18 and attended at least 5% every week. Rayner is somewhat similar, although with a higher floor and lower ceiling, all of his games falling between 7.7% and 25%.

    This brings us to the question of how teams are sharing the load more generally.

    The chart is ranked in ladder order as of the end of round 19. Teams where the dark colour extends further right represent a higher concentration of CBAs among a smaller number of players – for example 93% of Brisbane’s CBAs have been taken by 6 players – Neale, Dunkley, McCluggage, Ashcroft, and the two rucks in Fort and McInerney. By comparison Essendon and West Coast use 13 and 12 players to fill out the first 93% of CBAs.

    What does it mean to have a settled centre bounce lineup? To be able to distil down into a single number I’ve chosen a measure of what % of centre bounce attendances are filled by the first 8 players across a season. This is arbitrary to an extent, but looking through the data appeared to give a reasonable point of separation between teams. It then allows us to compare it to an output – centre clearance differential.

    We can see two things. Firstly a higher proportion of CBAs from a core group appears to correlate to a better centre clearance return. This matches intuition, one of the primary drivers of a high concentration of CBAs is health. Having your top tier midfielders available throughout more of the season will naturally yield better results.

    The second is that over the last 5 seasons CBAs have become more concentrated among a smaller group of players. Four of the 9 most concentrated CBAs occur this year – although for very different ladder results with the teams being Brisbane, Adelaide, Melbourne, and North Melbourne. 

    We also see Richmond and Port Adelaide as the most concentrated teams to have averaged a -1 differential or worse further showing that consistency alone isn’t a guarantee of even centre bounce results.

  • Shark Week

    Shark Week

    There’s a lot still to chew through in the data behind last week’s ruck piece.

    Given that Shark Week starts this Sunday this topic seems only fitting.

    For those unaware, Champion Data gives a definition of a sharked hitout as “A hitout that directly results in an opponent’s possession.”

    [author’s note: I’ve had to infer sharks from the data I’ve got which probably results in some false positives. I’d expect my numbers to be a little higher volume and lower quality, but should still be broadly representative]

    So, who is Jaws to the AFL’s Amity Island?

    Jack Macrae has a clear lead feasting off opposing rucks, and the list overall isn’t too surprising – elite inside midfielders who are great at winning their own ball.

    On the other side of the ledger it’s Matt Flynn who’s chumming the water most regularly this year.

    If we expand it out to a team-wide scale we can find Adelaide has the worst differential in the league between sharking and being bait, which isn’t totally surprising as Reilly O’Brien gets sharked regularly.

    St Kilda being on top is somewhat surprising, while the Bulldogs at #2 are to be expected with the mids available to them.

    I’ve got data going back to 2017, so let’s see if there are any particular feeding frenzies. On top we’ve got Brisbane feasting on Adelaide to the tune of 26 sharks in their round 9 matchup last year.

    Finally, over that expanded timespan who of our sharks has a taste for a particular player?