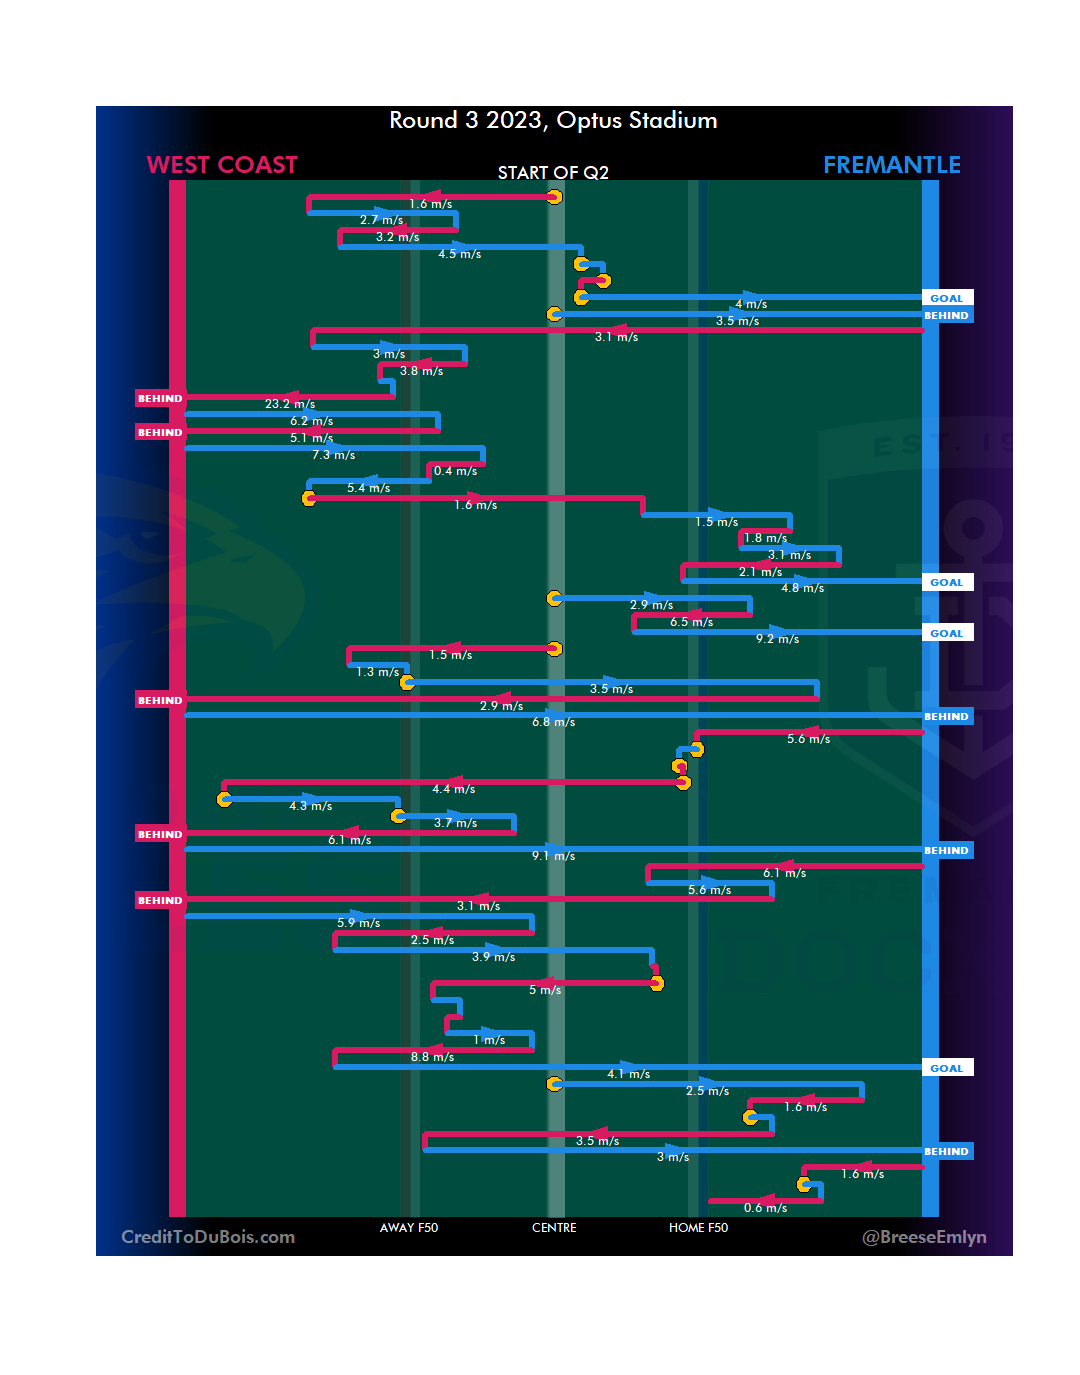
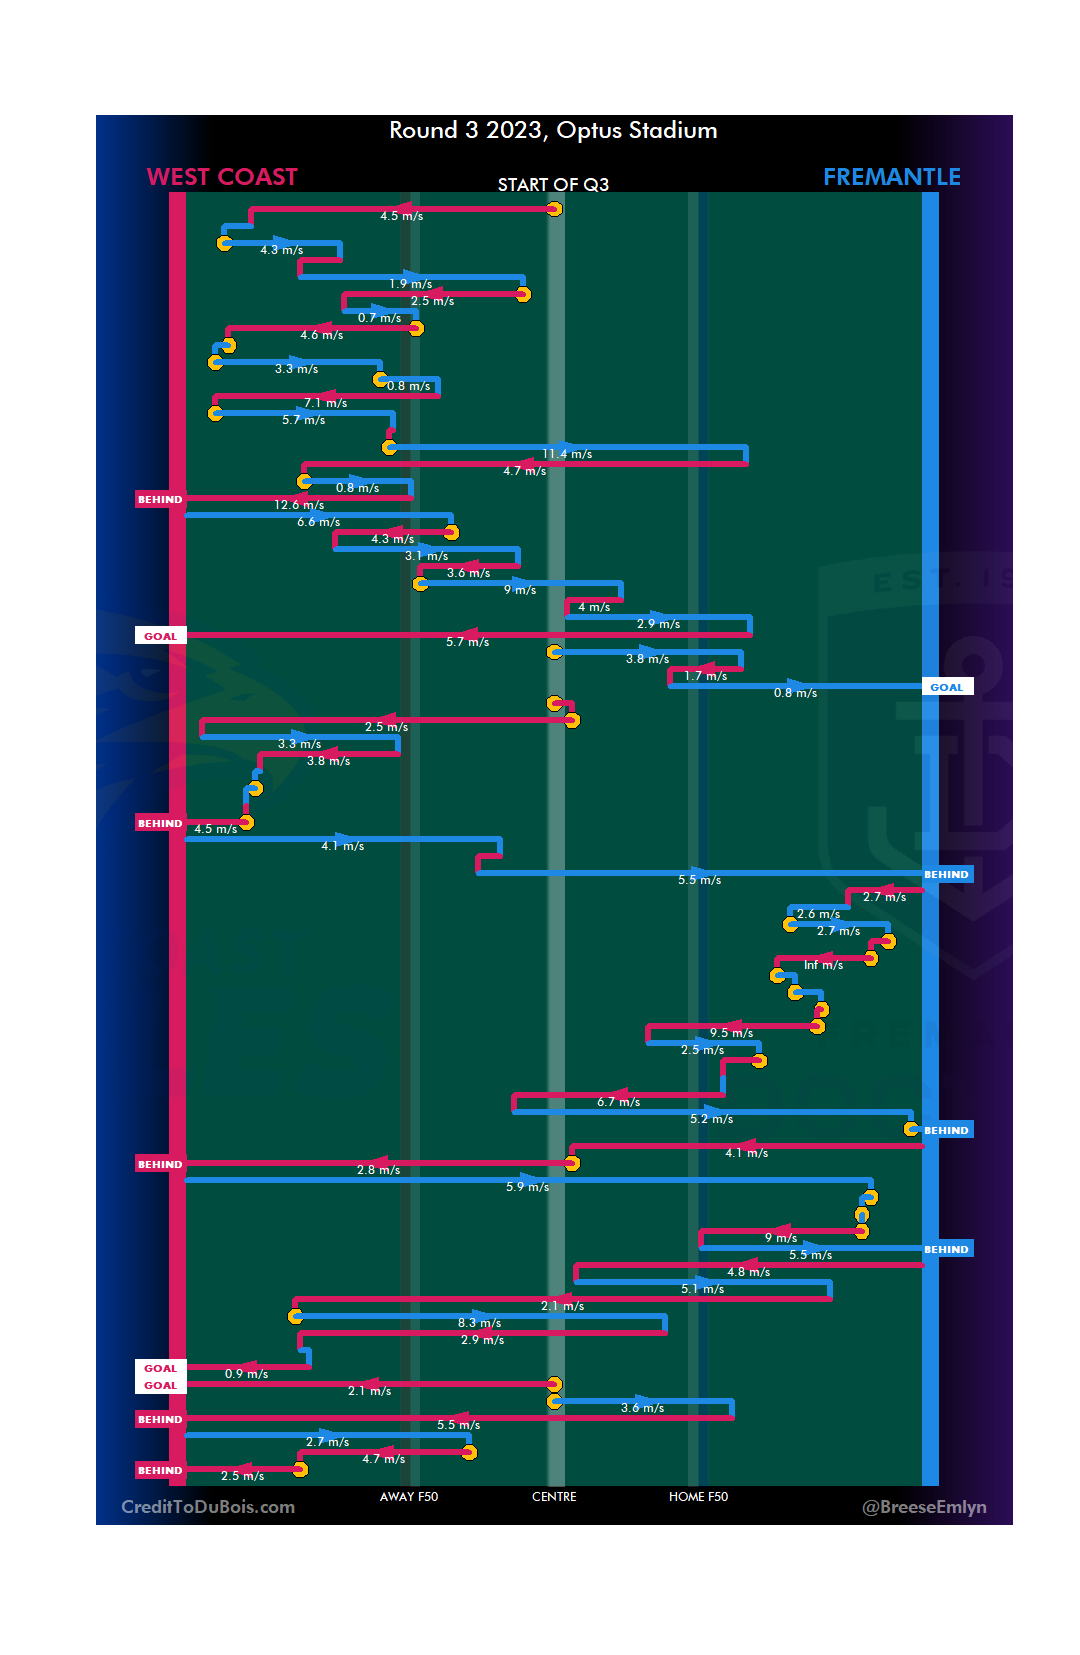
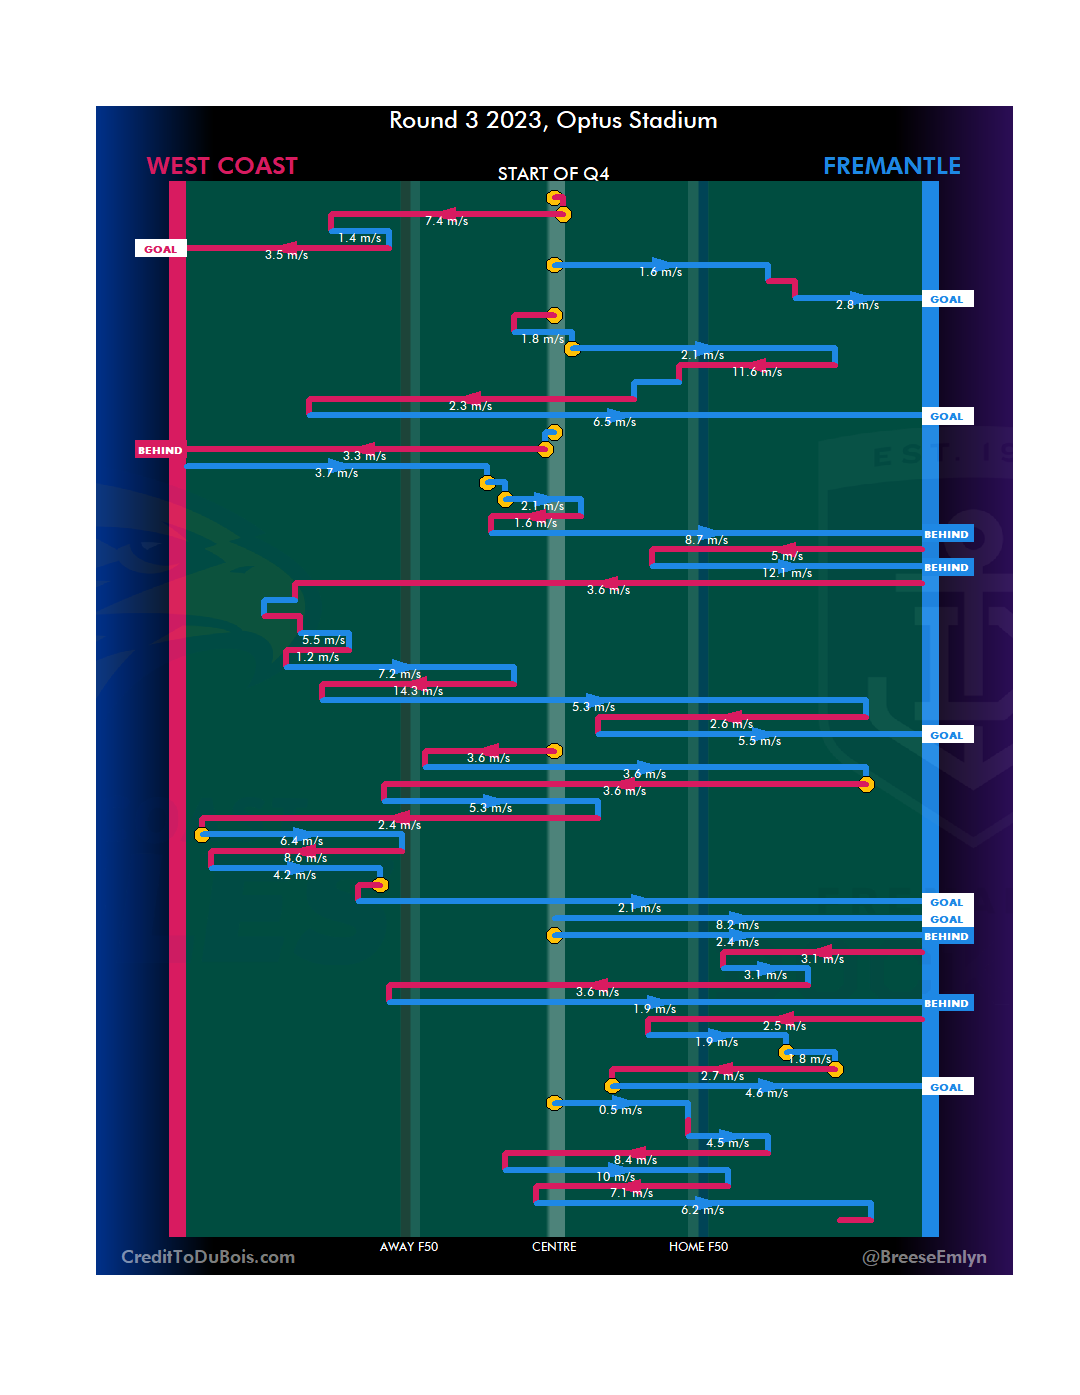
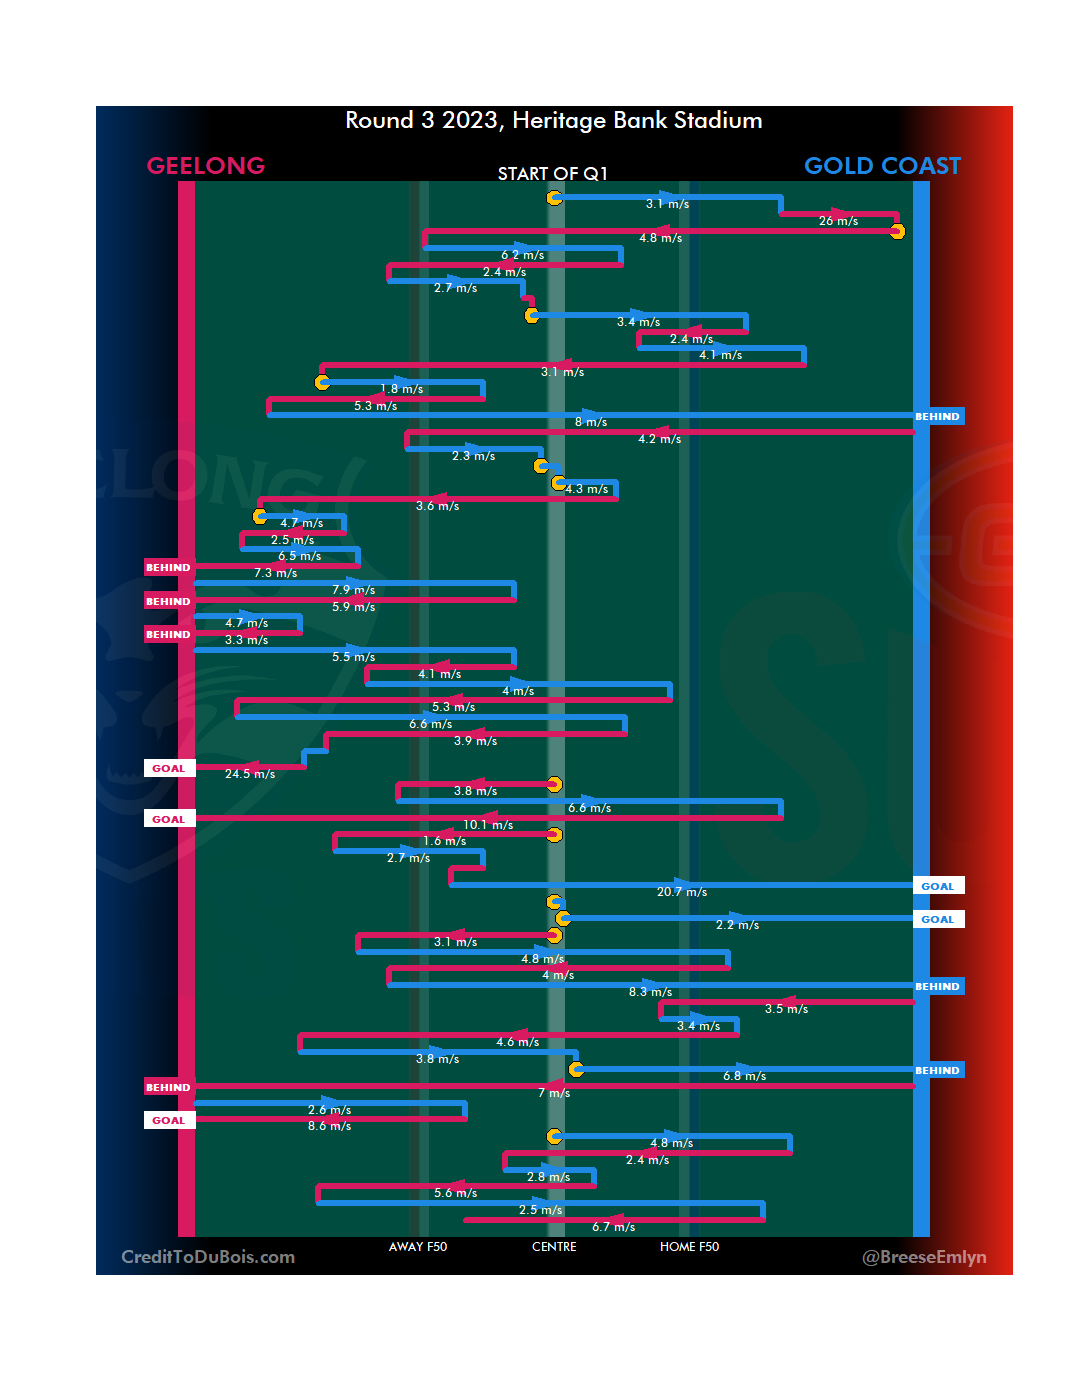
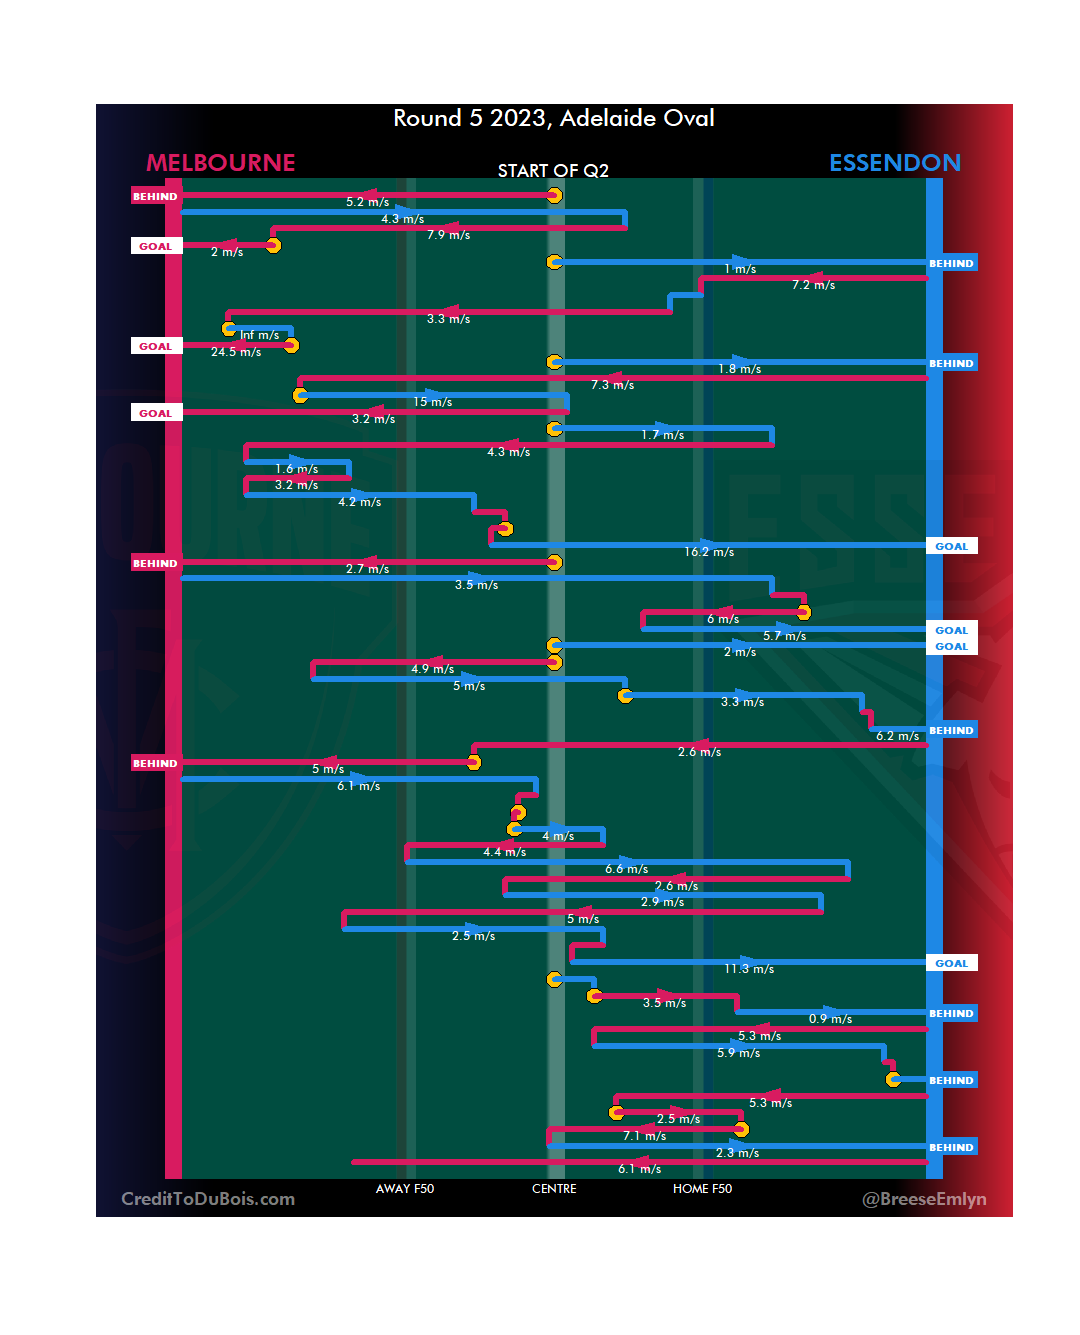
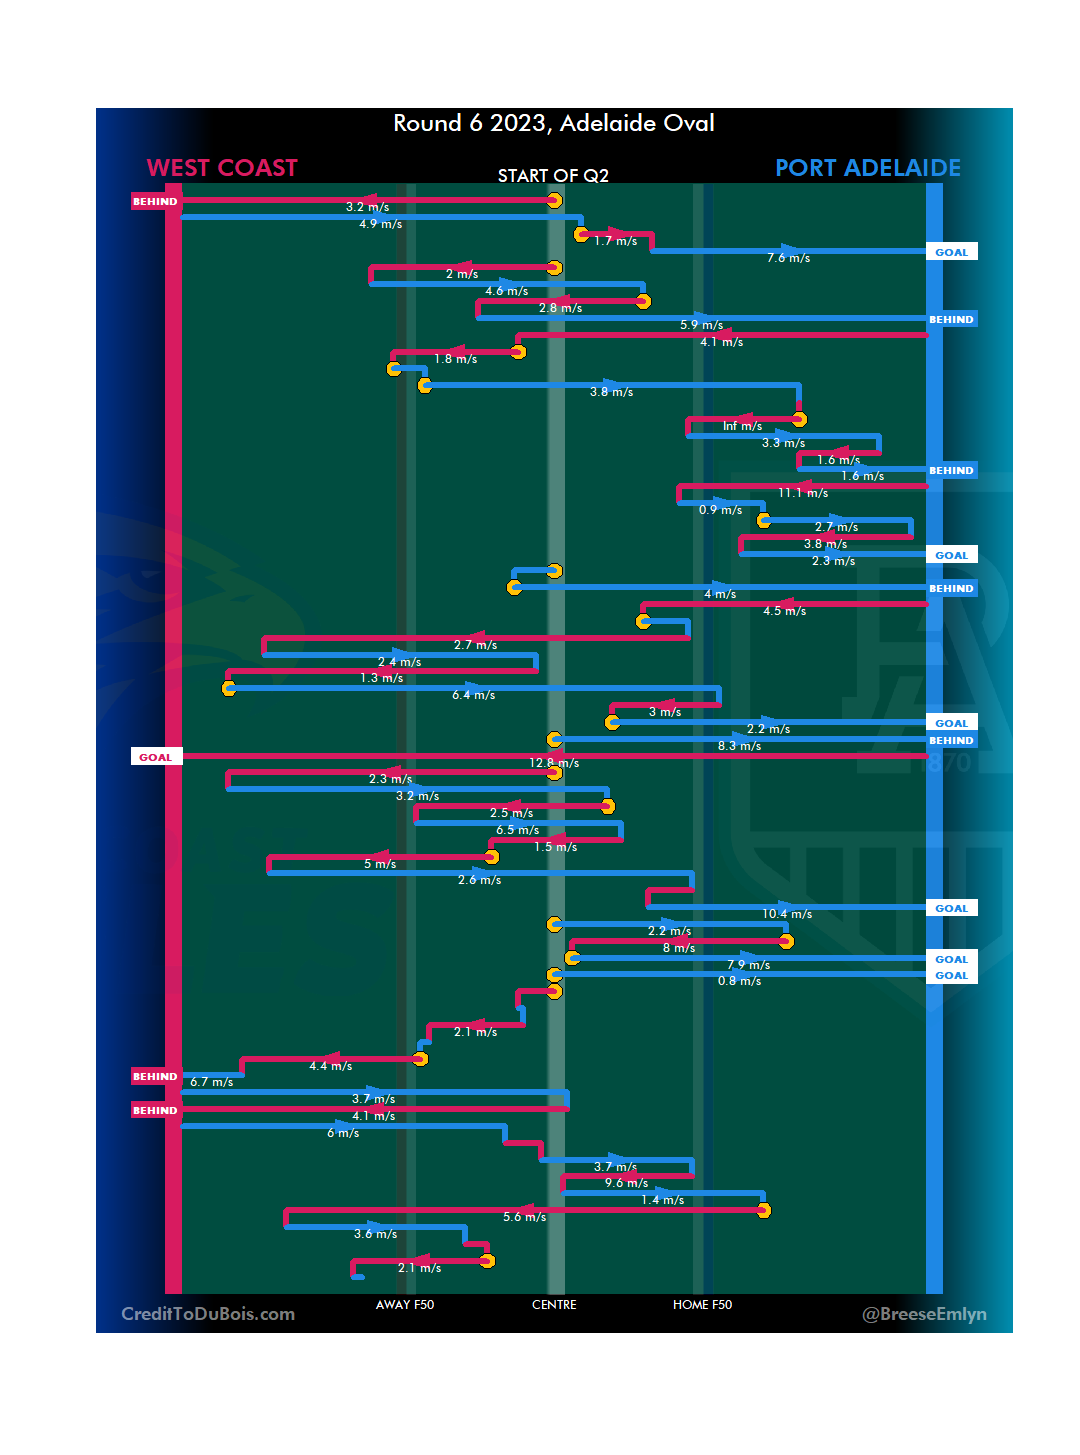
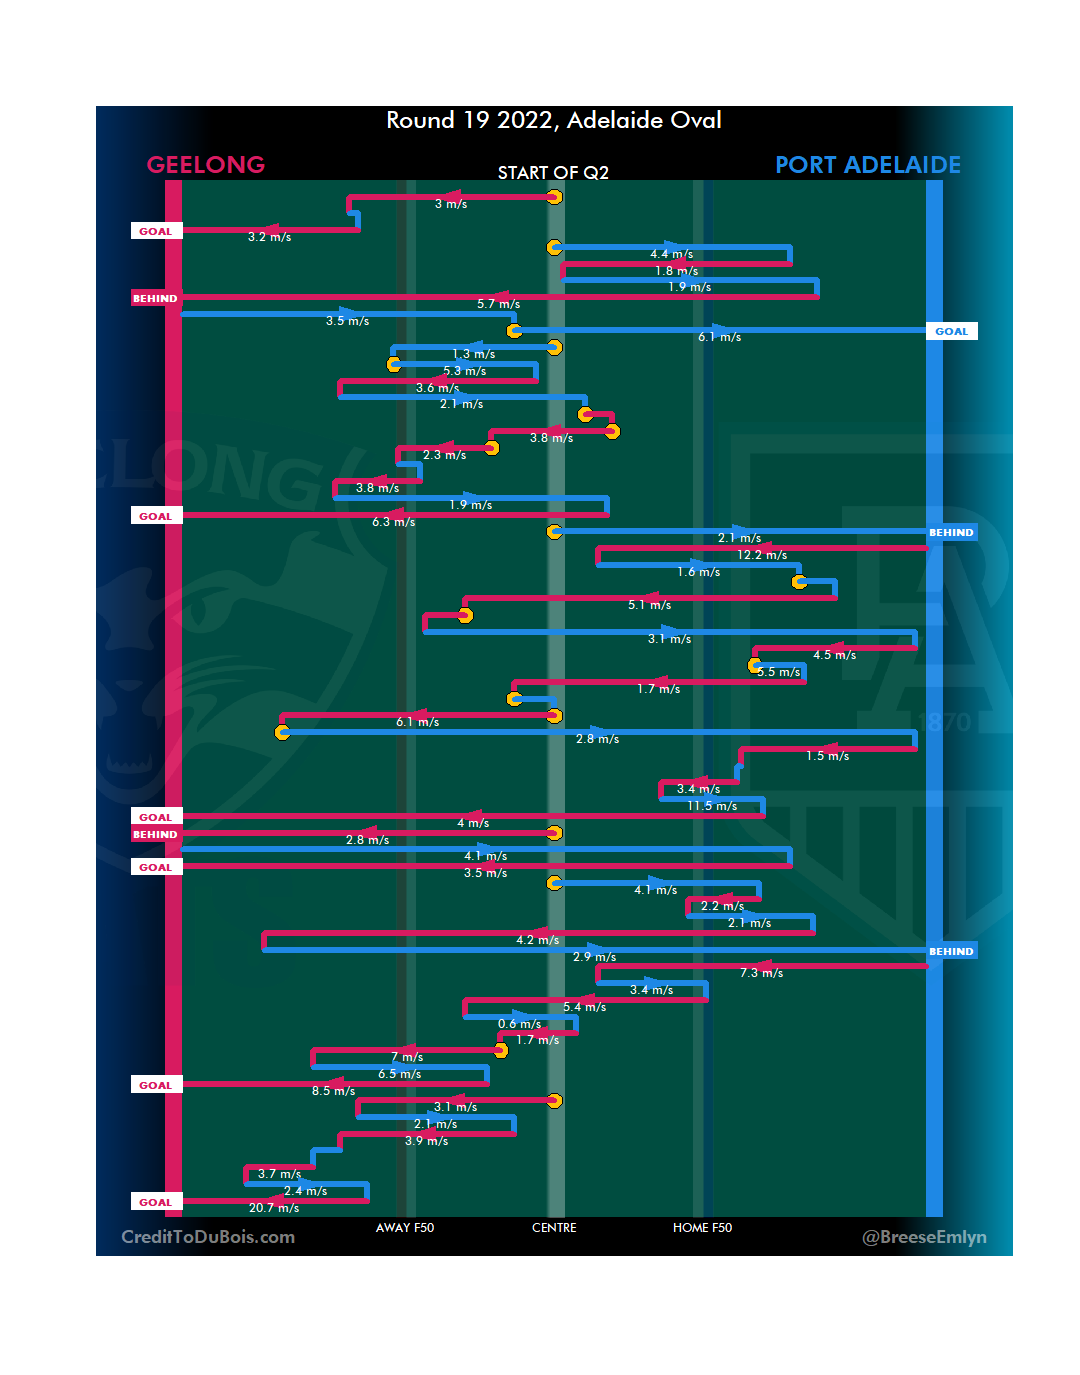
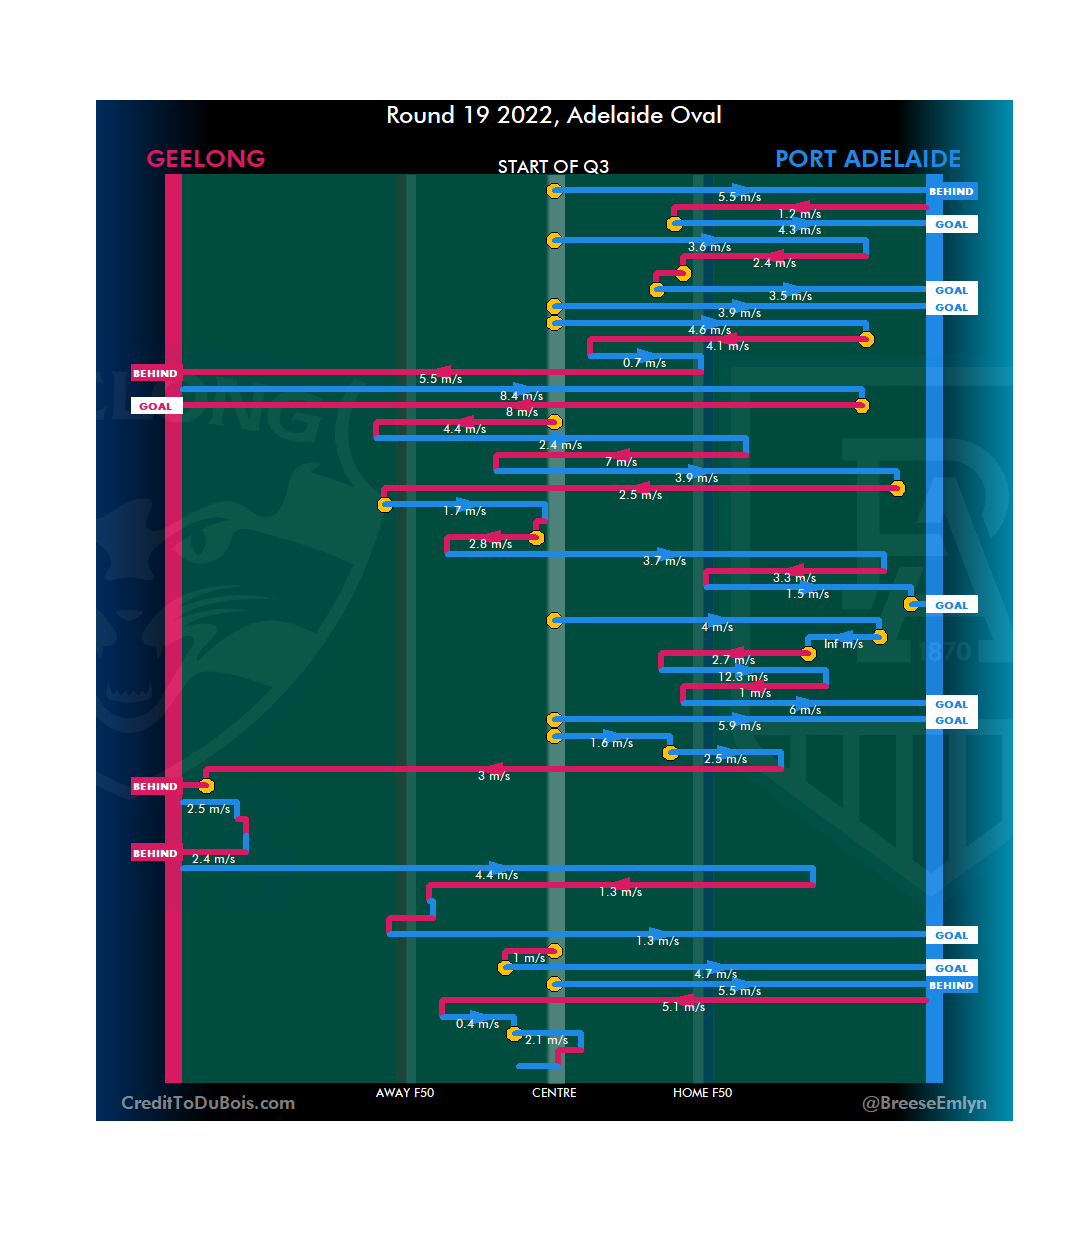
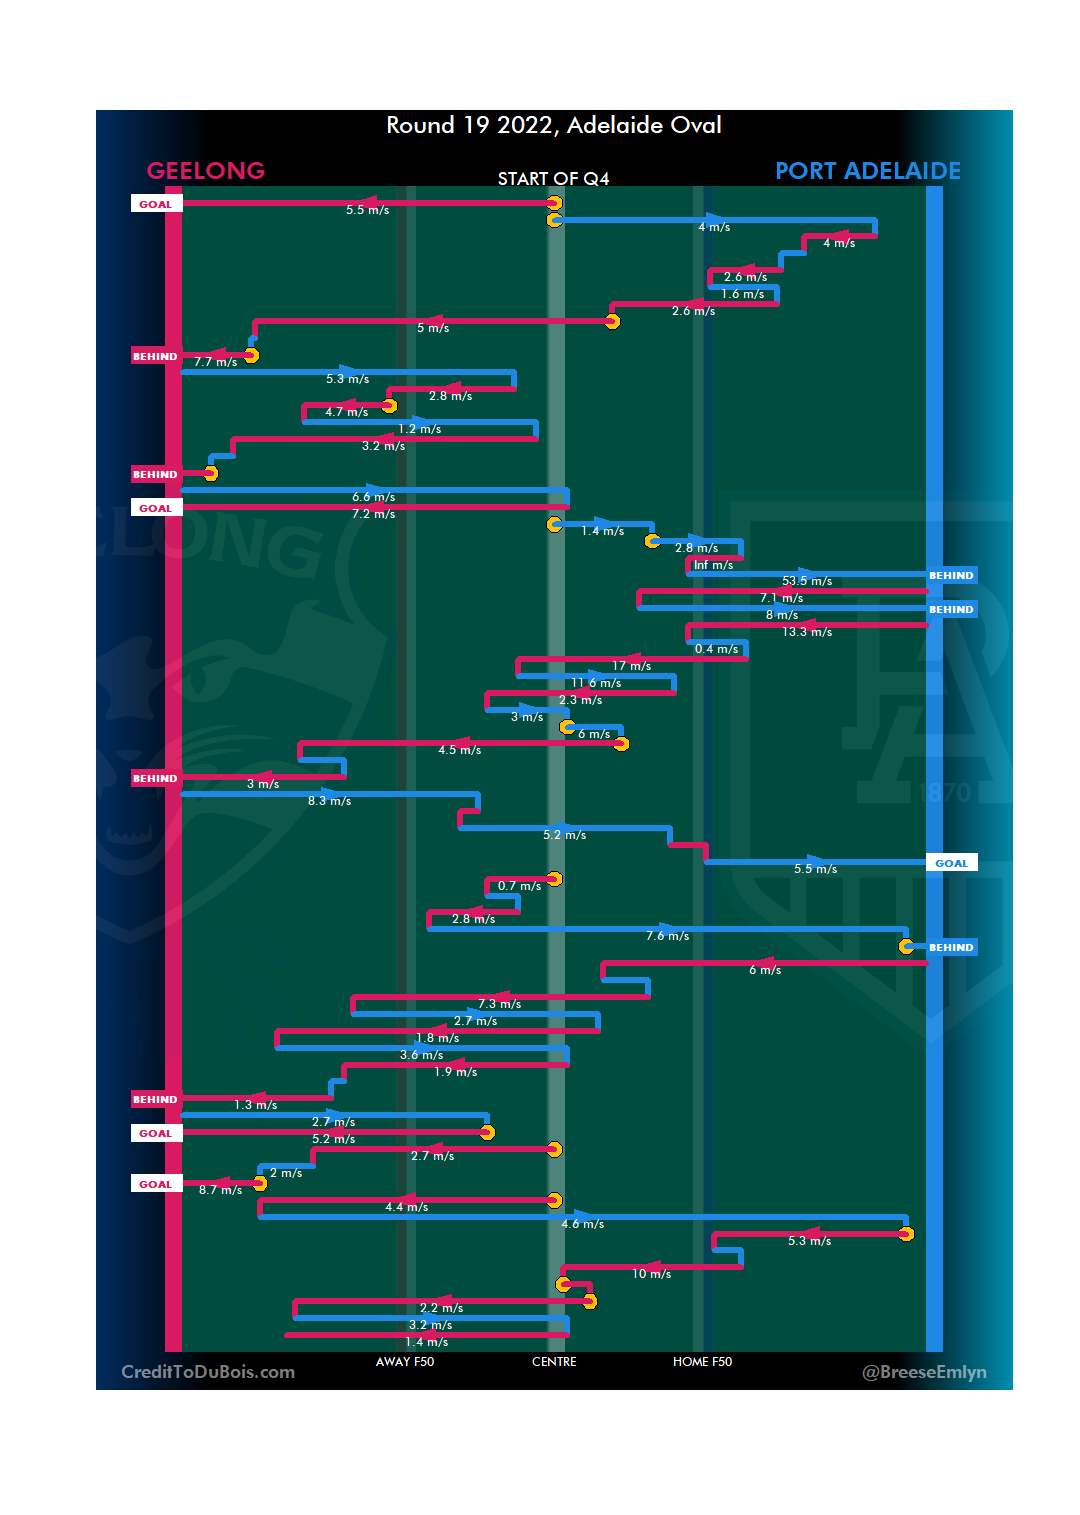
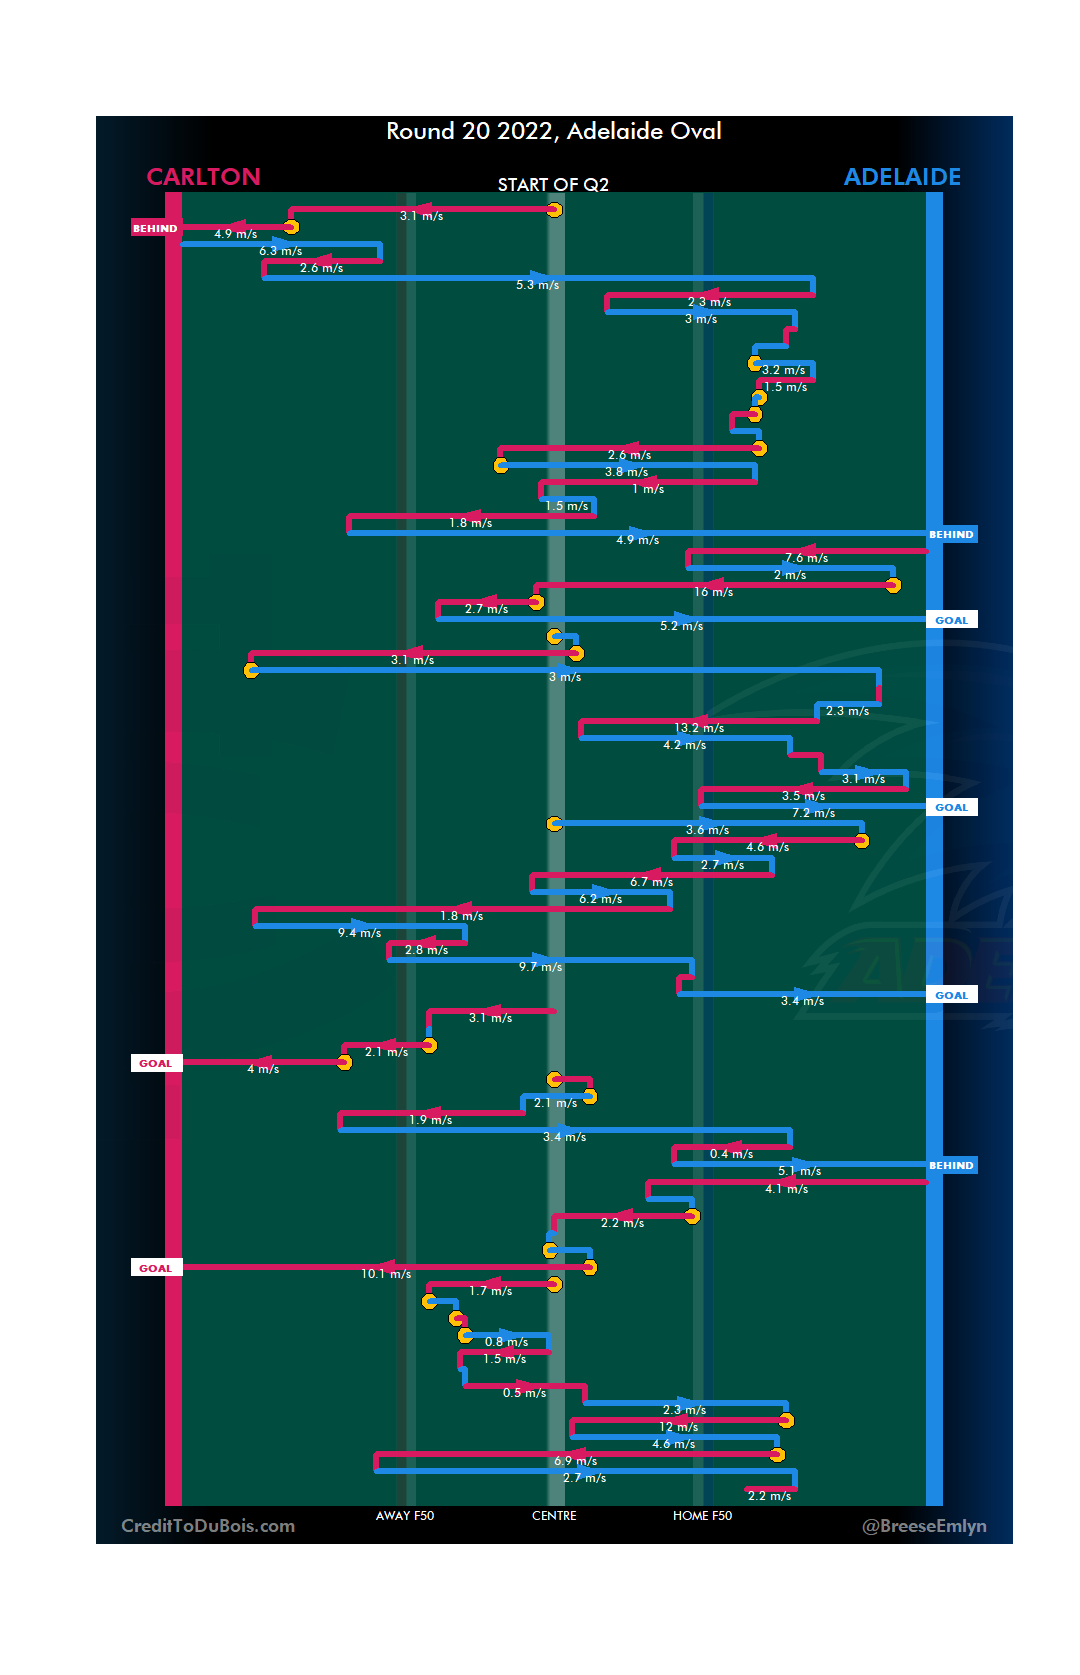
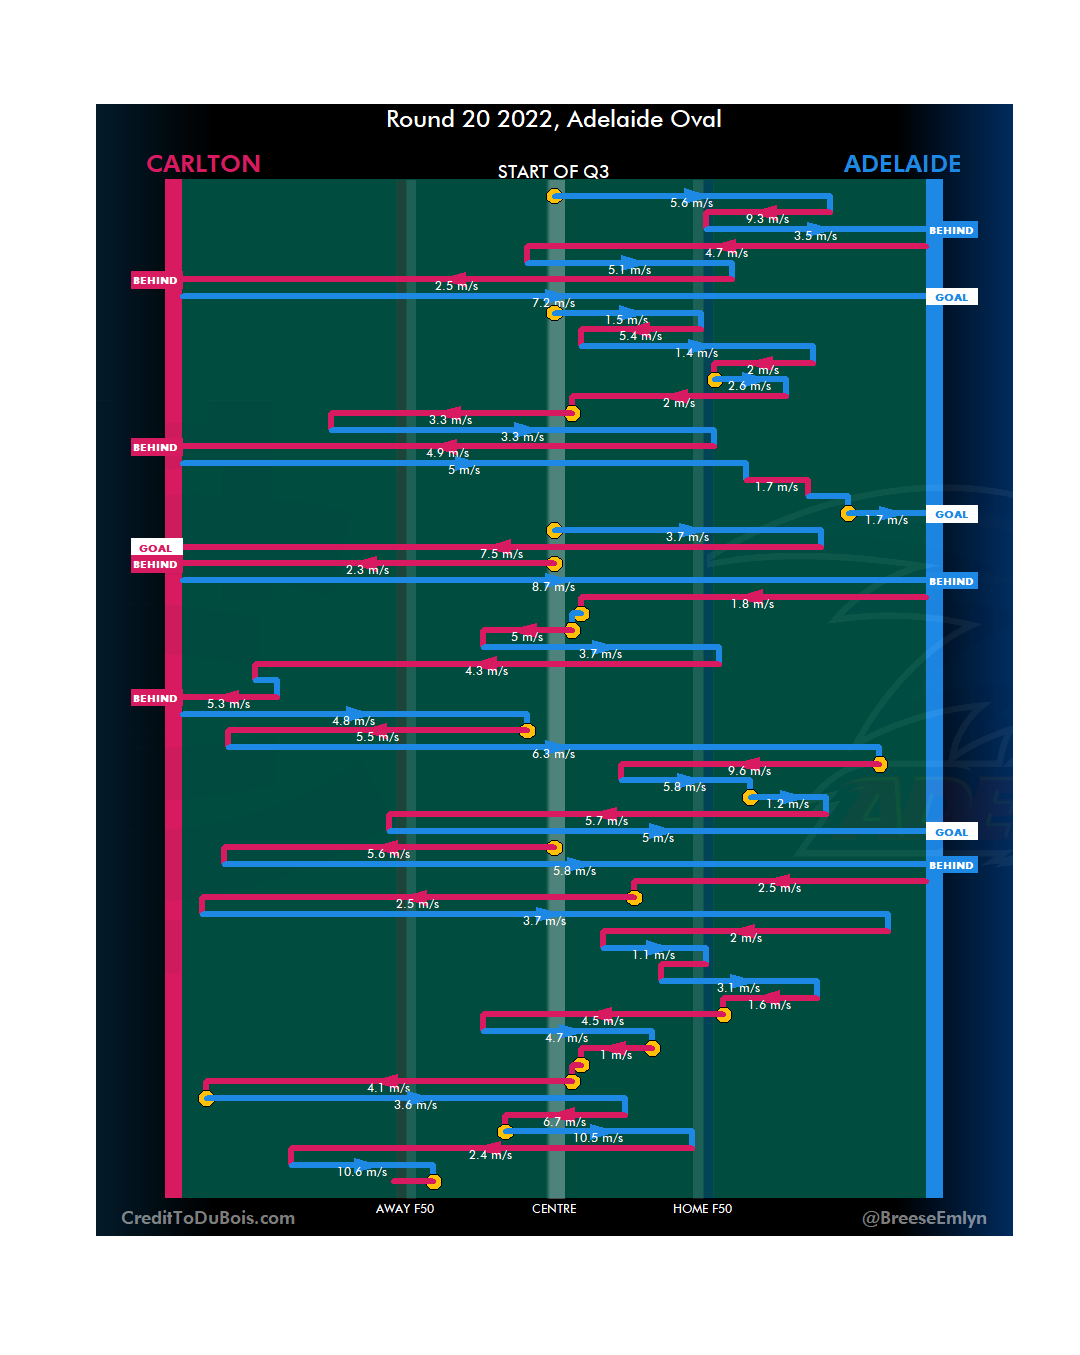
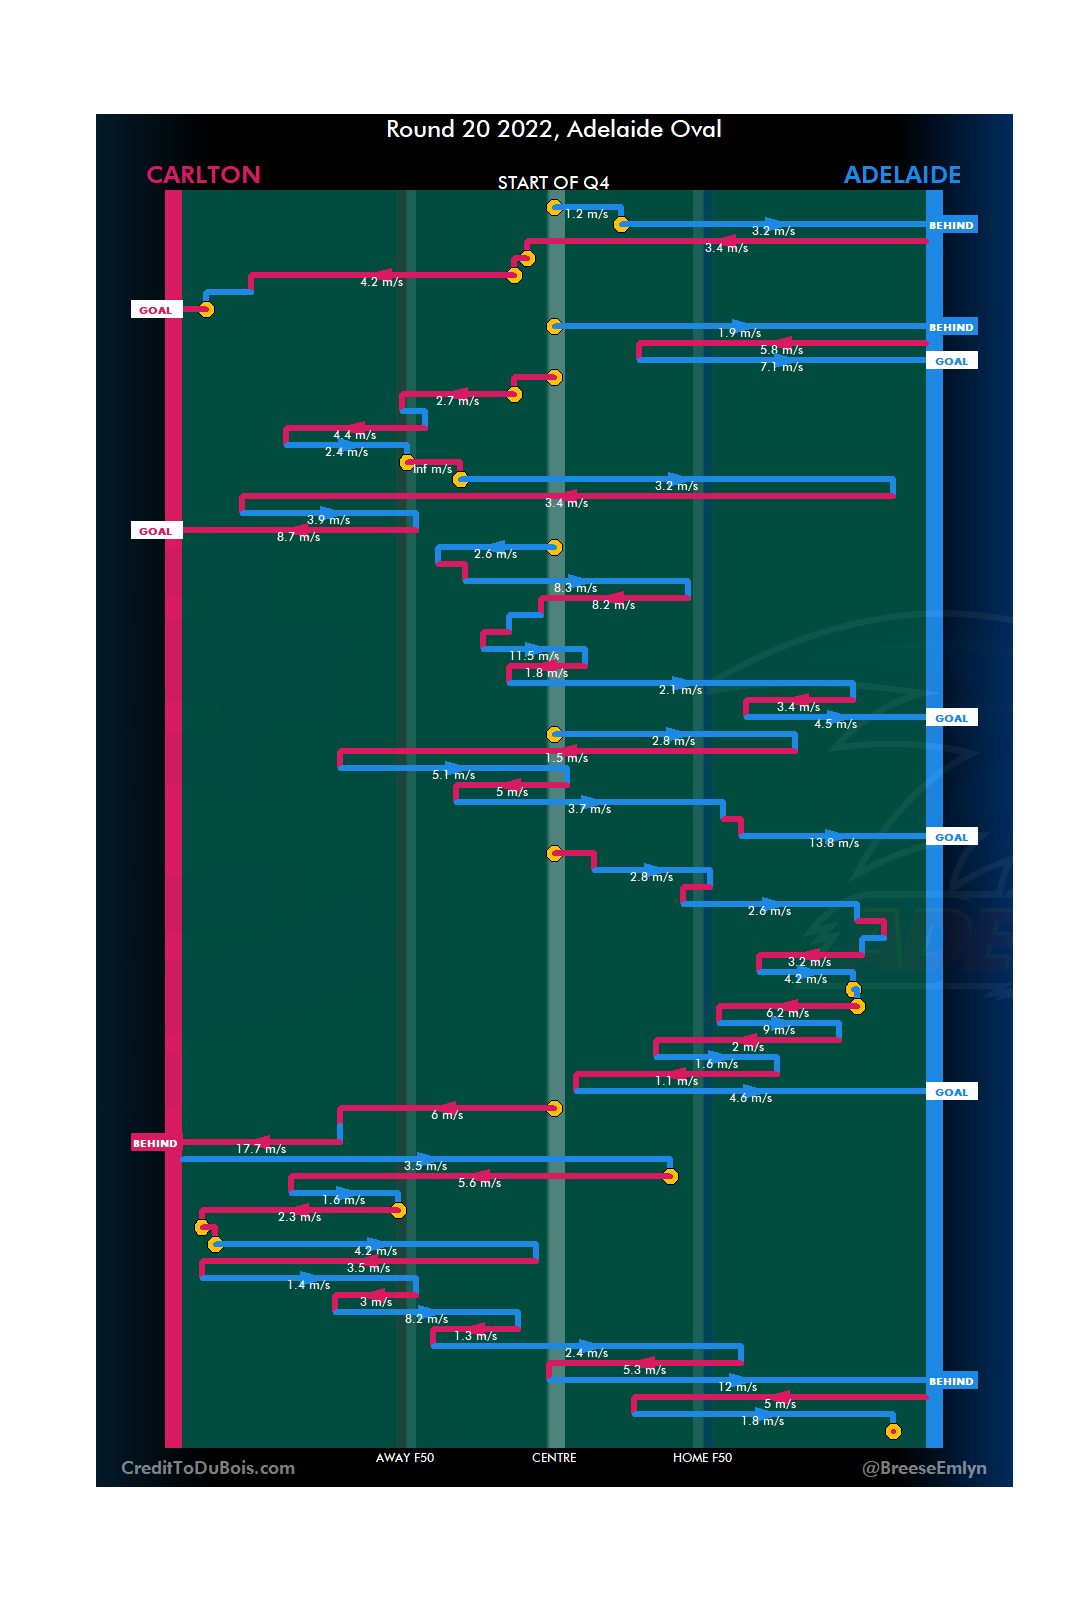
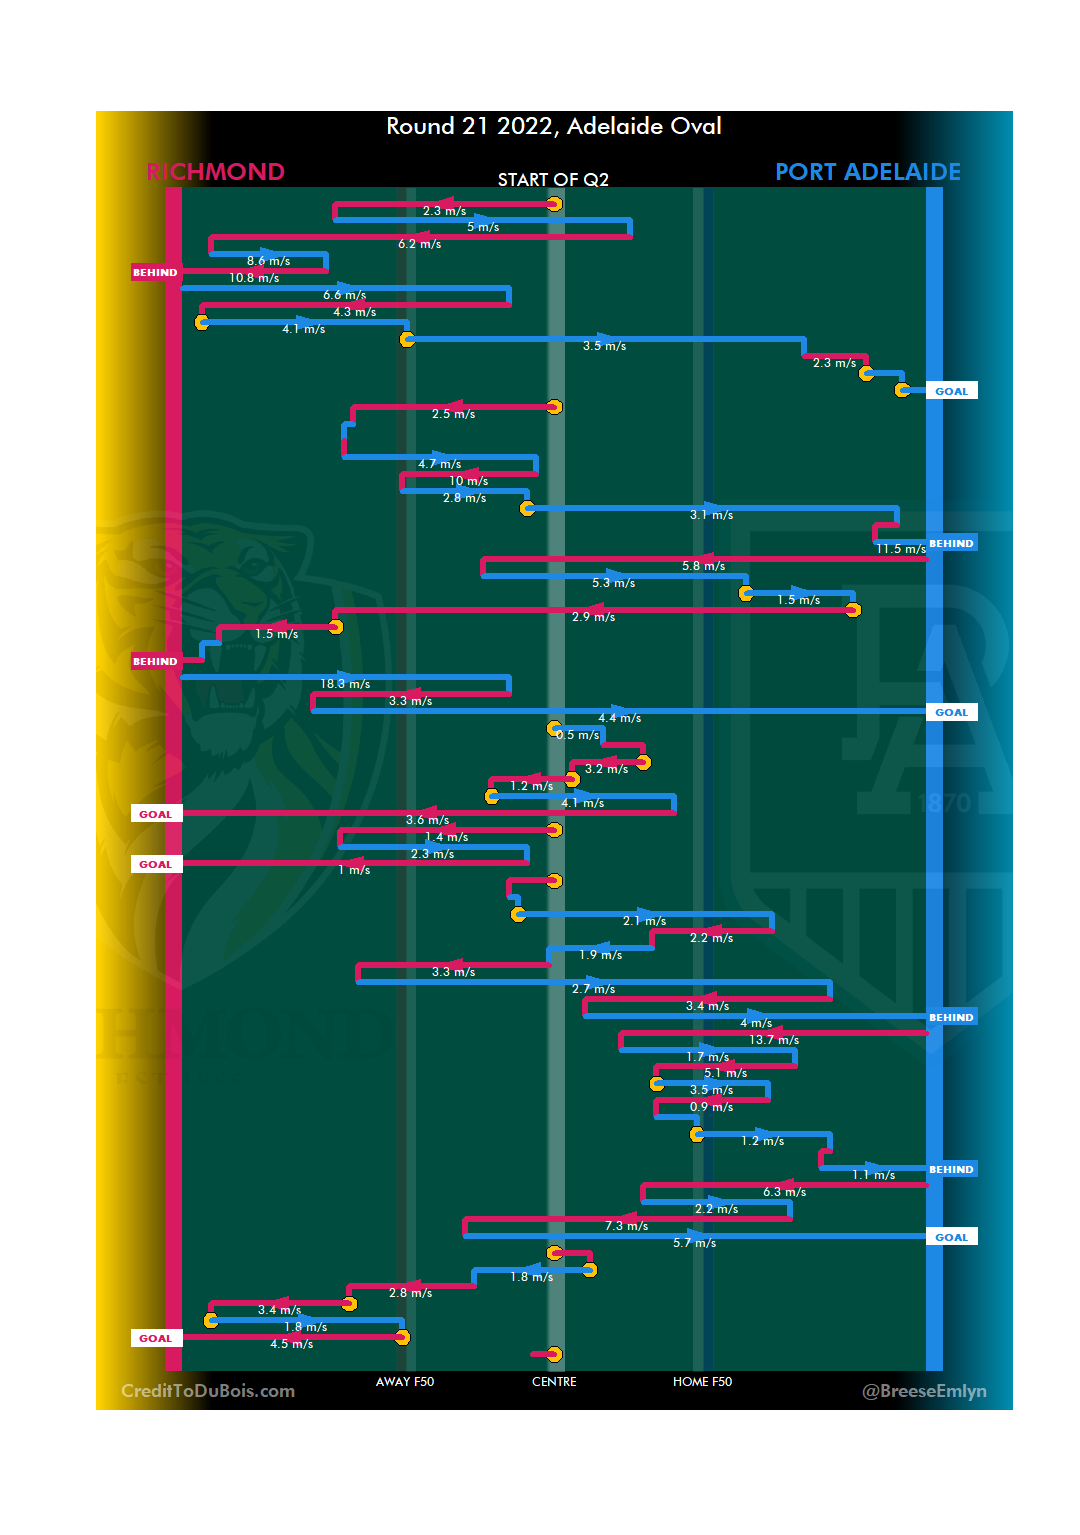
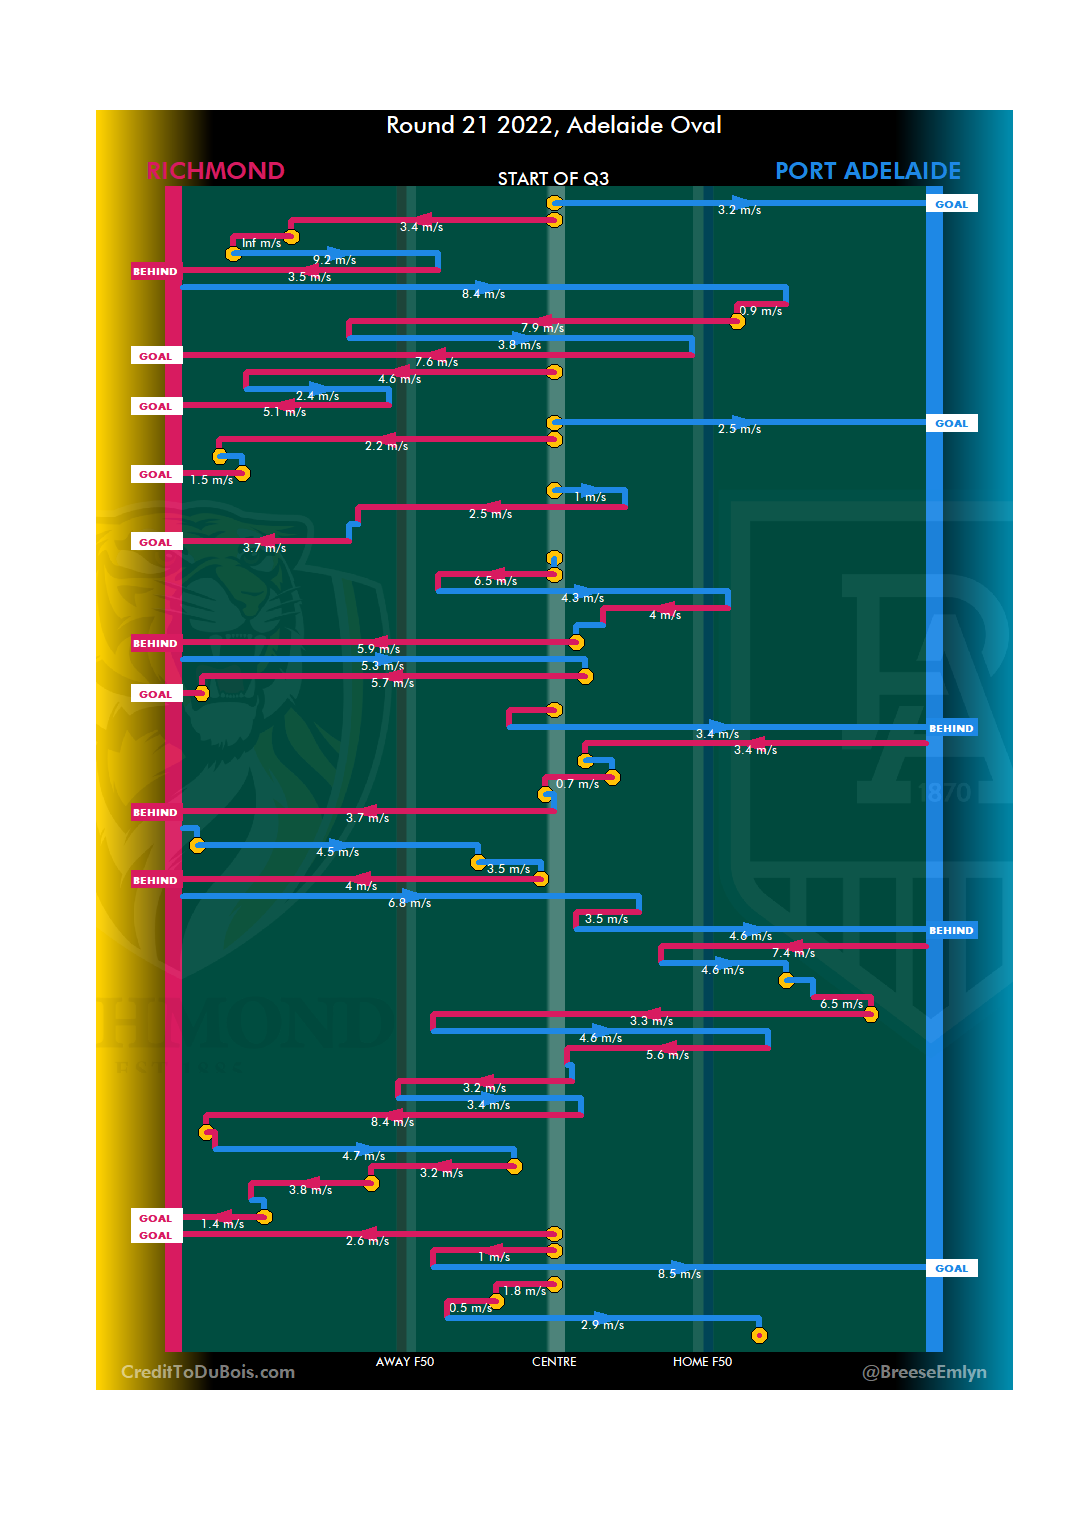
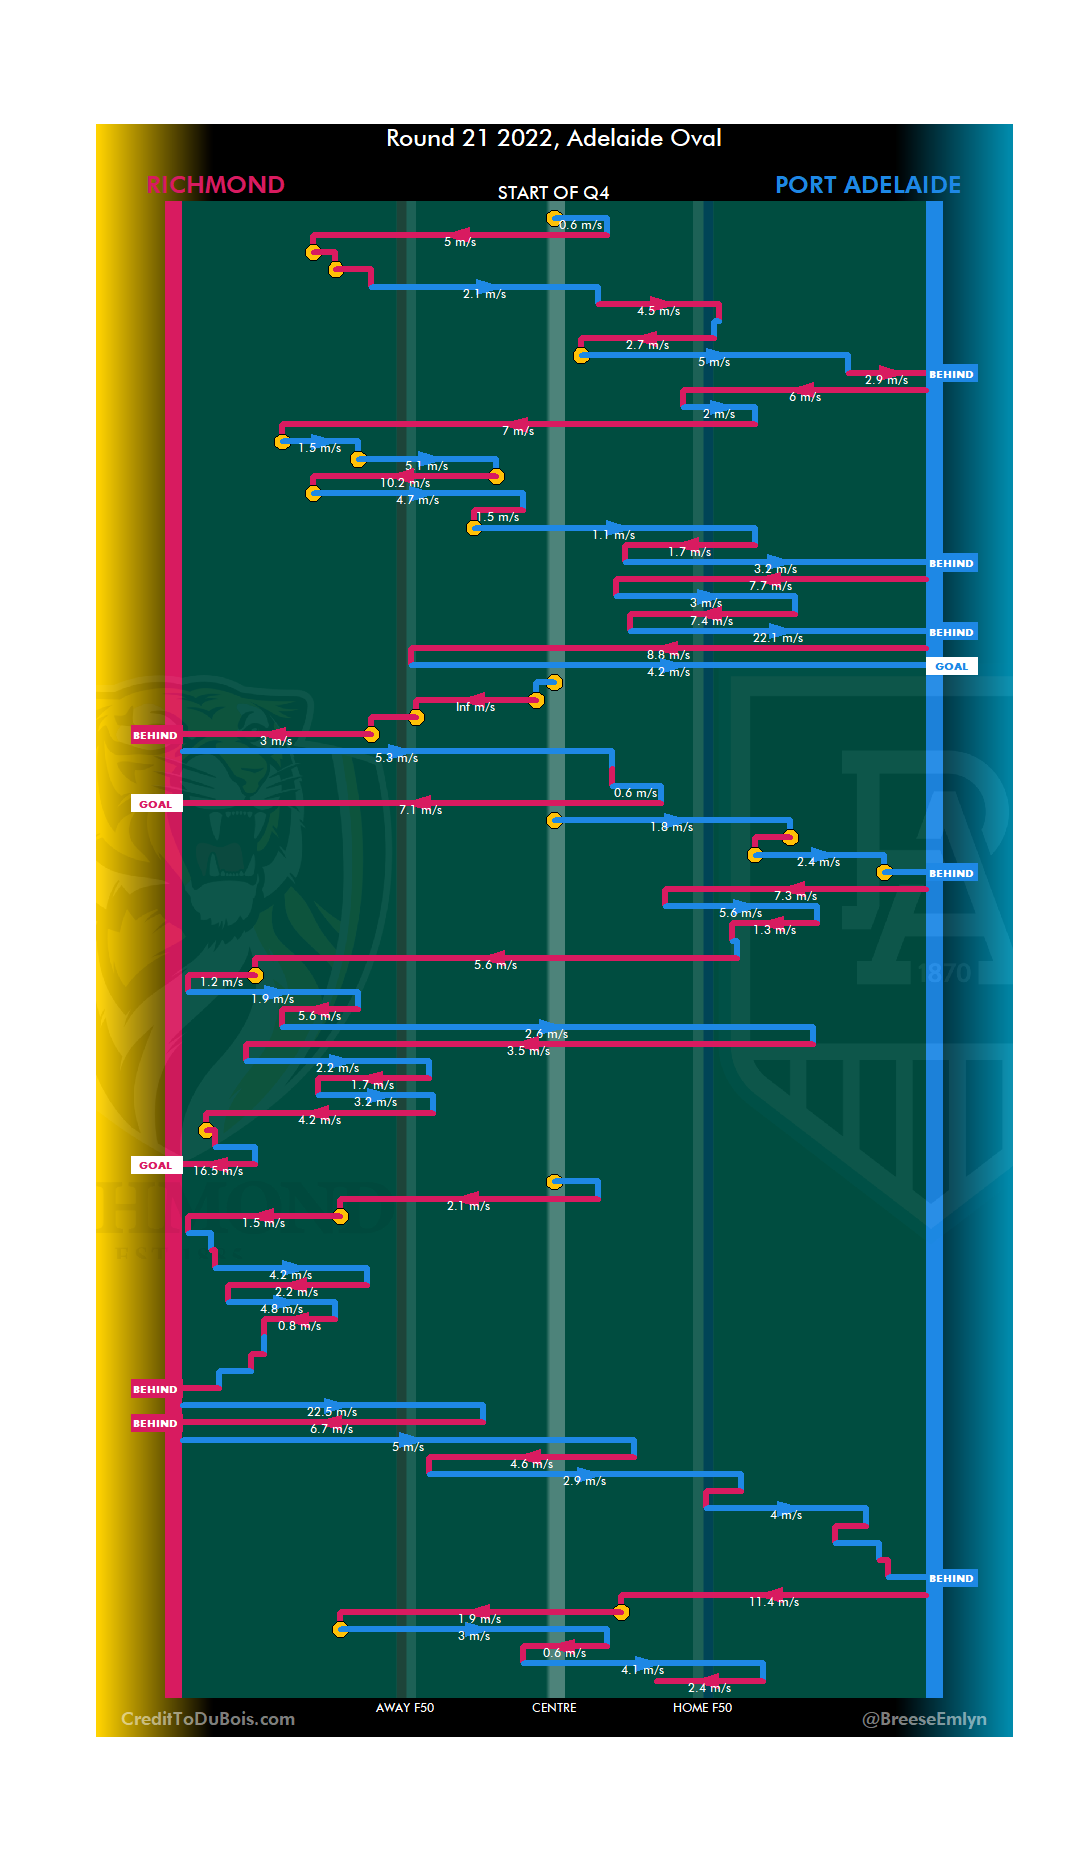
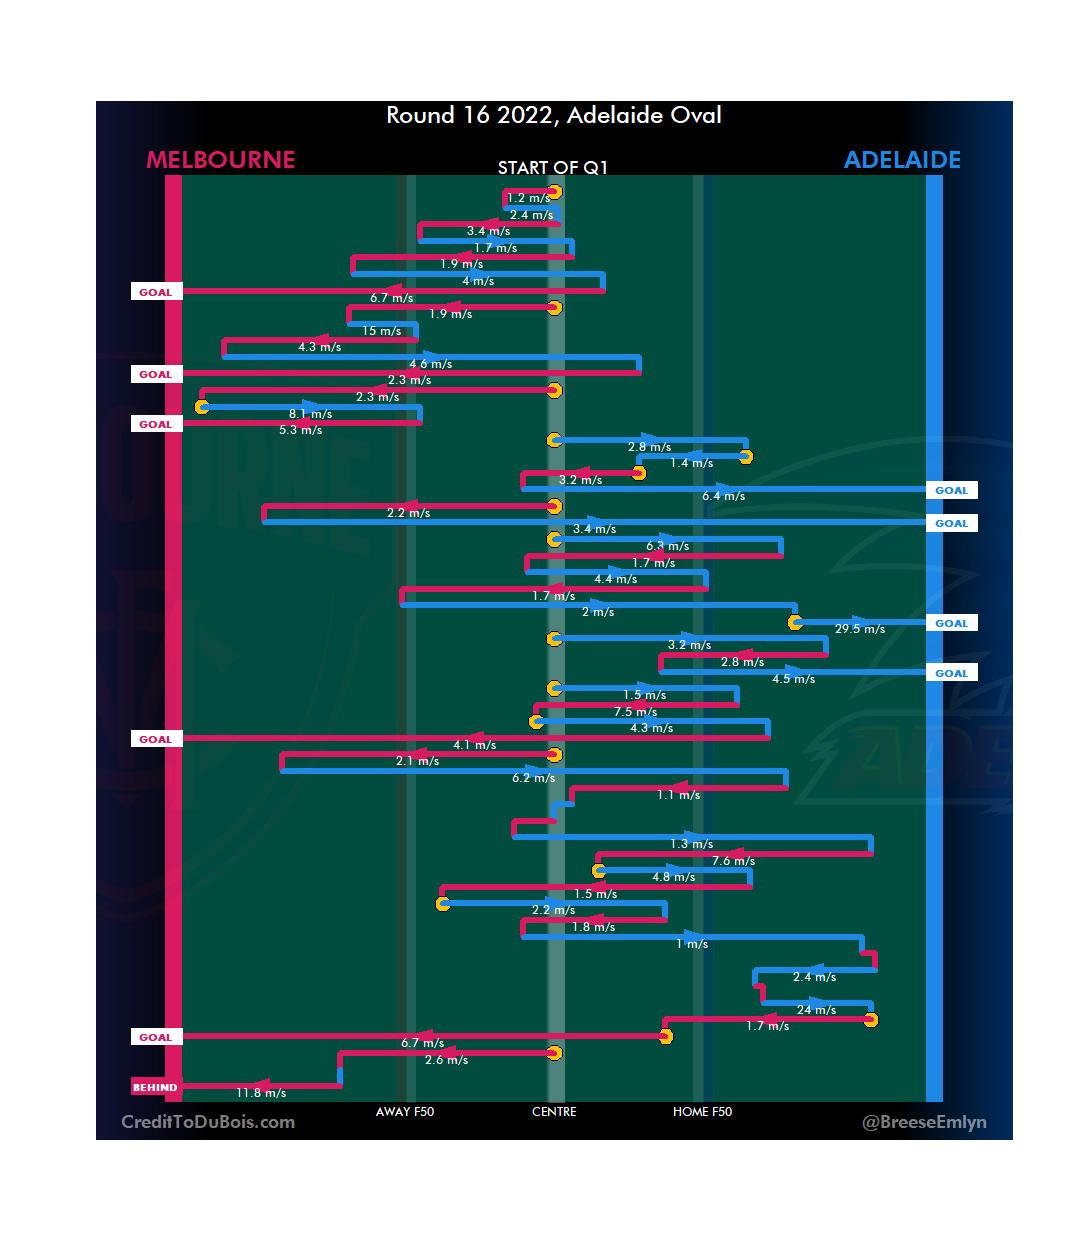
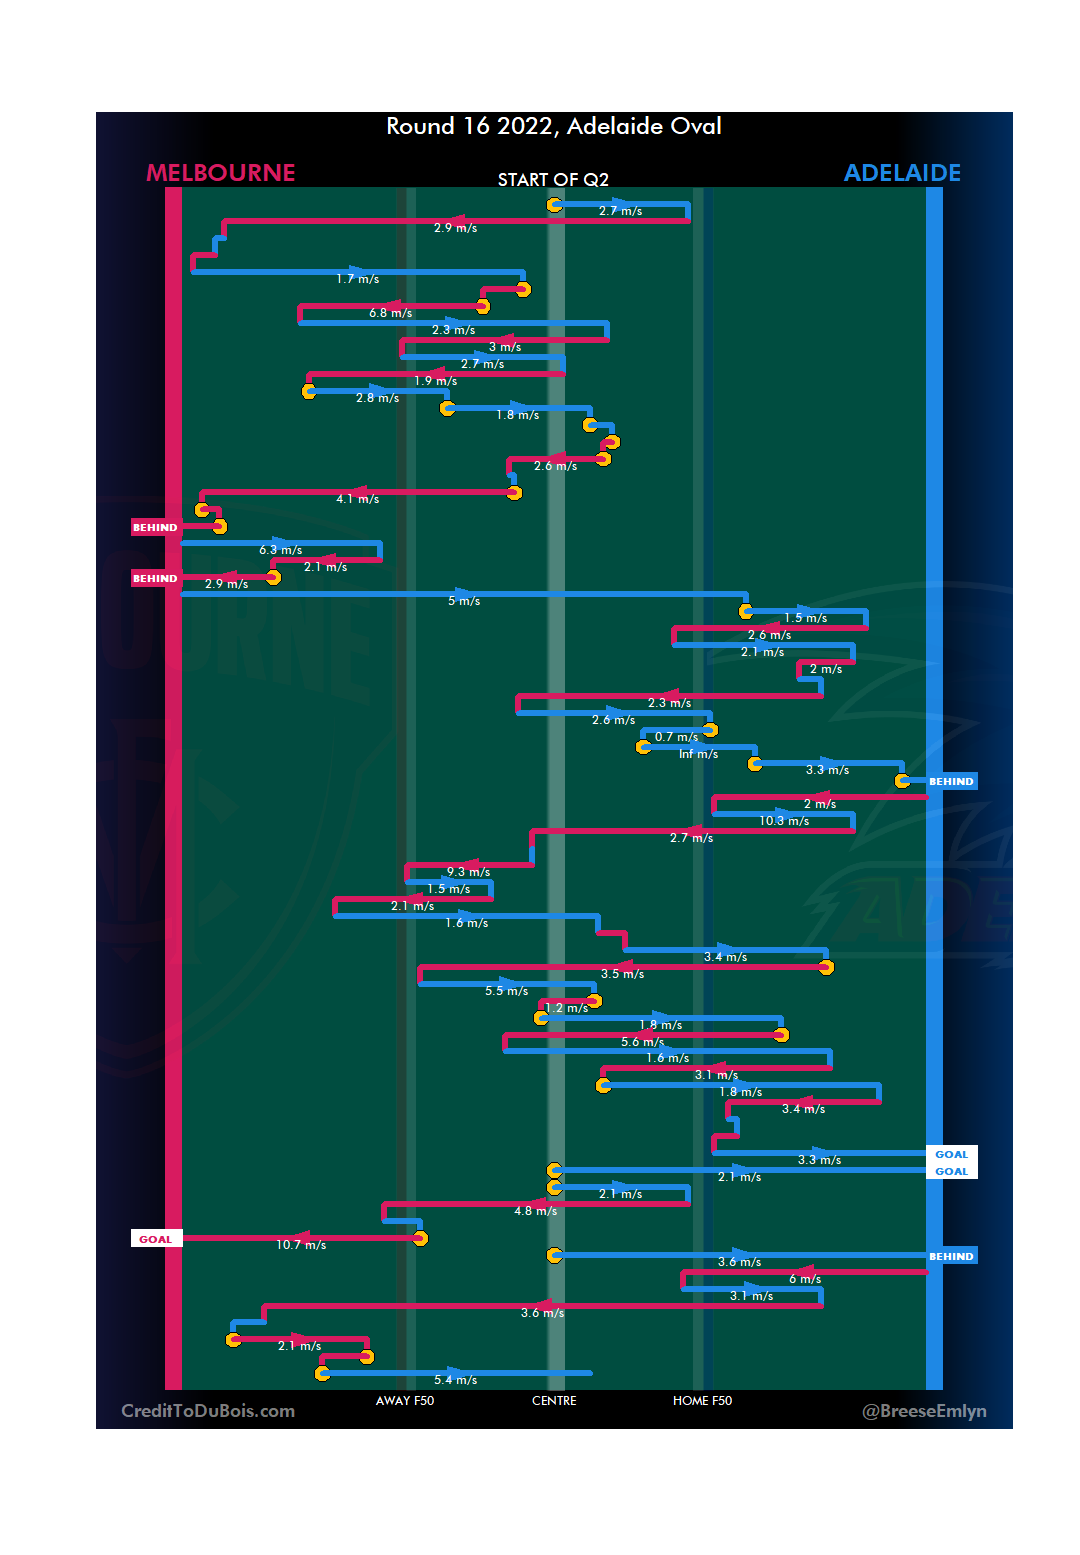
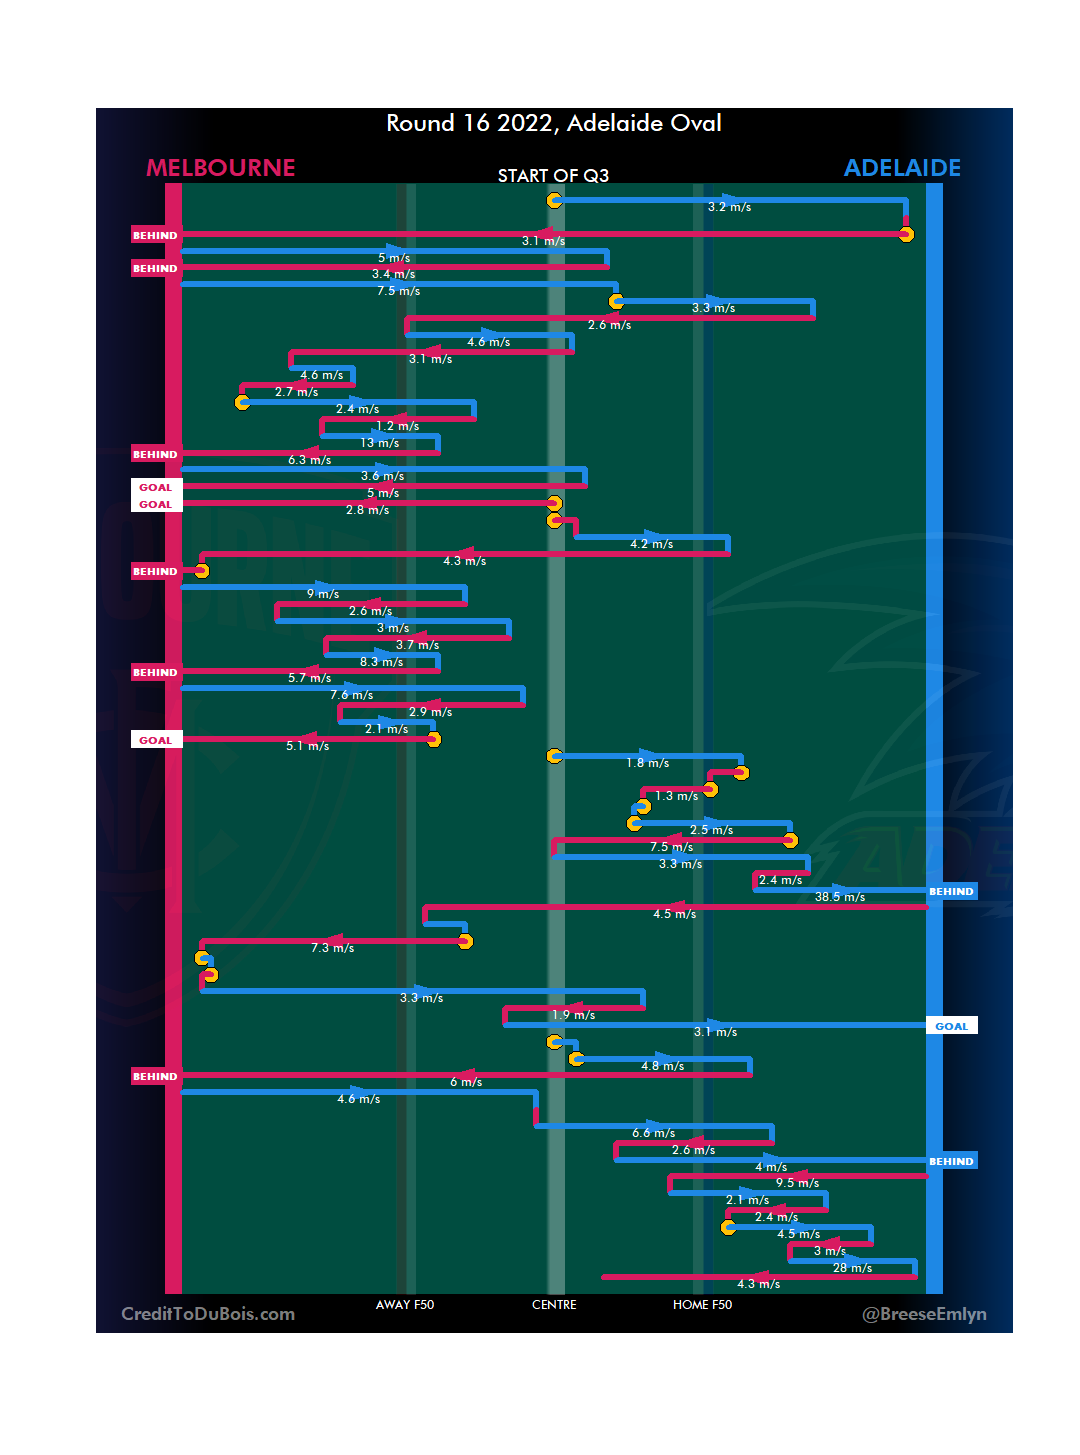
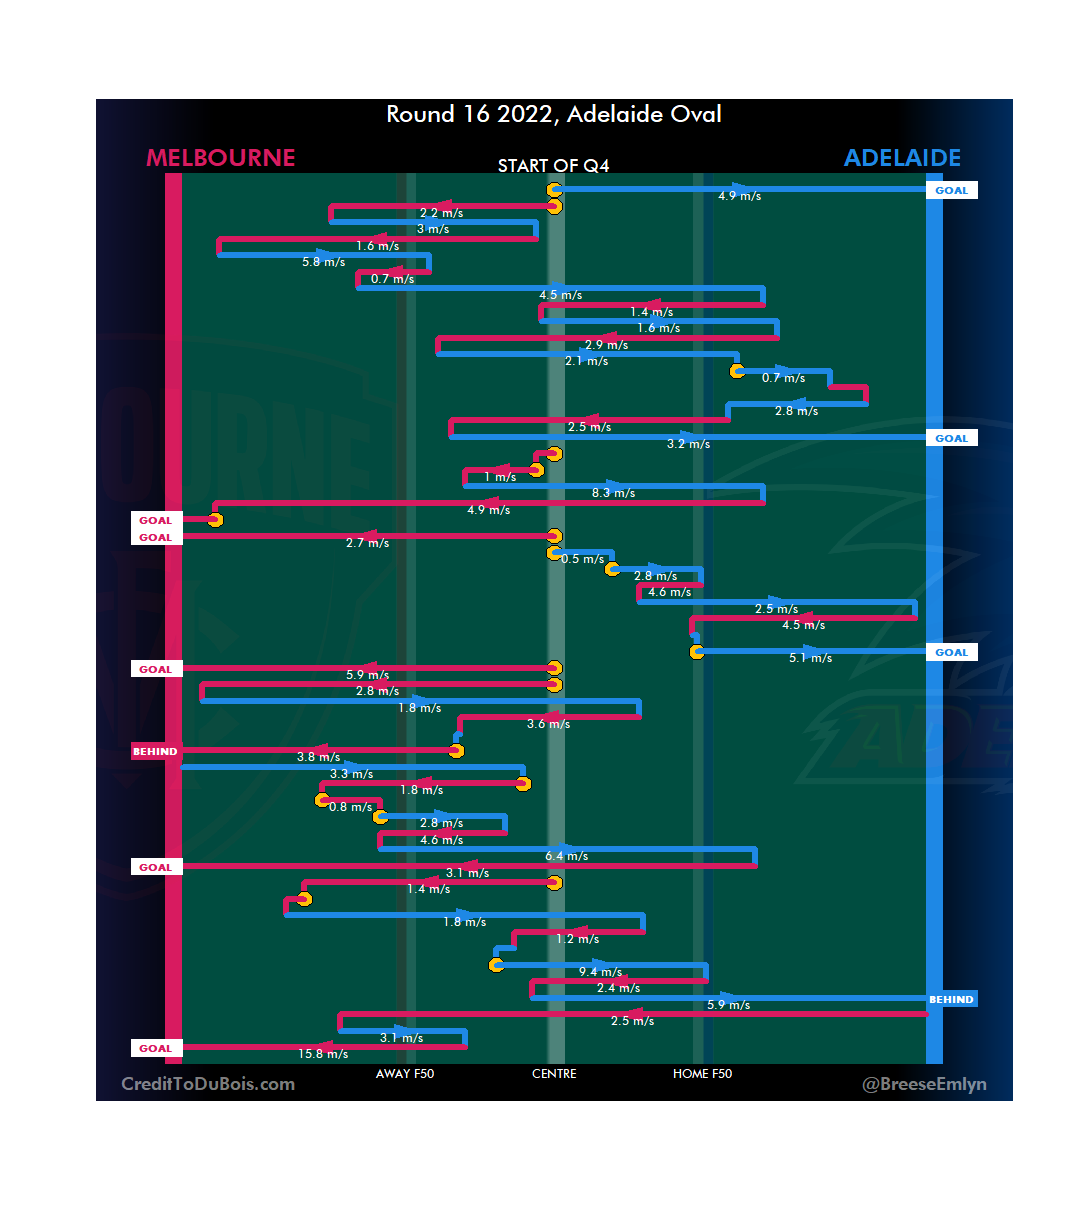
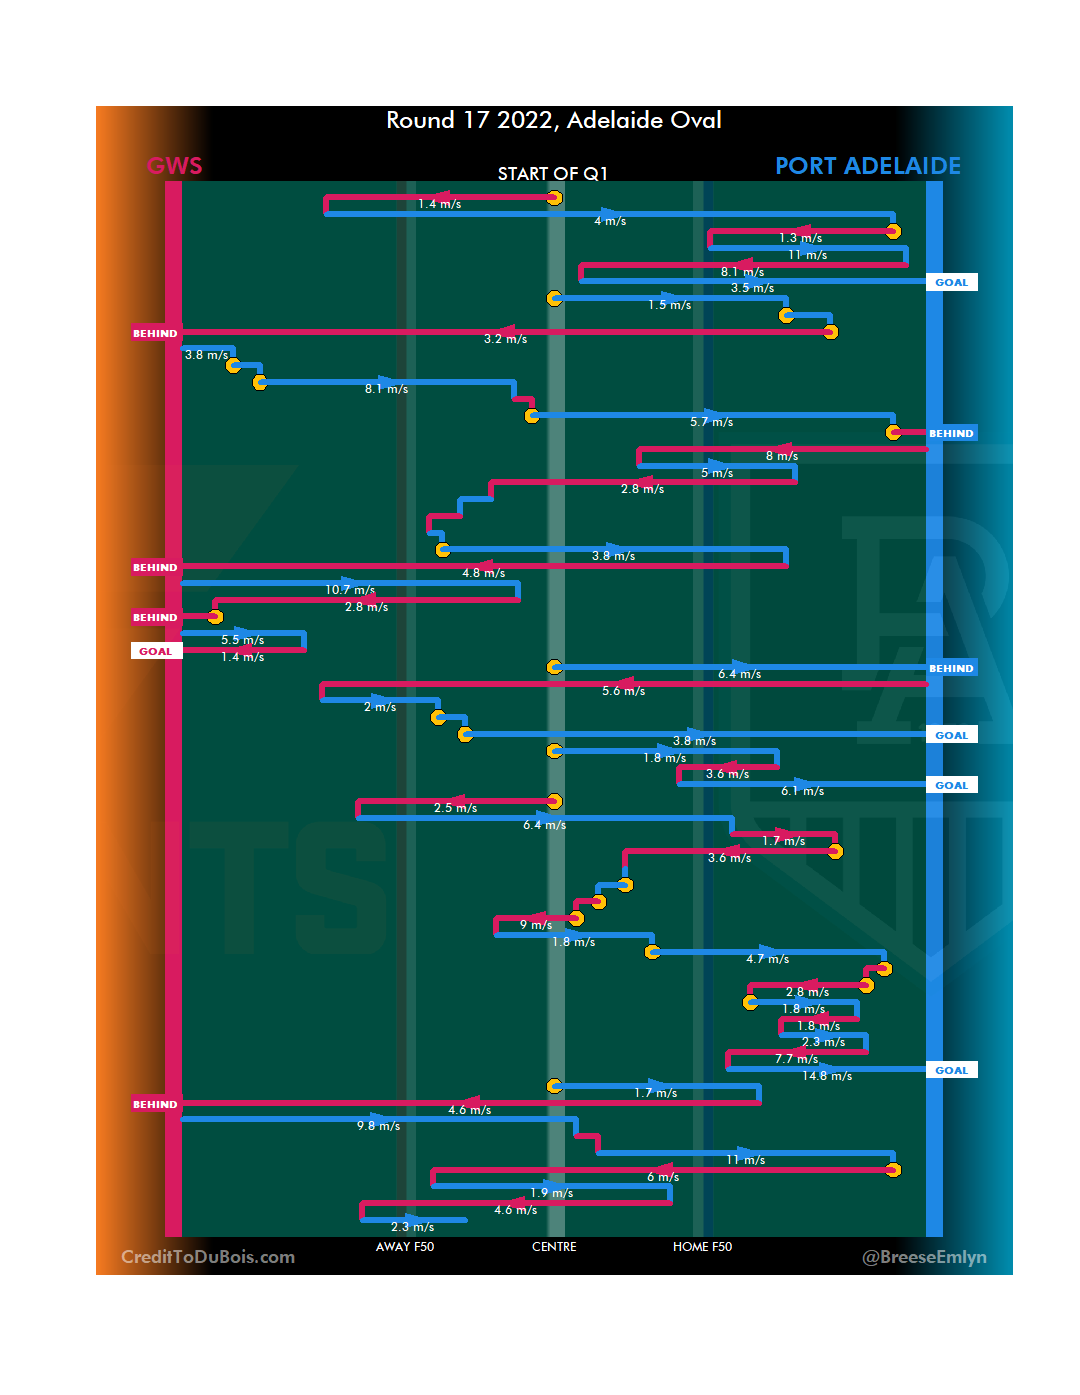
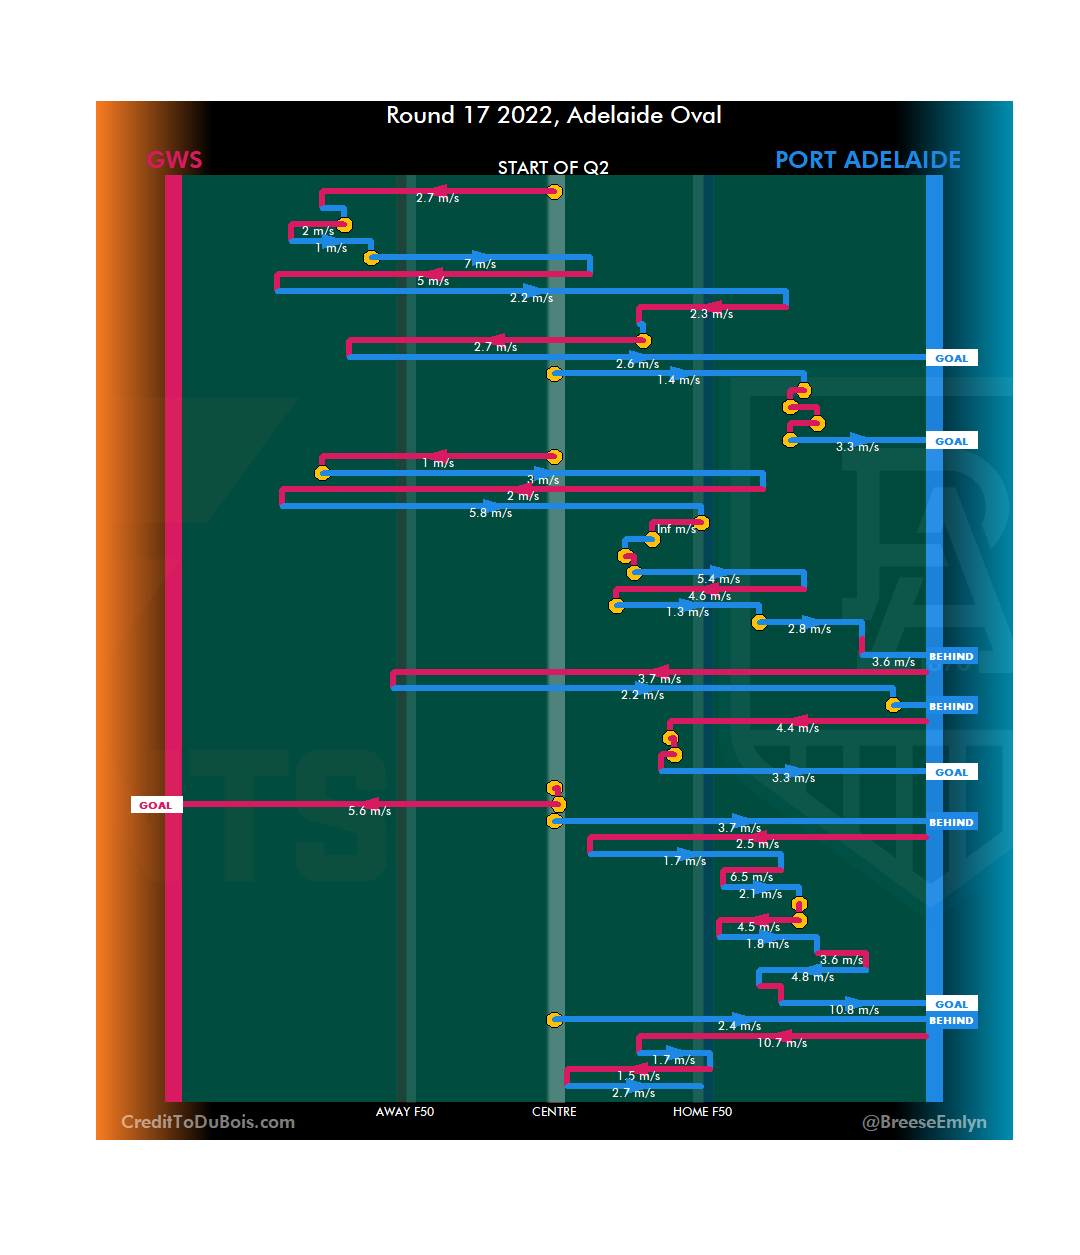
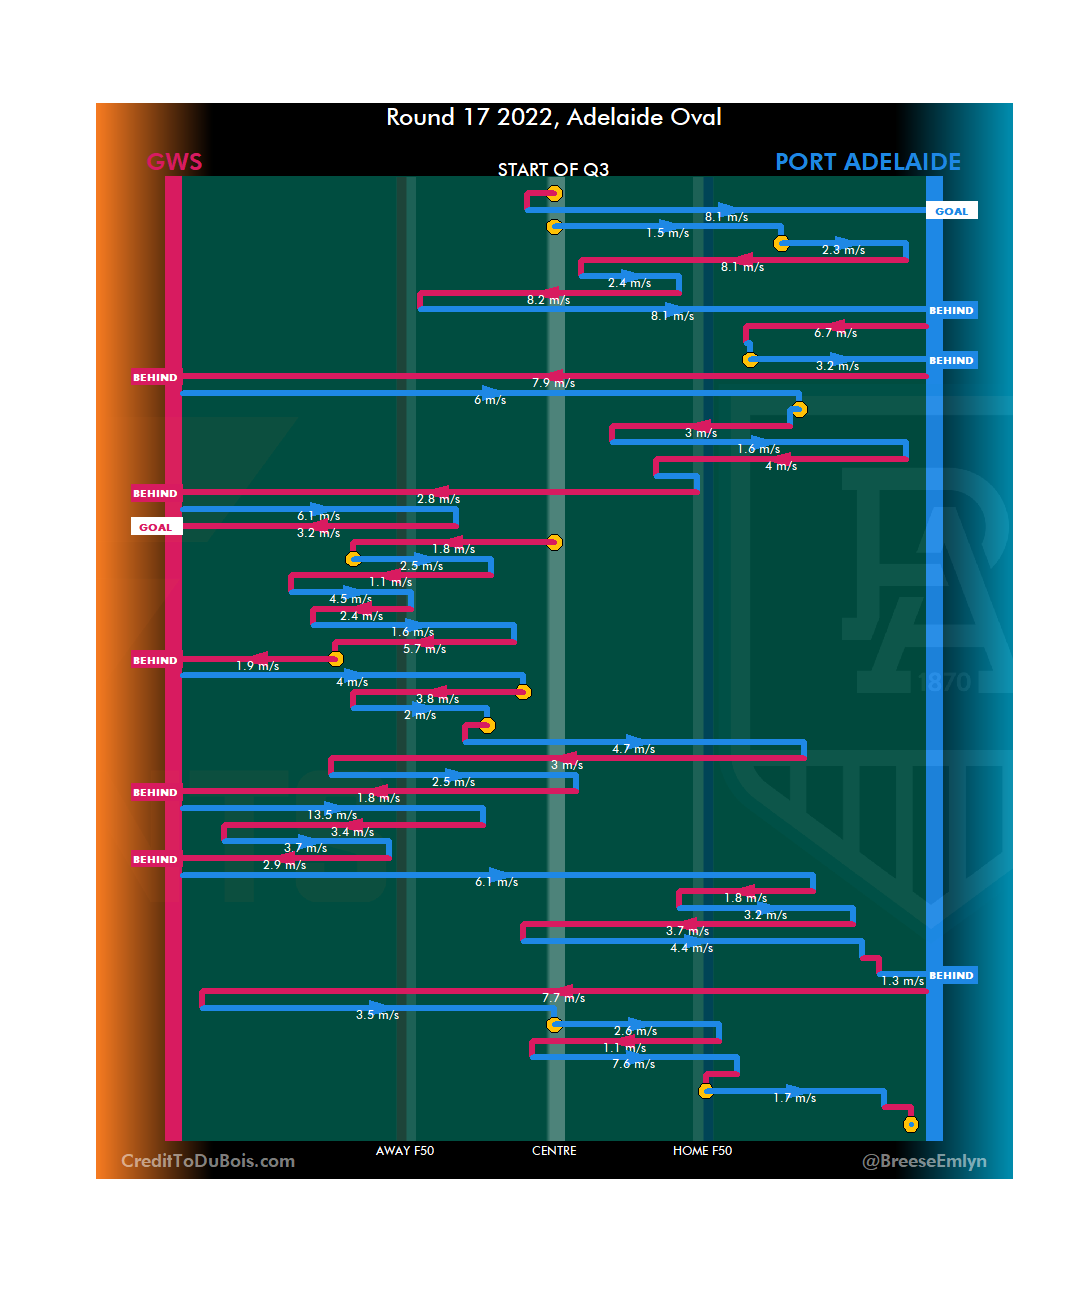
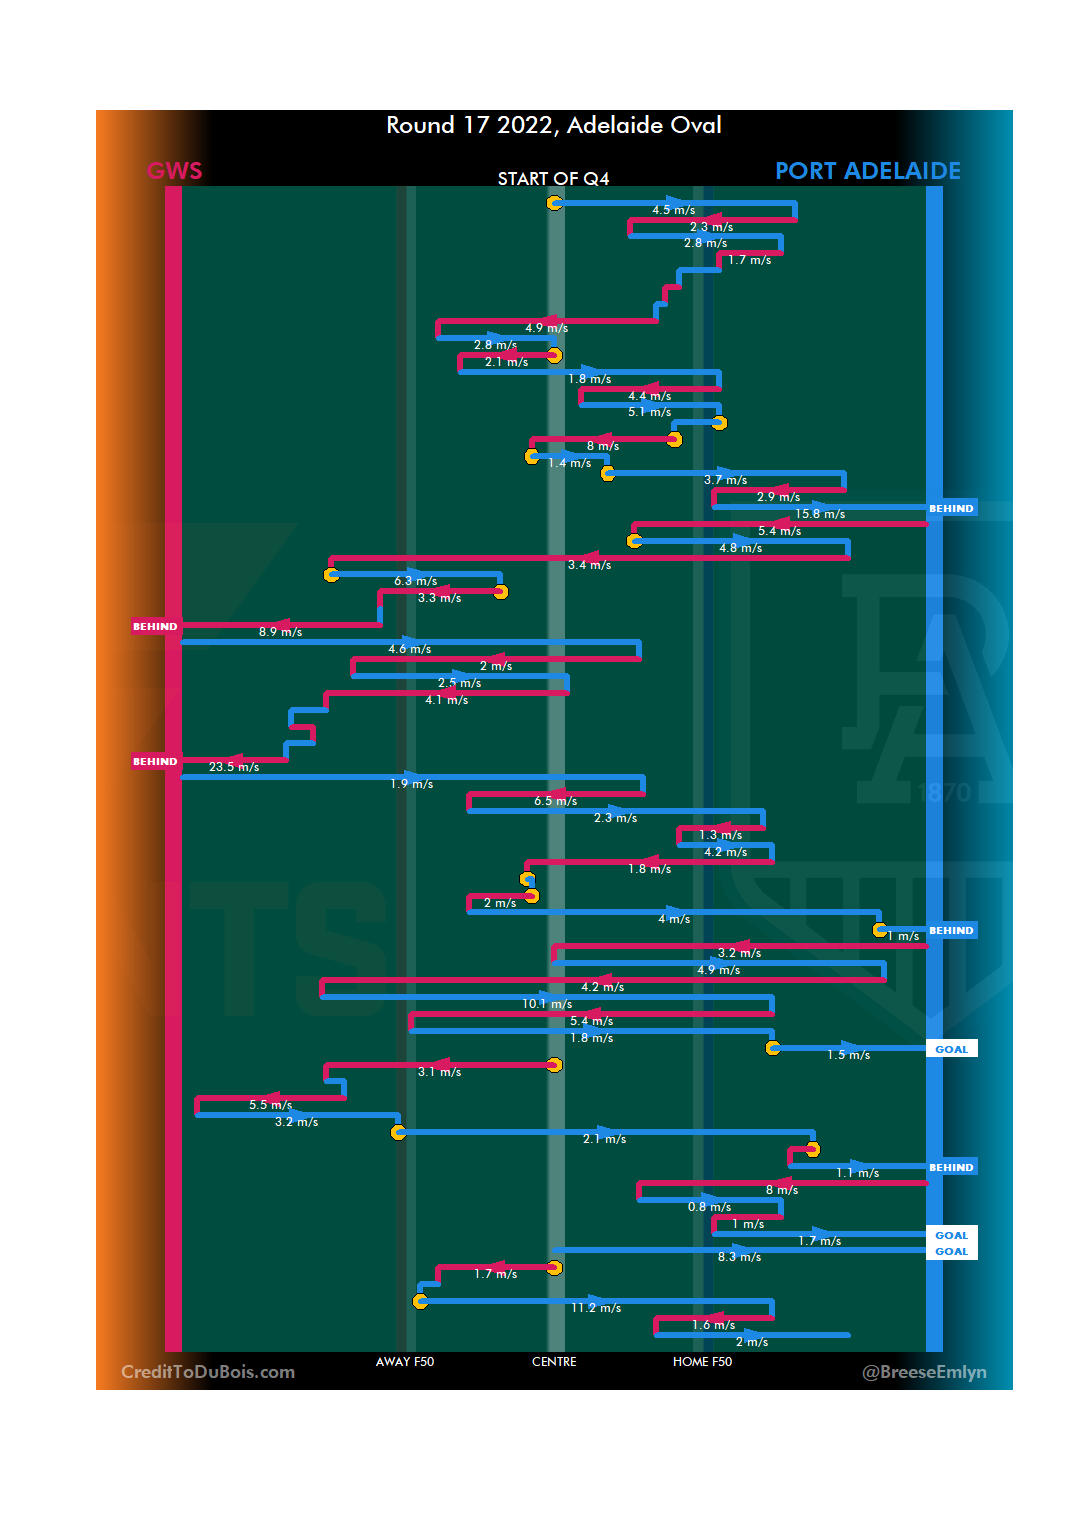
A quick one from me this week while I’m on holiday (got to see my first game at Adelaide Oval, great stadium!).
This came to my attention from a comment on r/AFL – the idea of a double comeback. Team A gains a significant lead, Team B reverses that into a significant lead of their own, but Team A comes back again and wins the match.
Originally a thirty point margin was floated as the threshold. However, since 2001 (the start of score-by-score progression on AFLTables) there have been 29 games in which both teams have held a lead of 30+ points at some point.
But in none of those did the team who surrendered the initial lead secure the win (including the Essendon v Carlton draw in Round 23 2014.)
If we drop our threshold down to 24+ points we get 5 examples of the double comeback, any of which are well worth a revisit (unless you were on the wrong end and the wounds are still too deep) and some are genuinely classics:
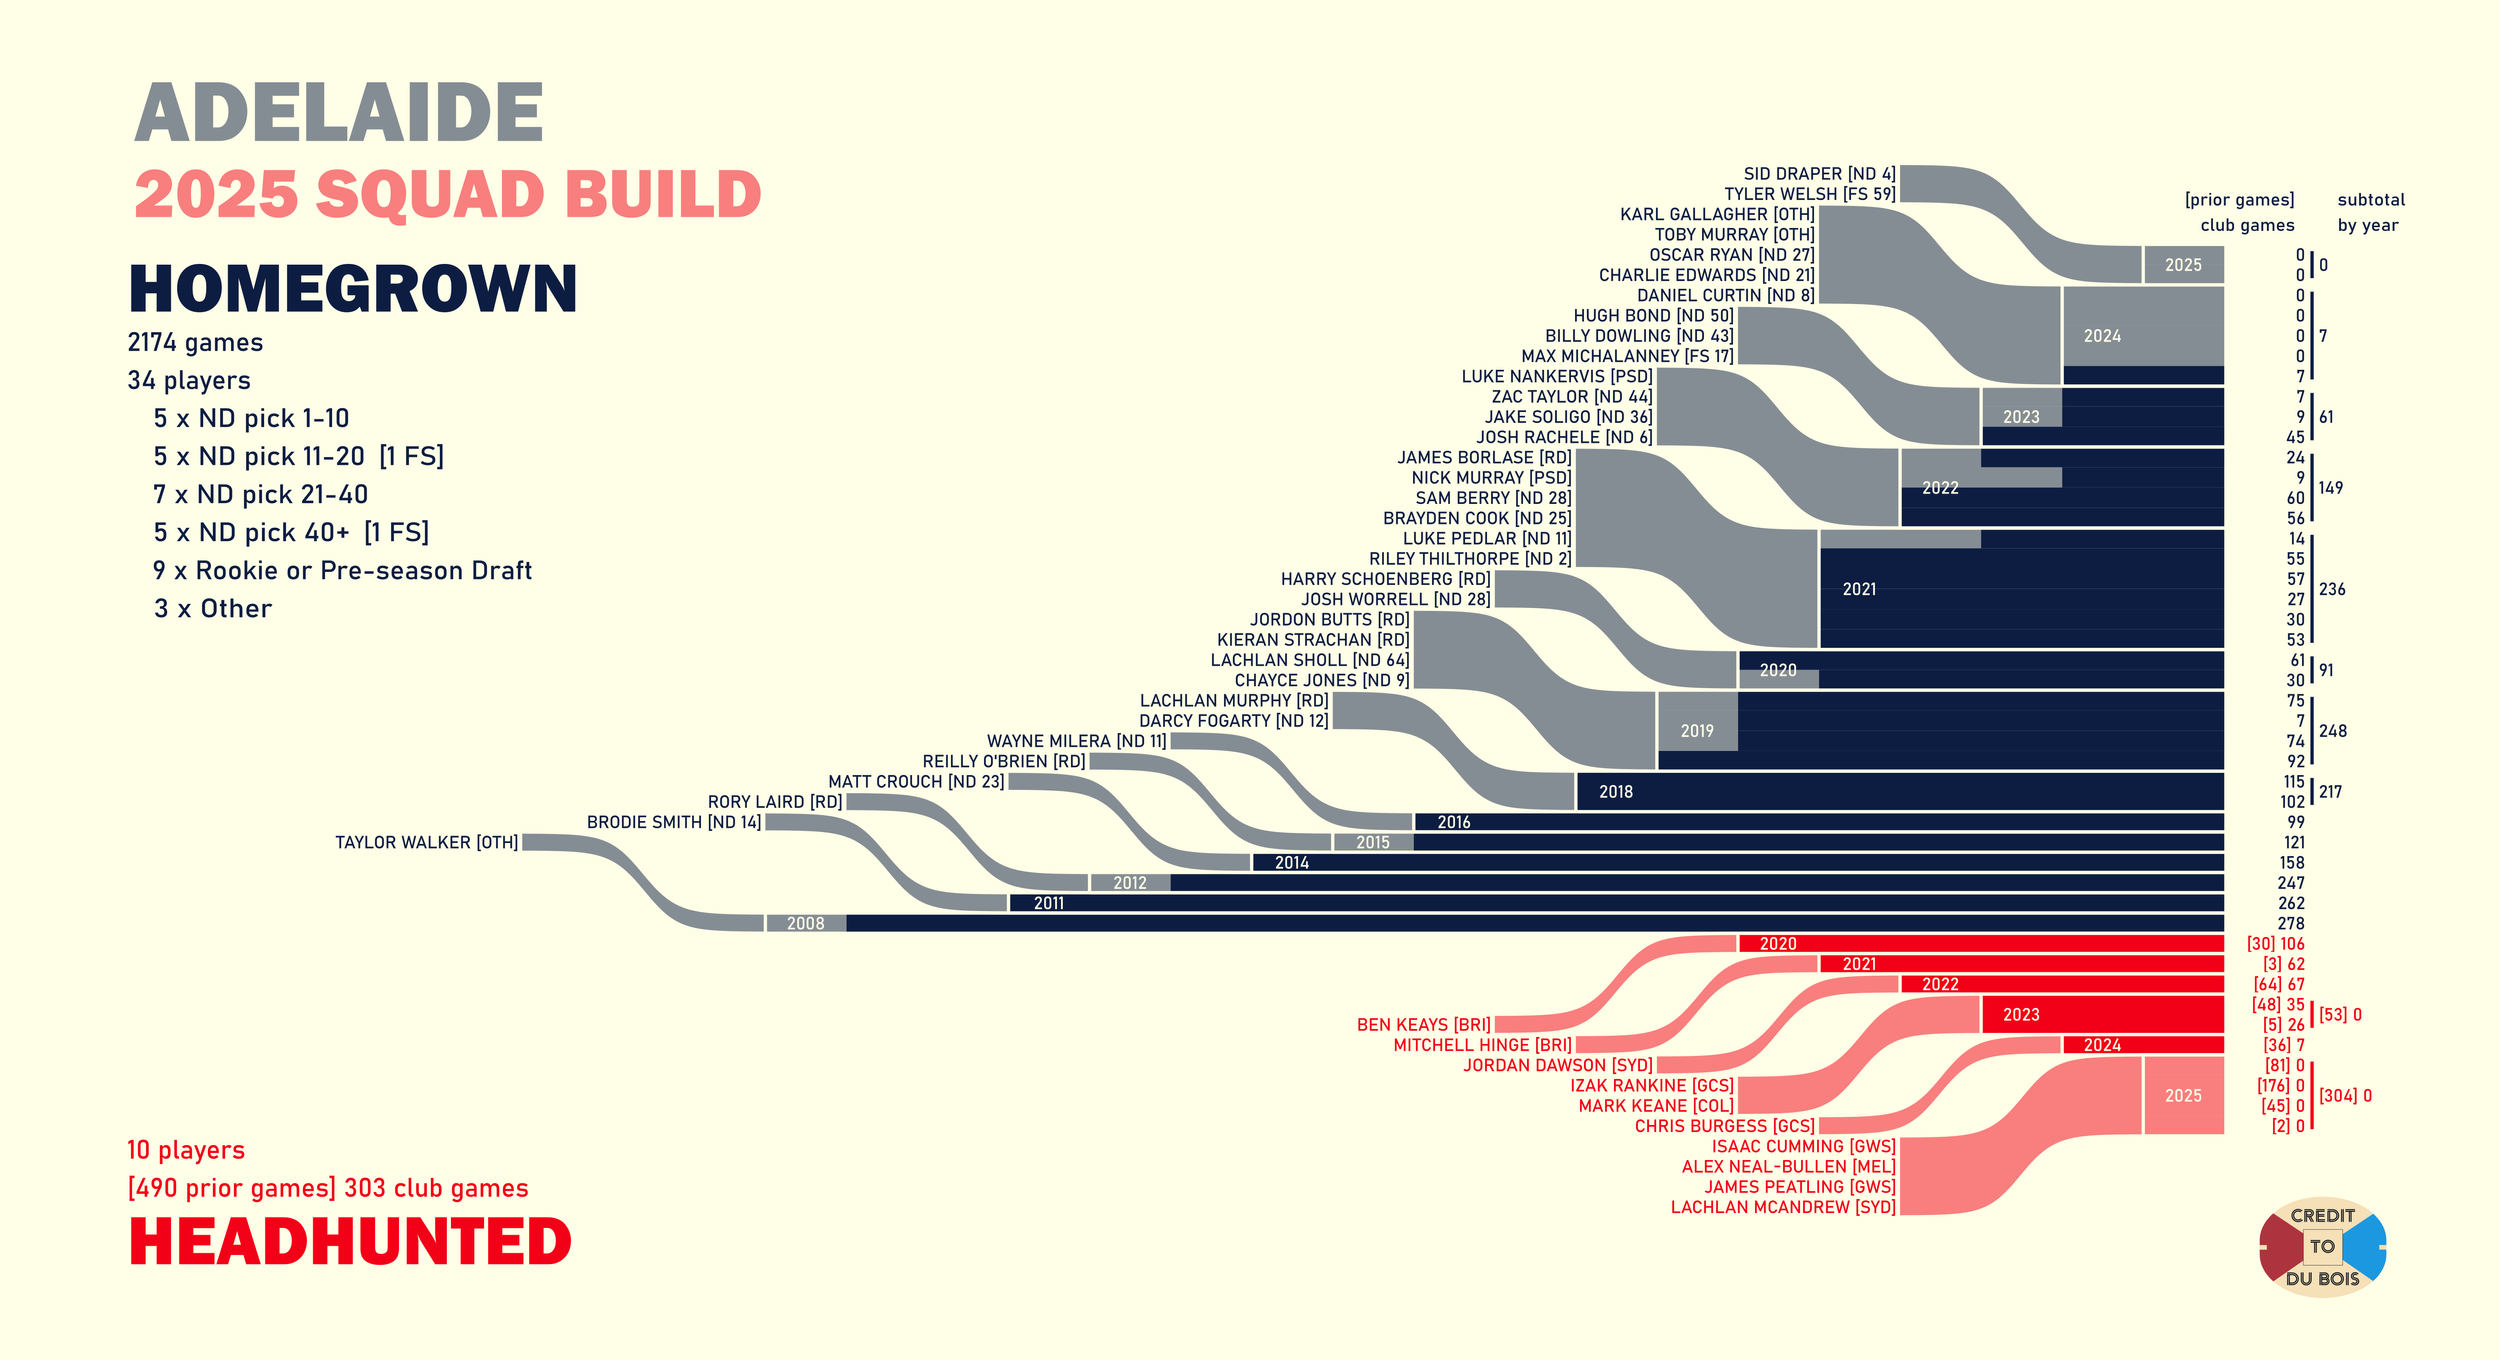
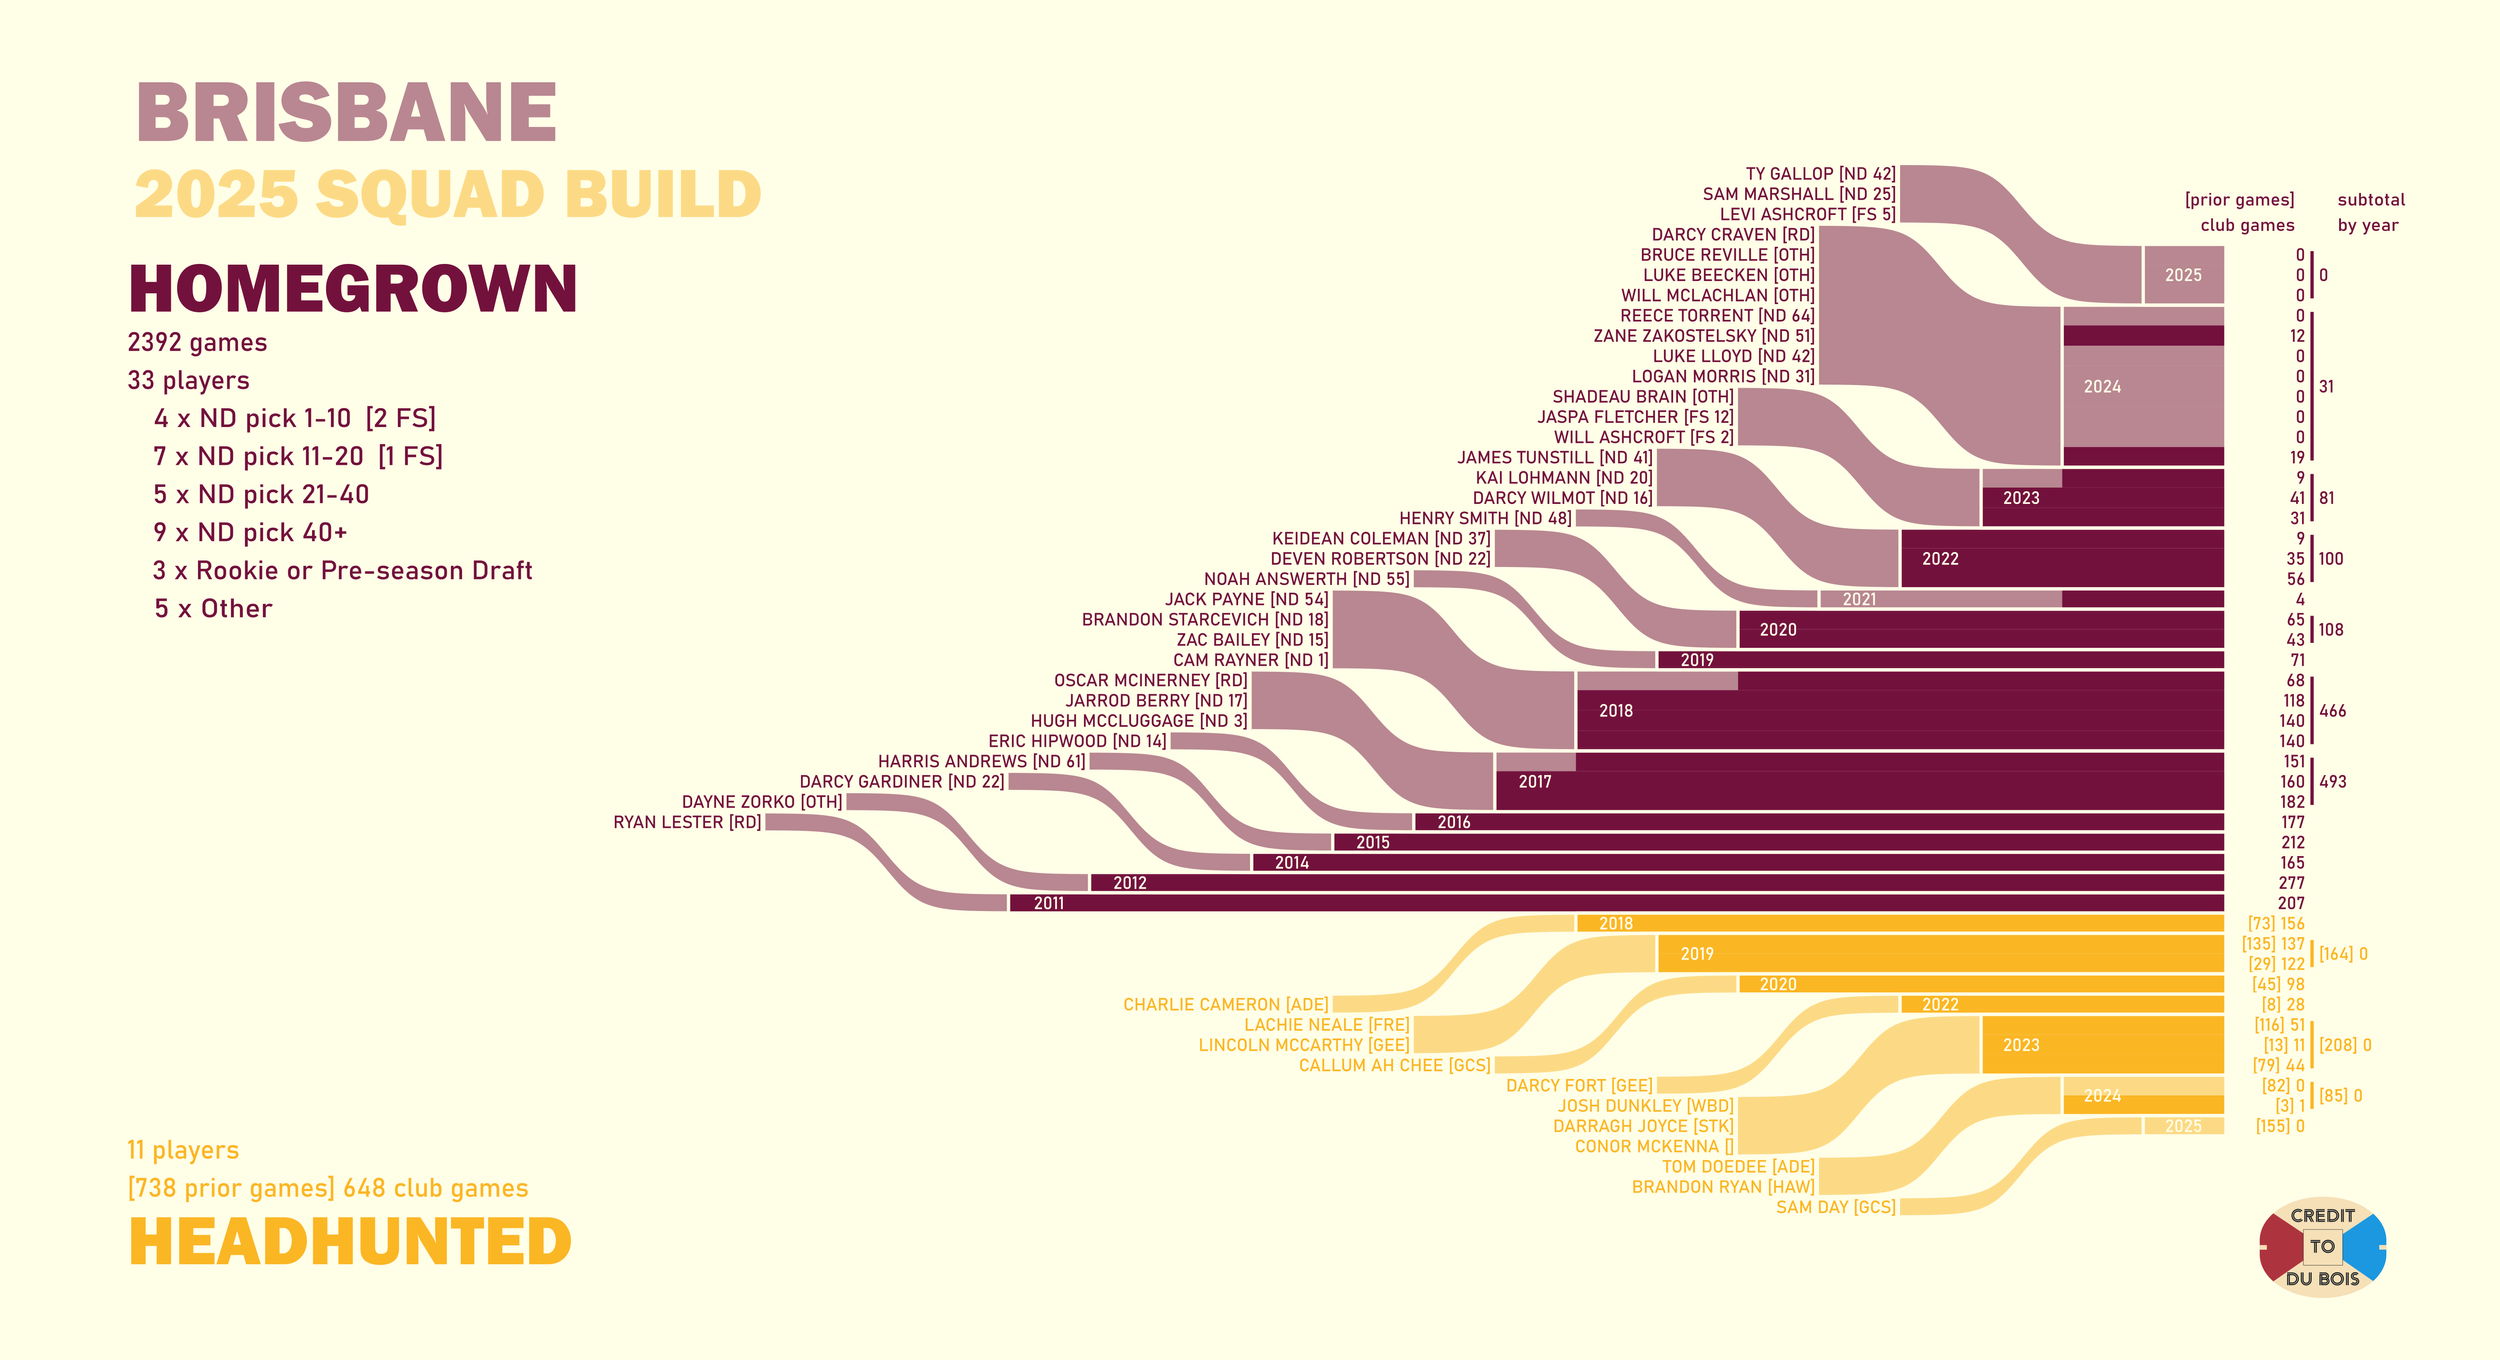
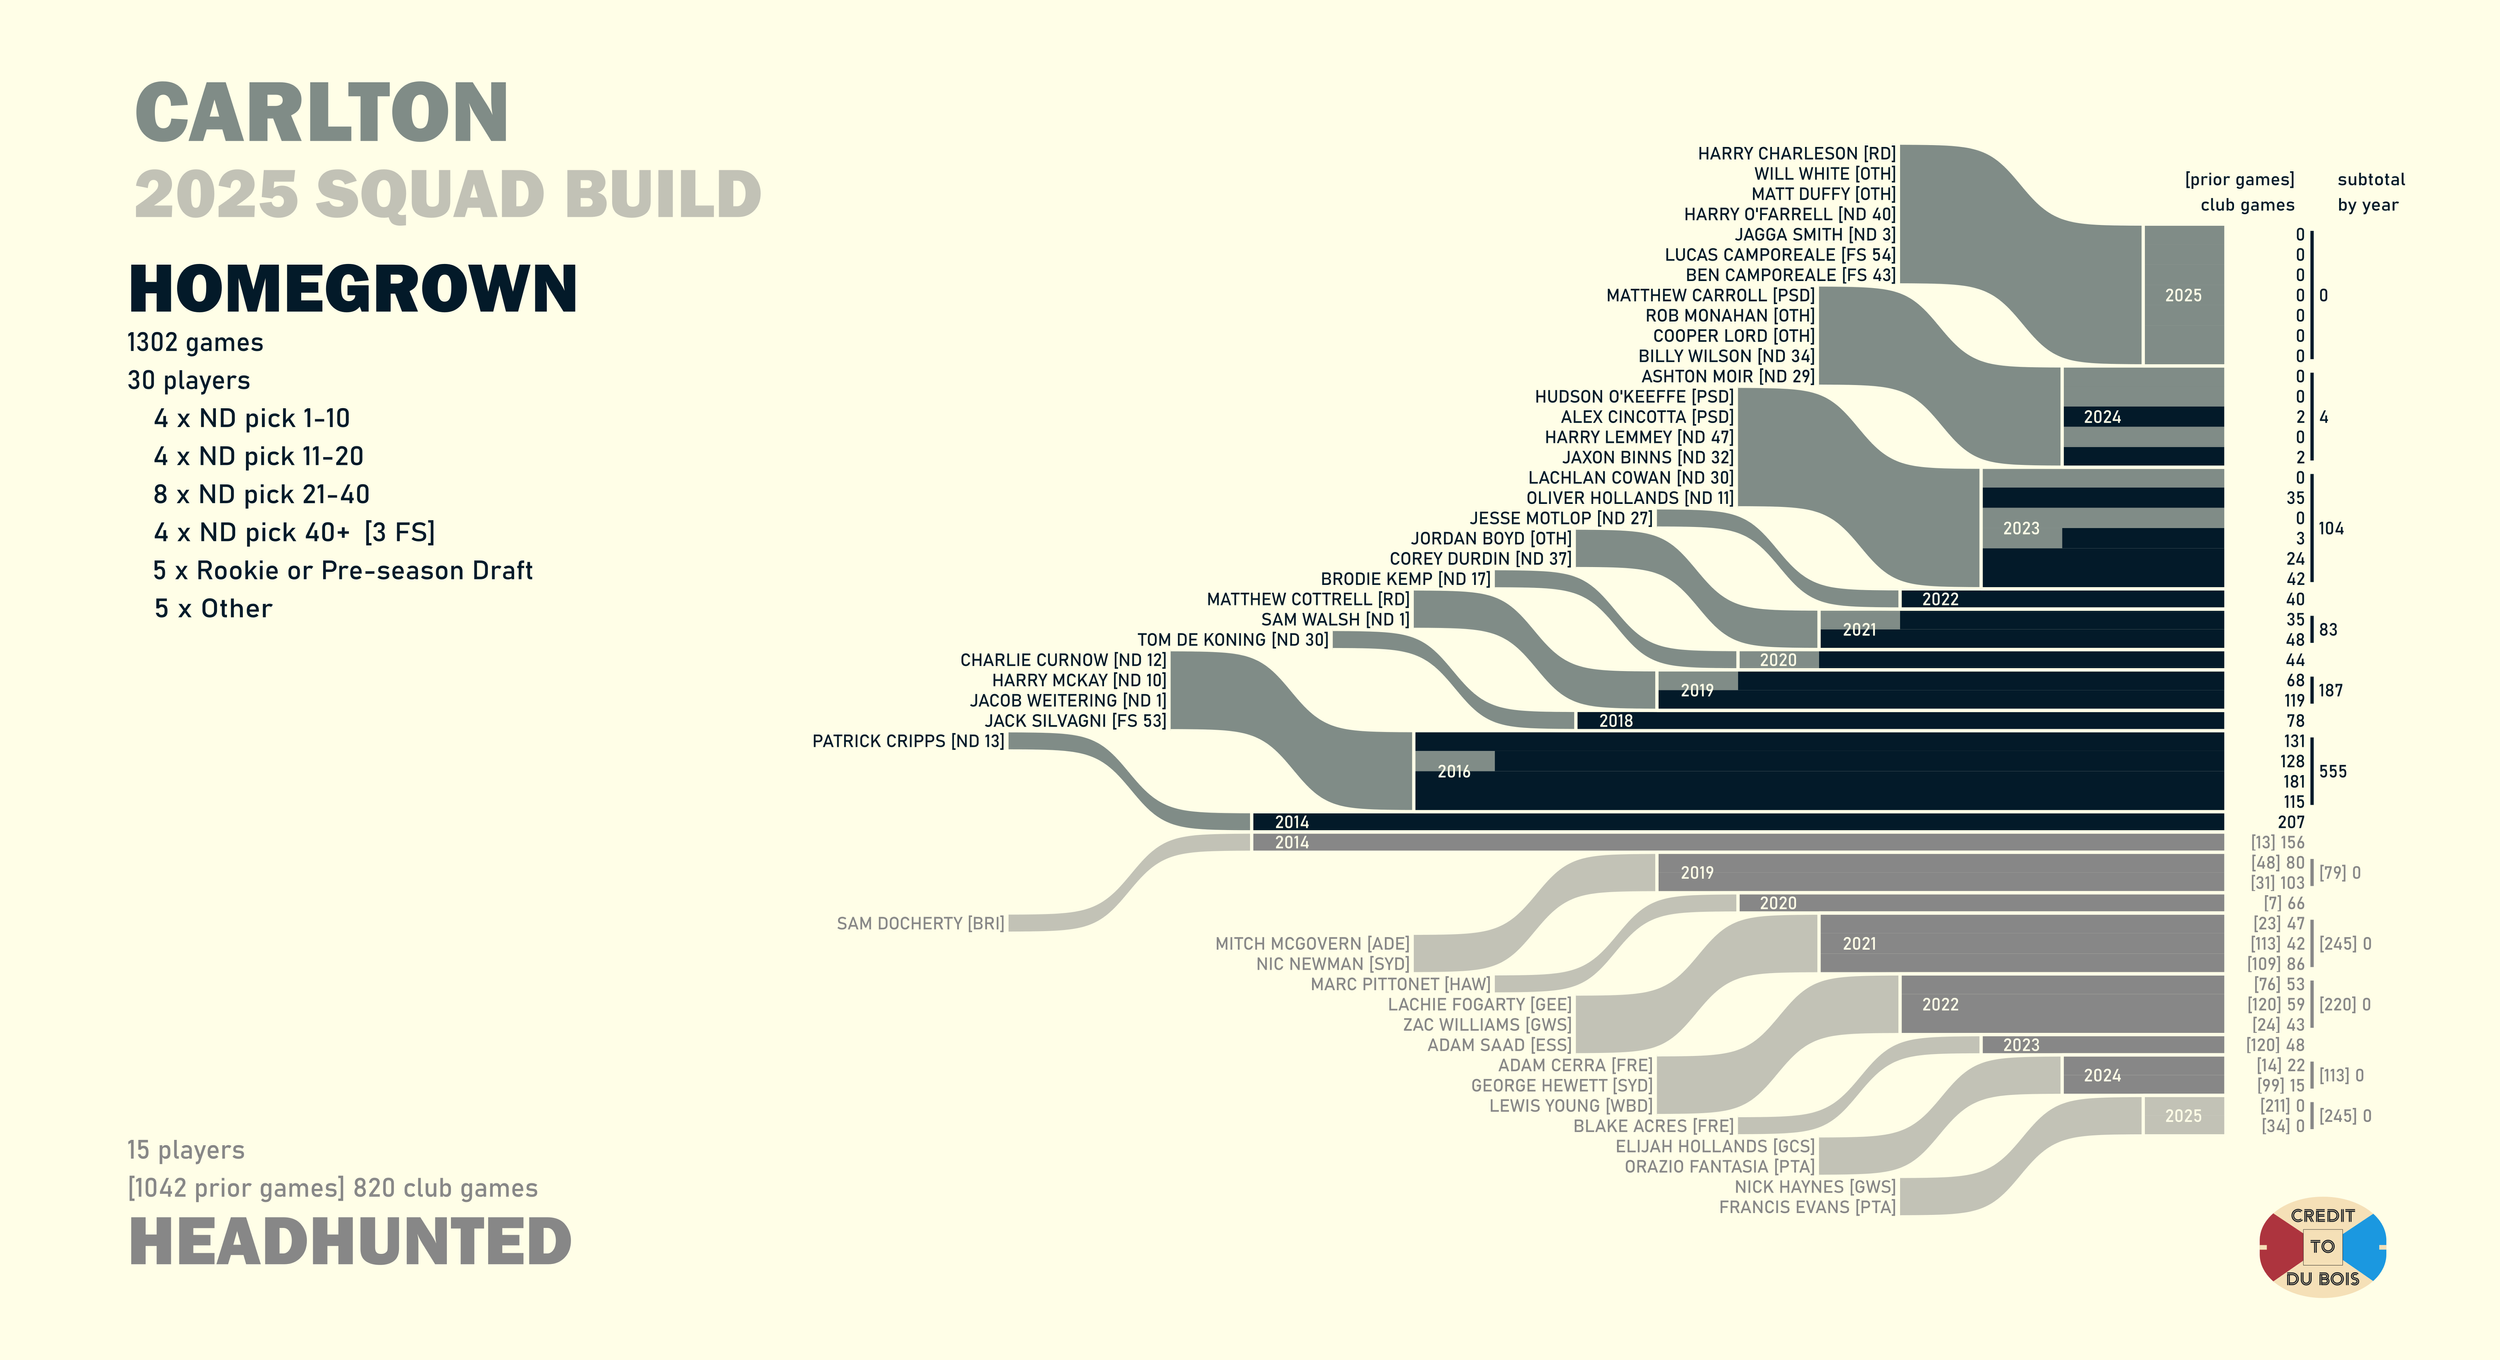
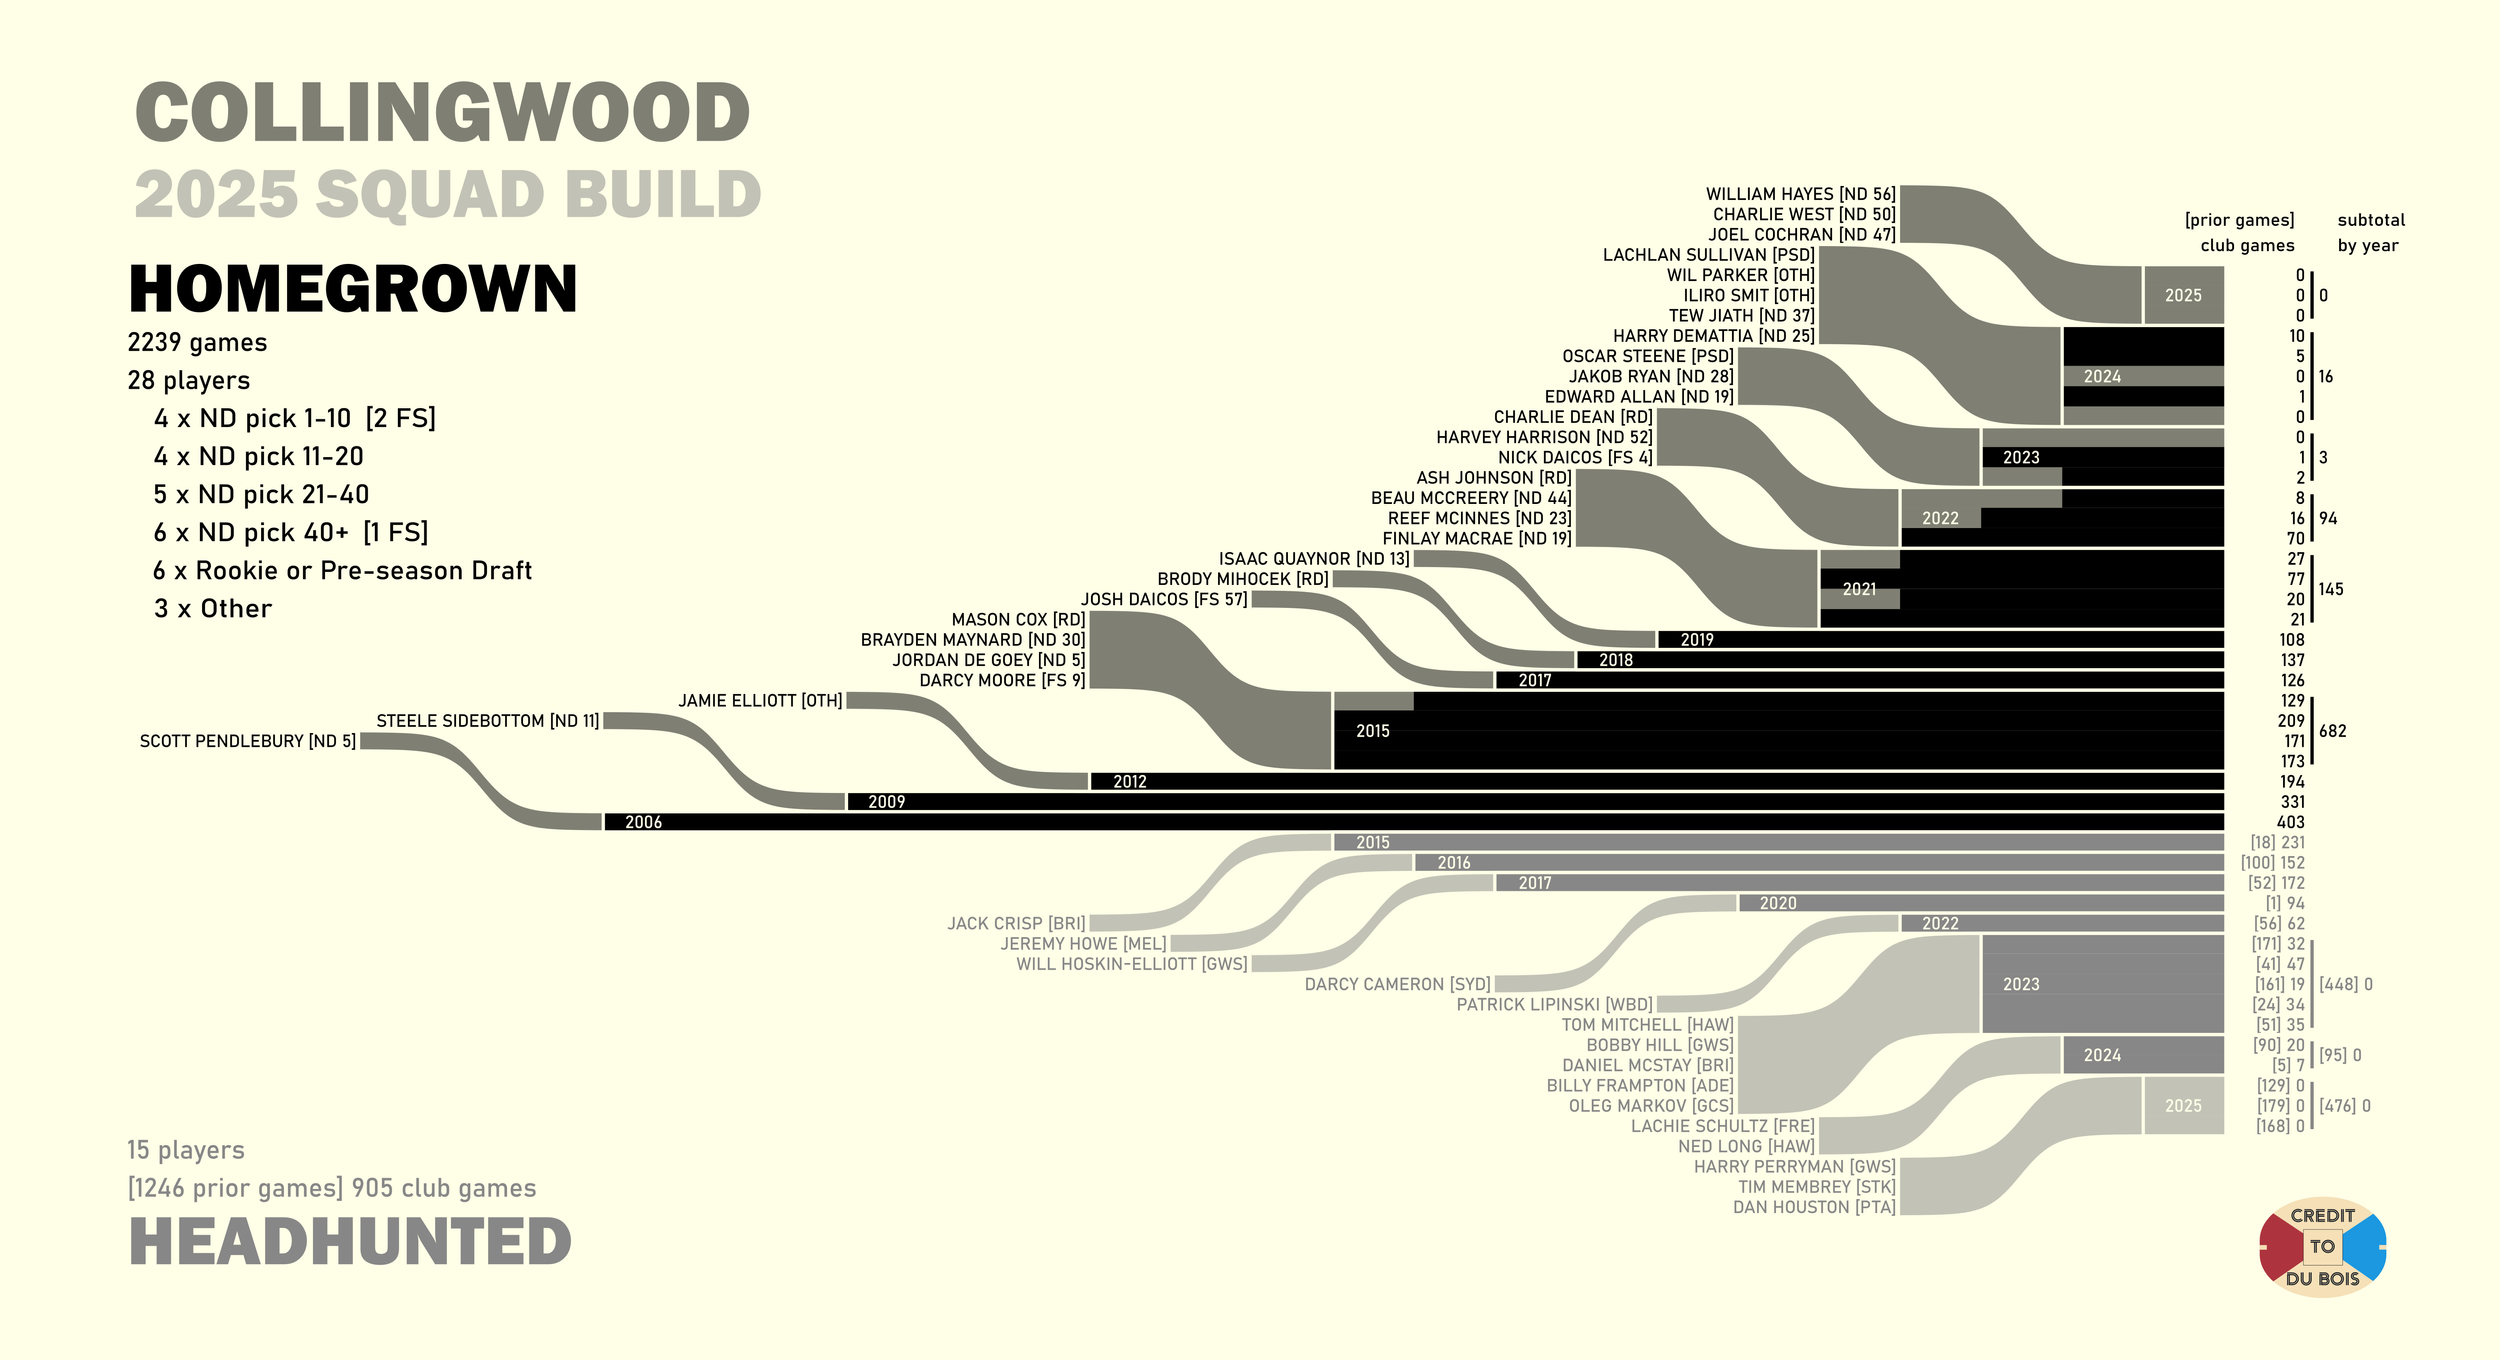
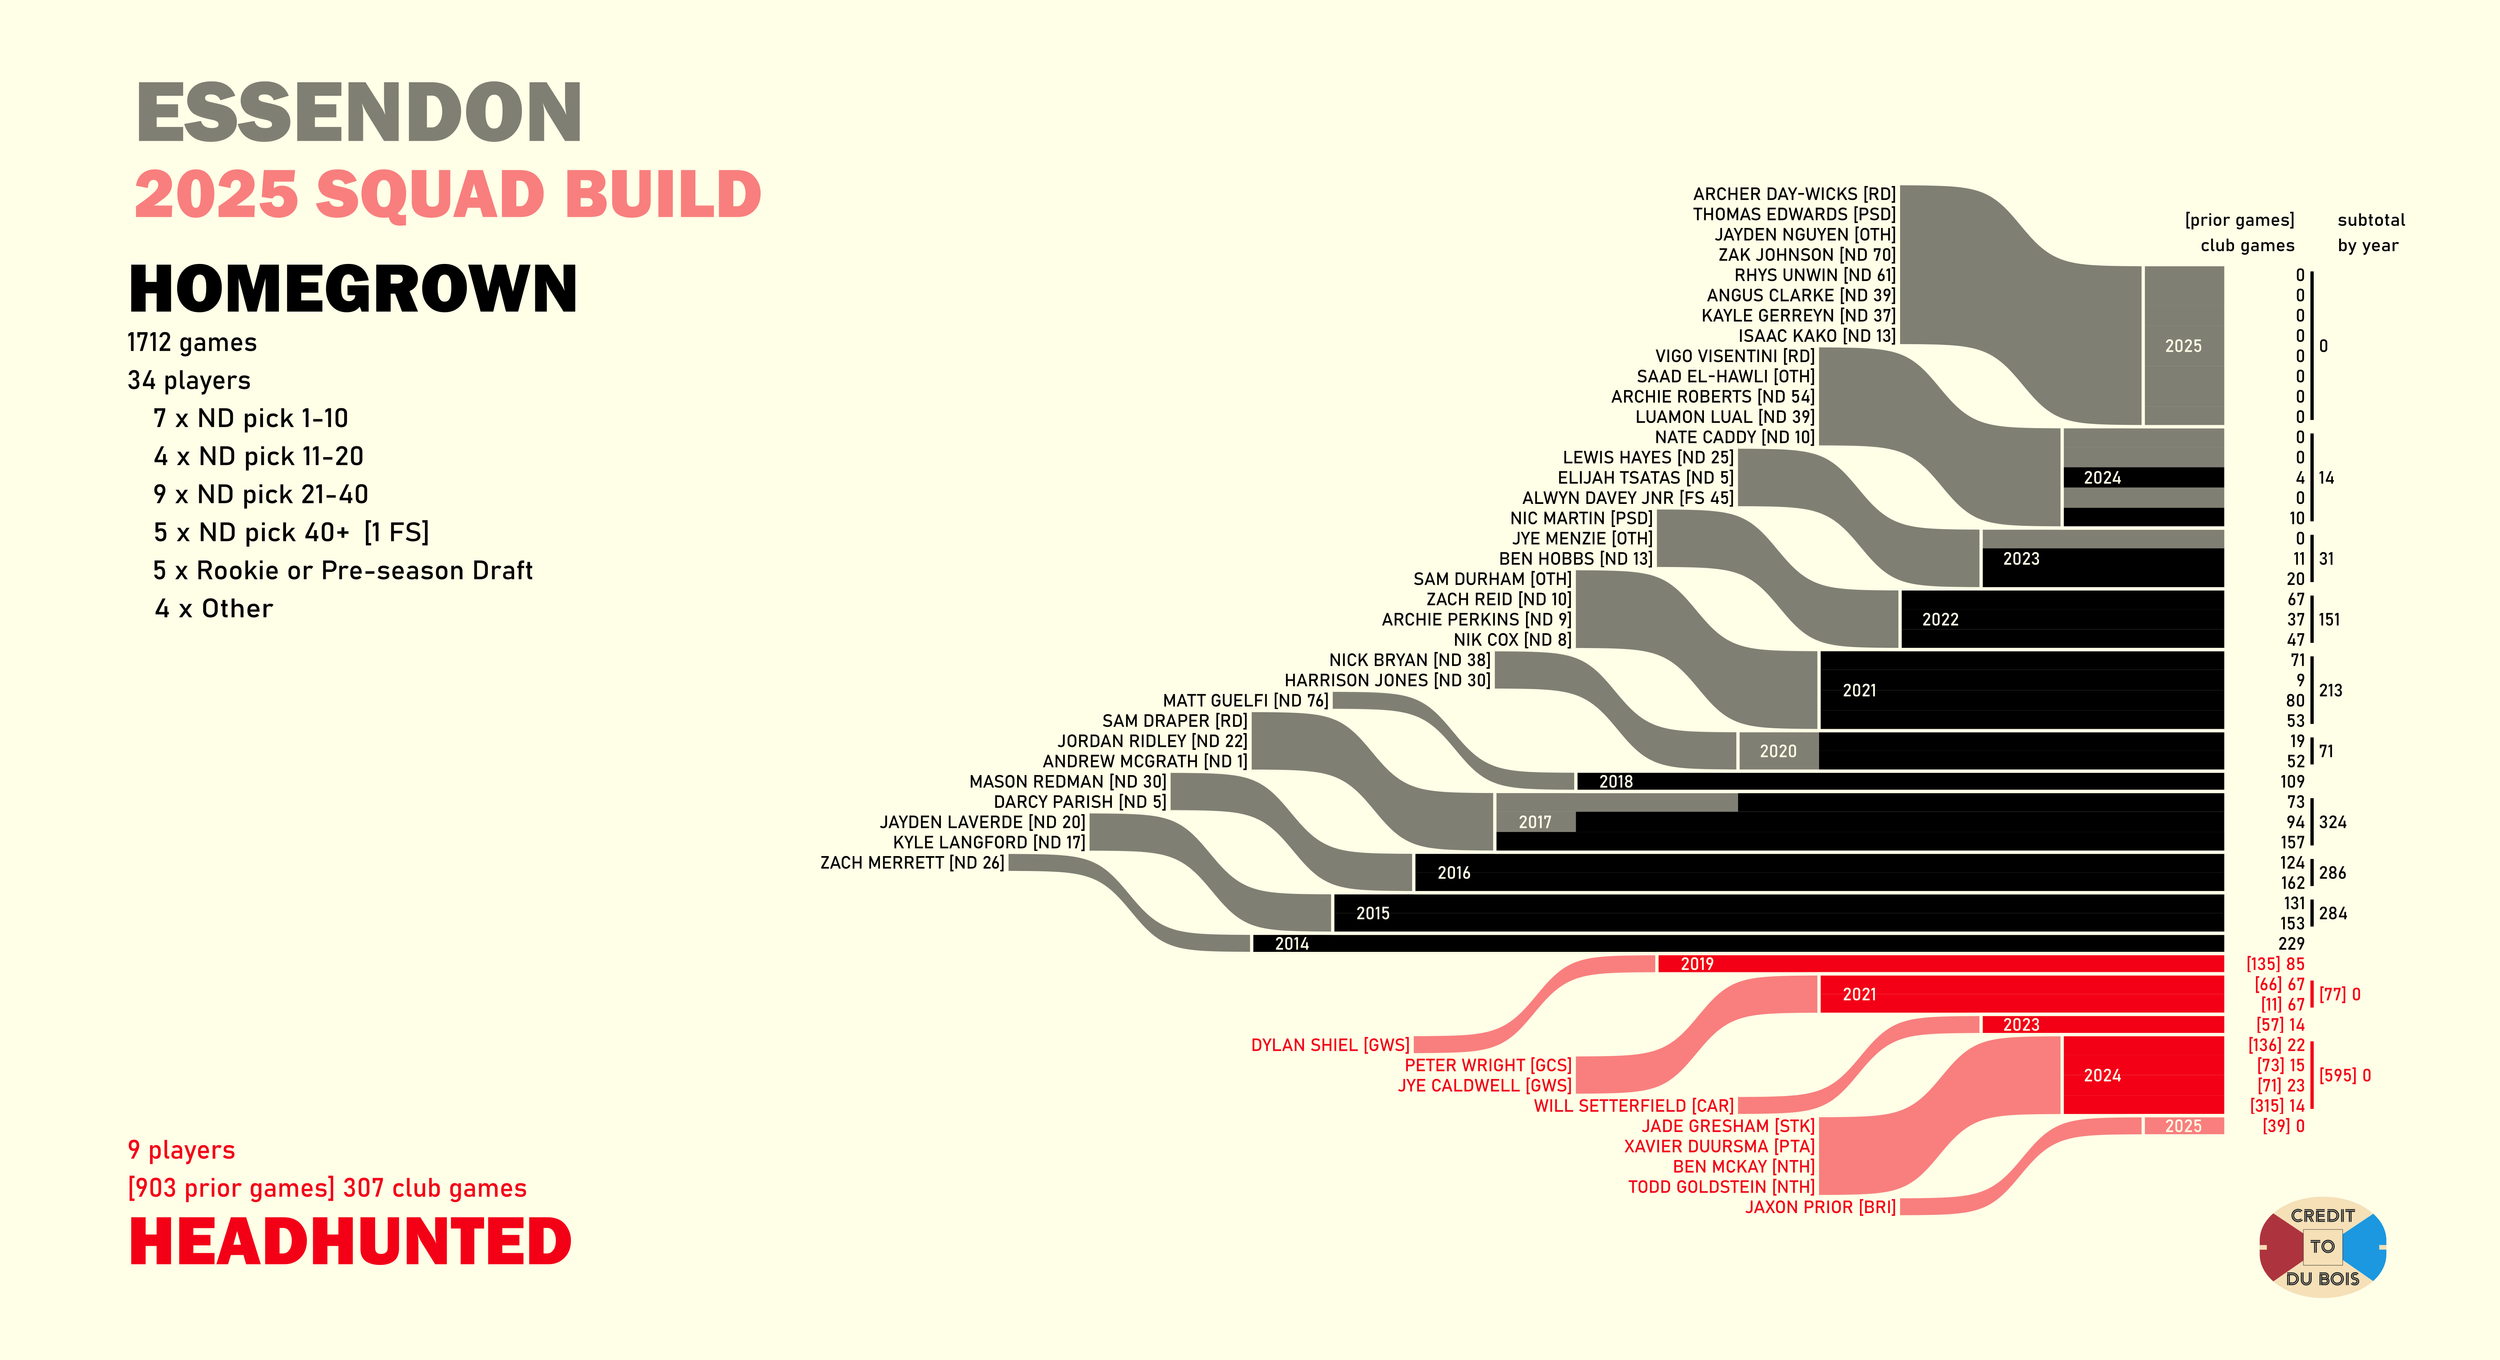
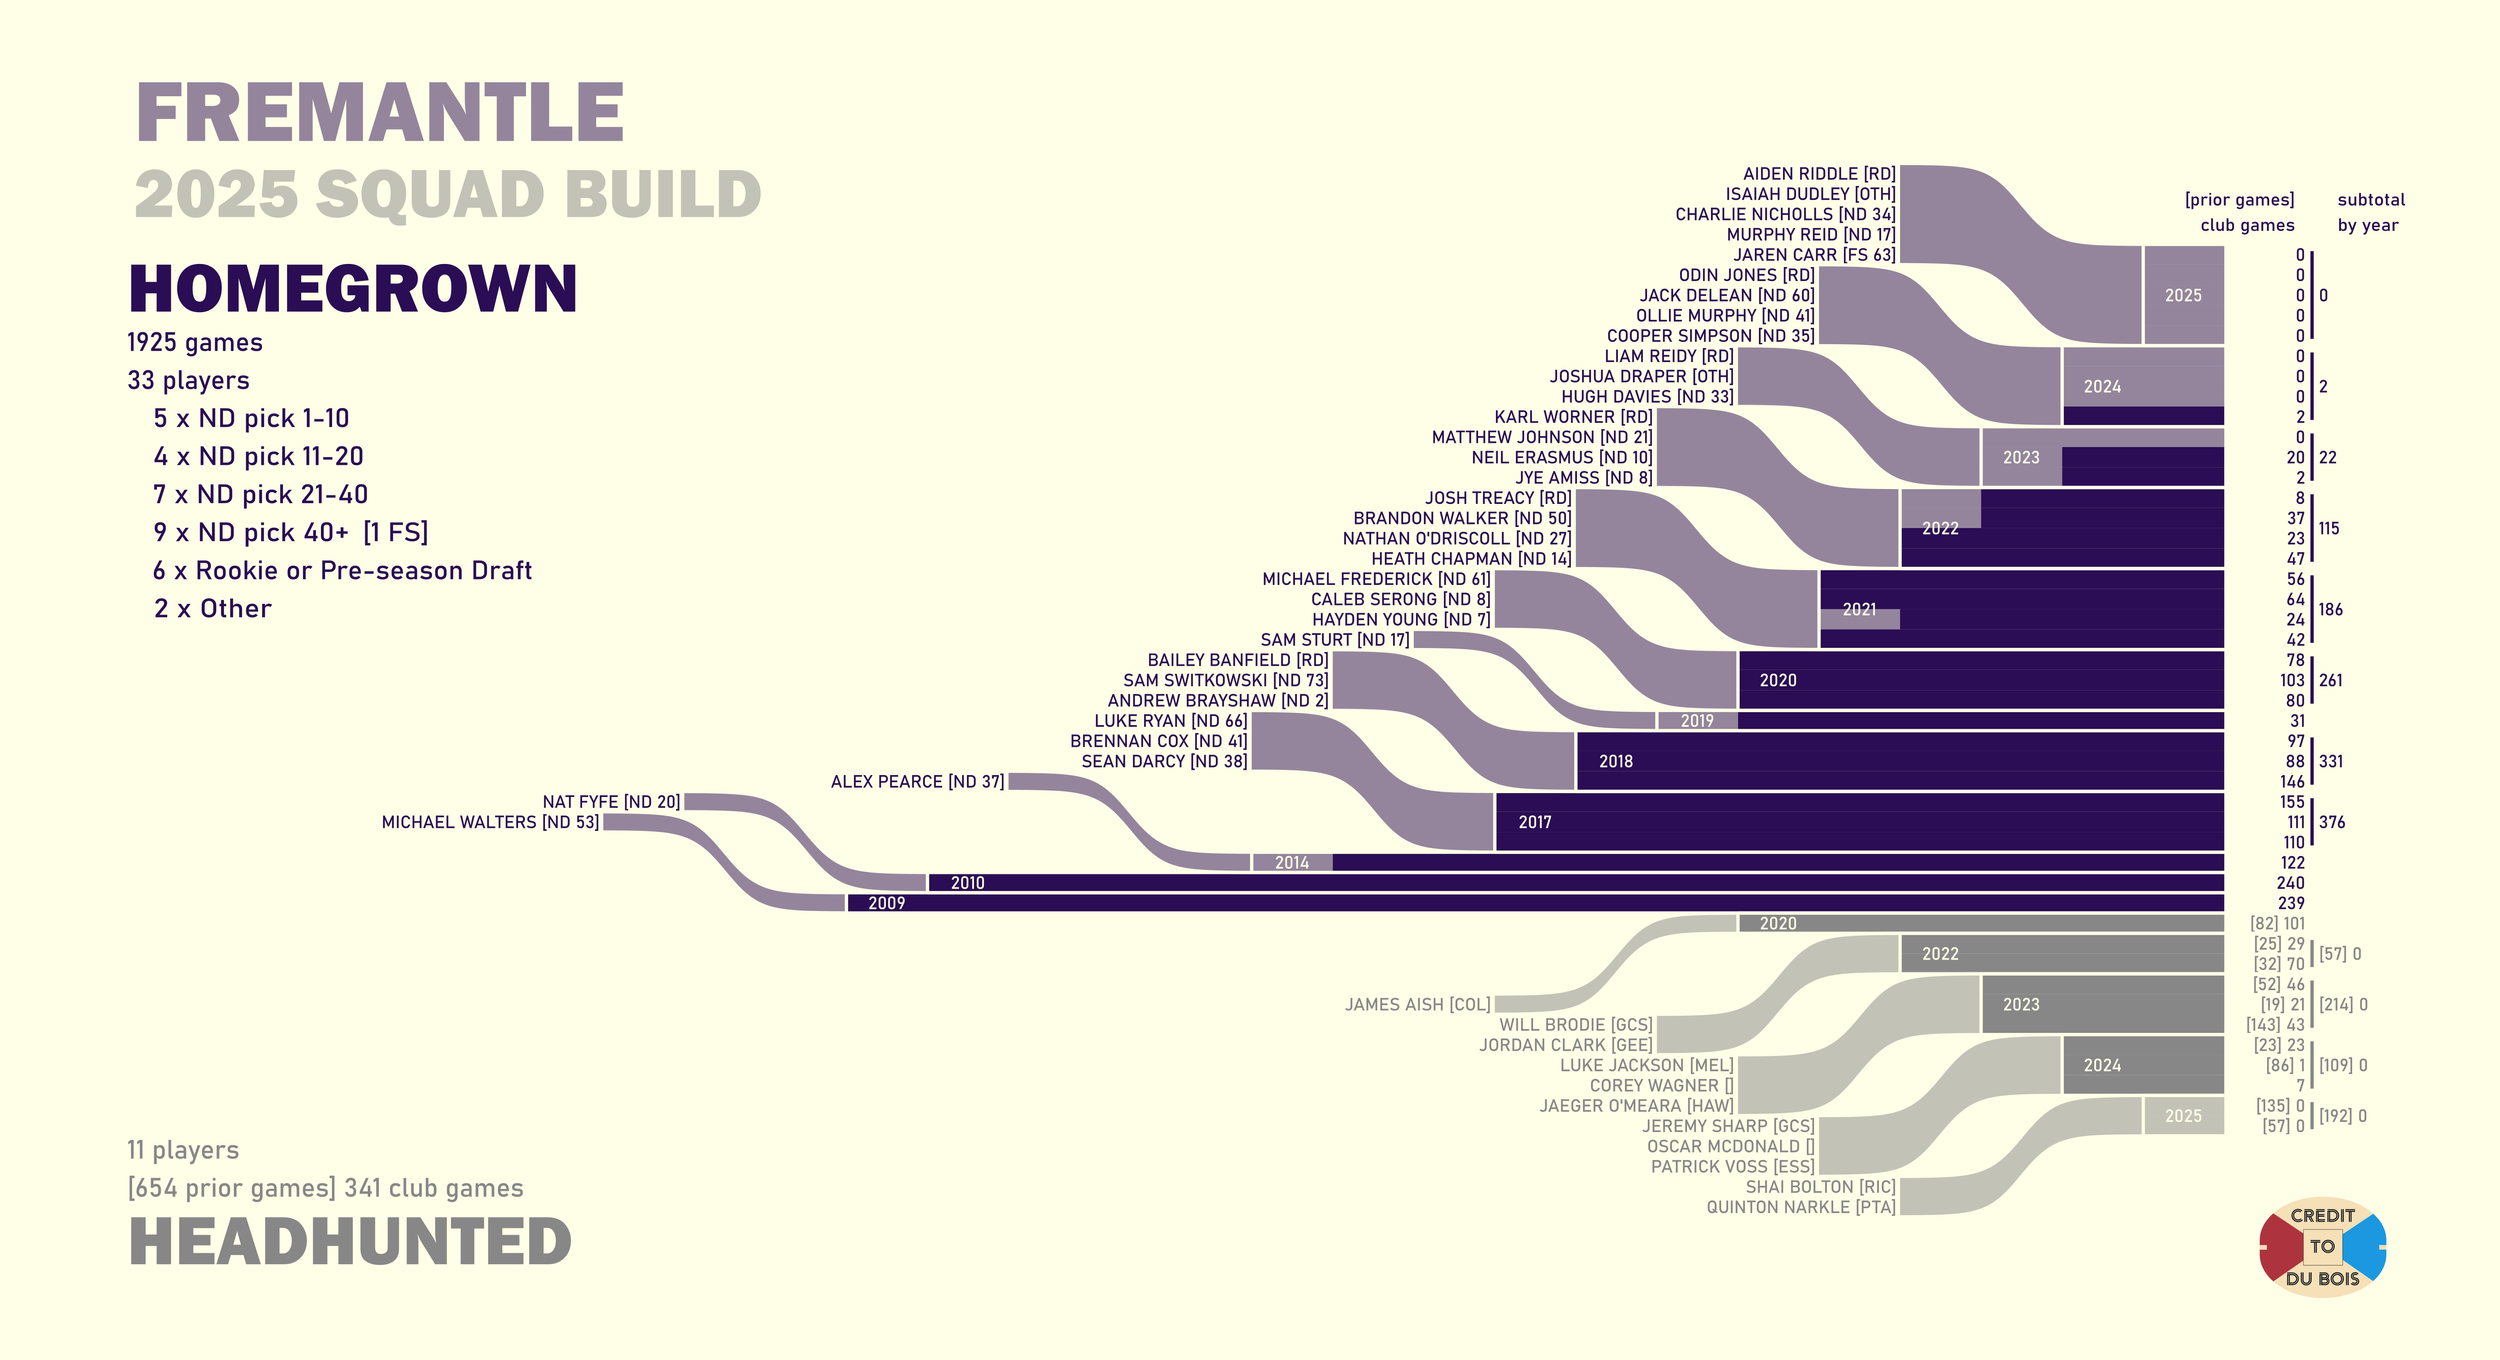
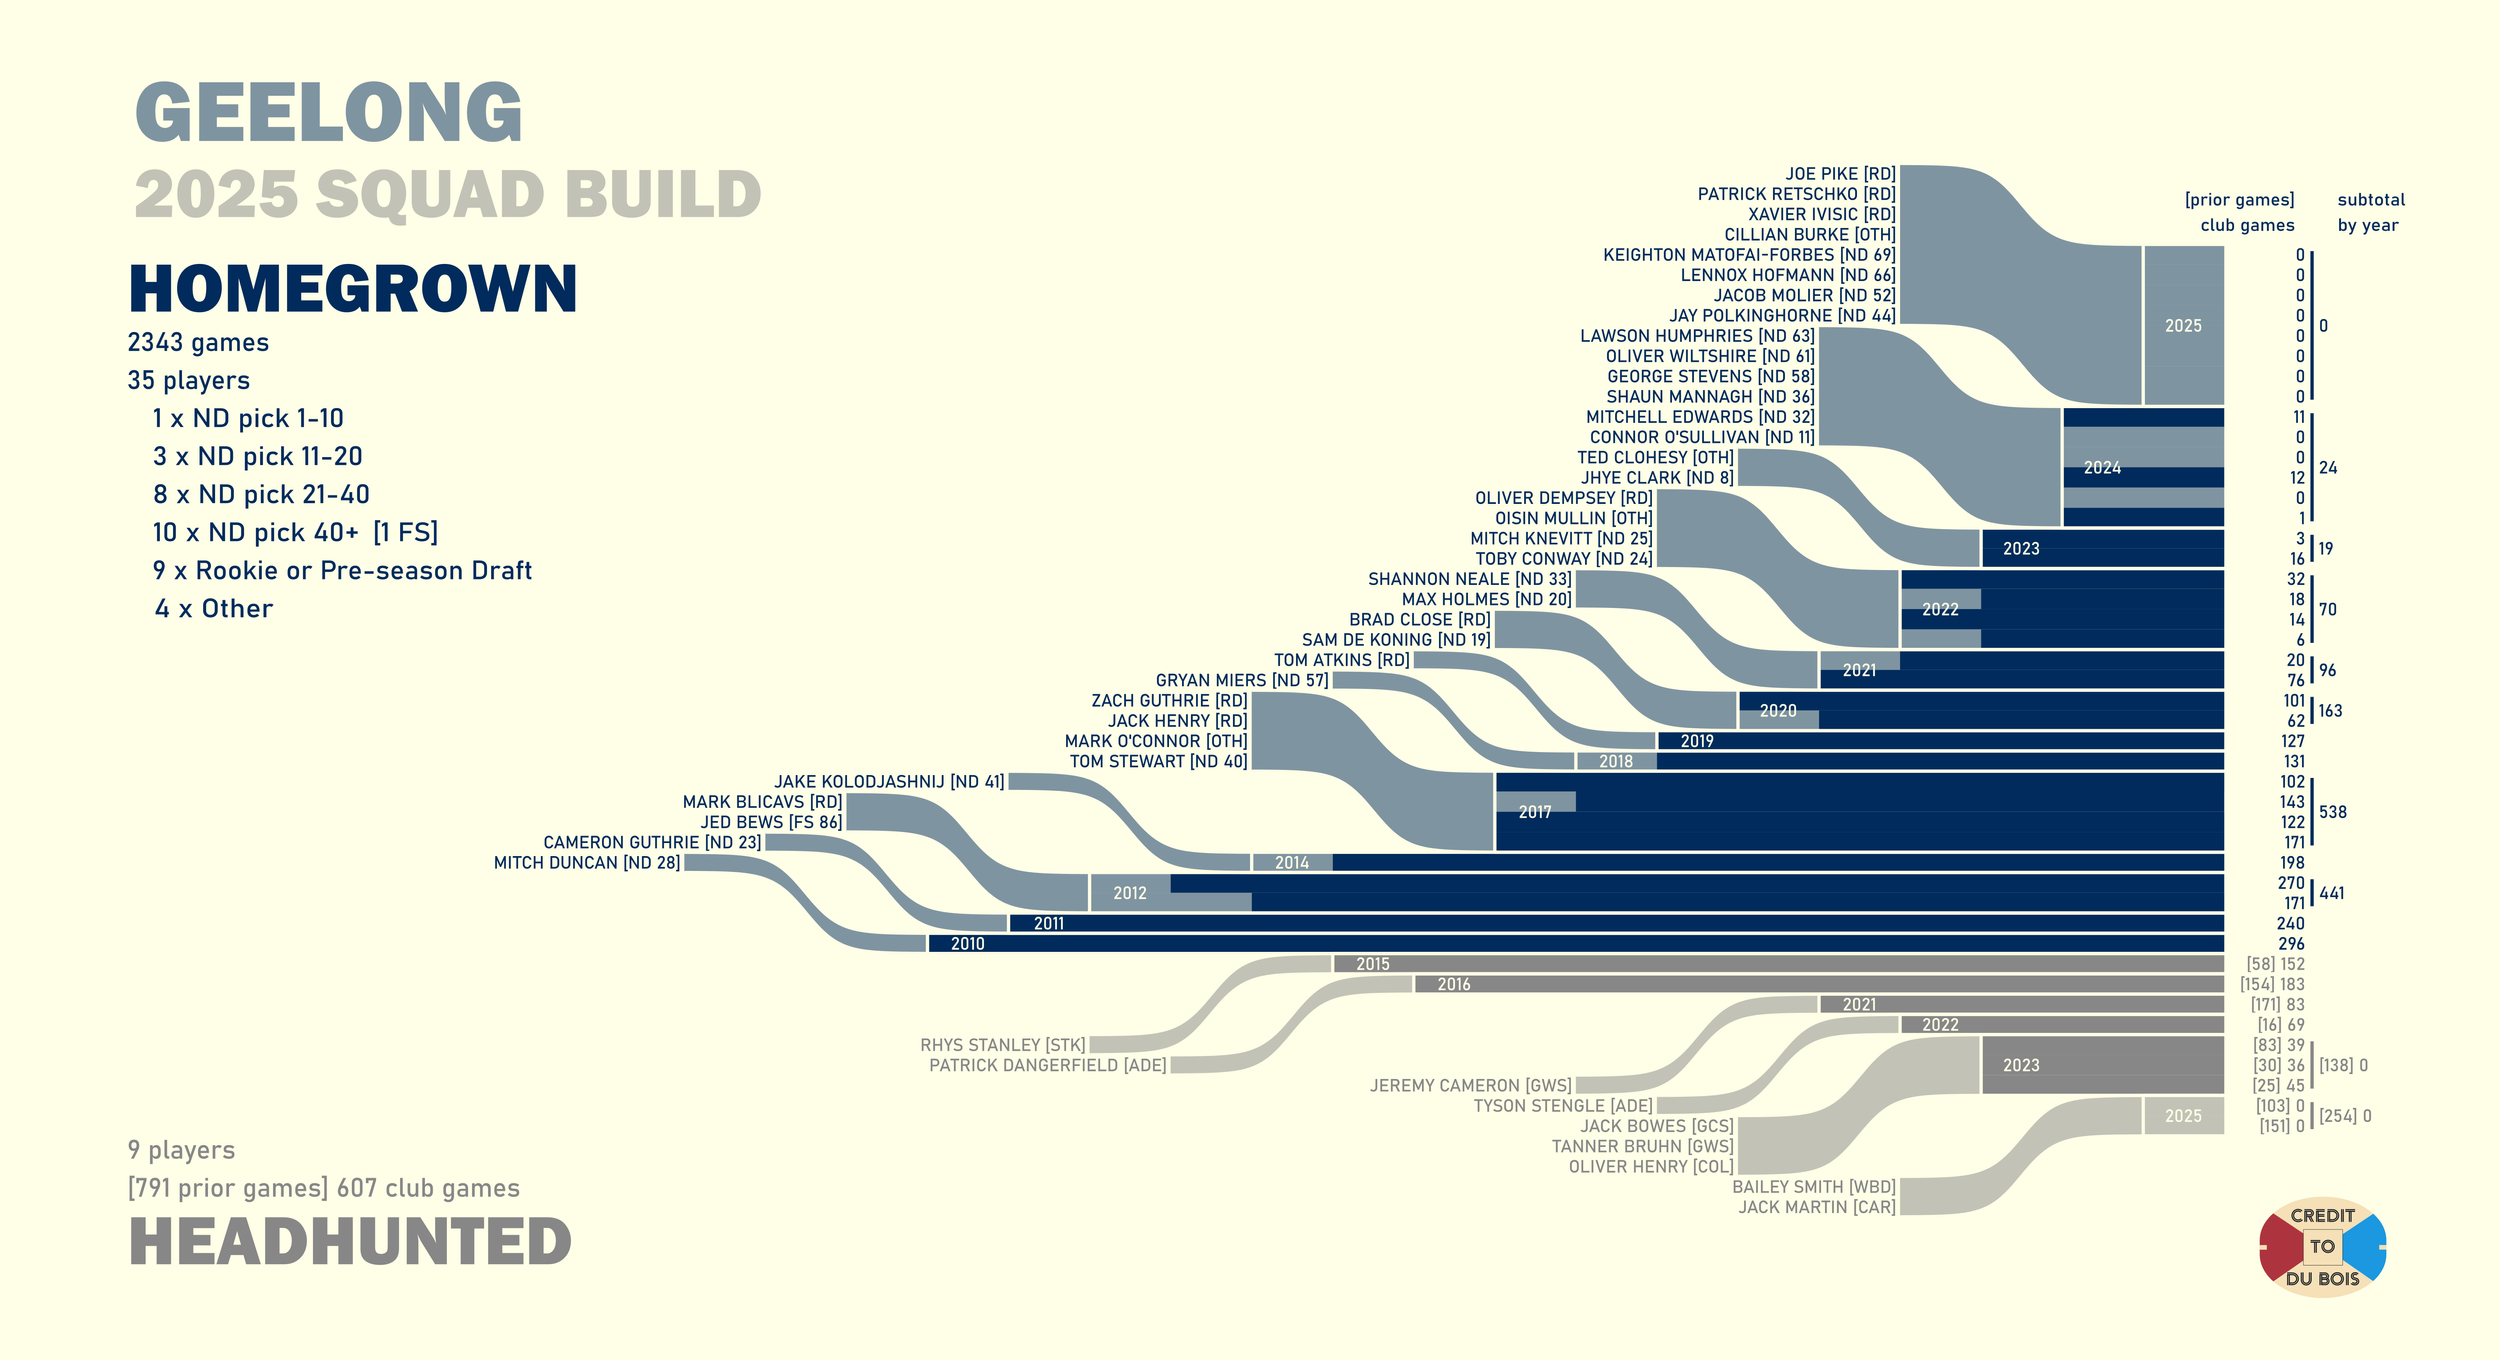
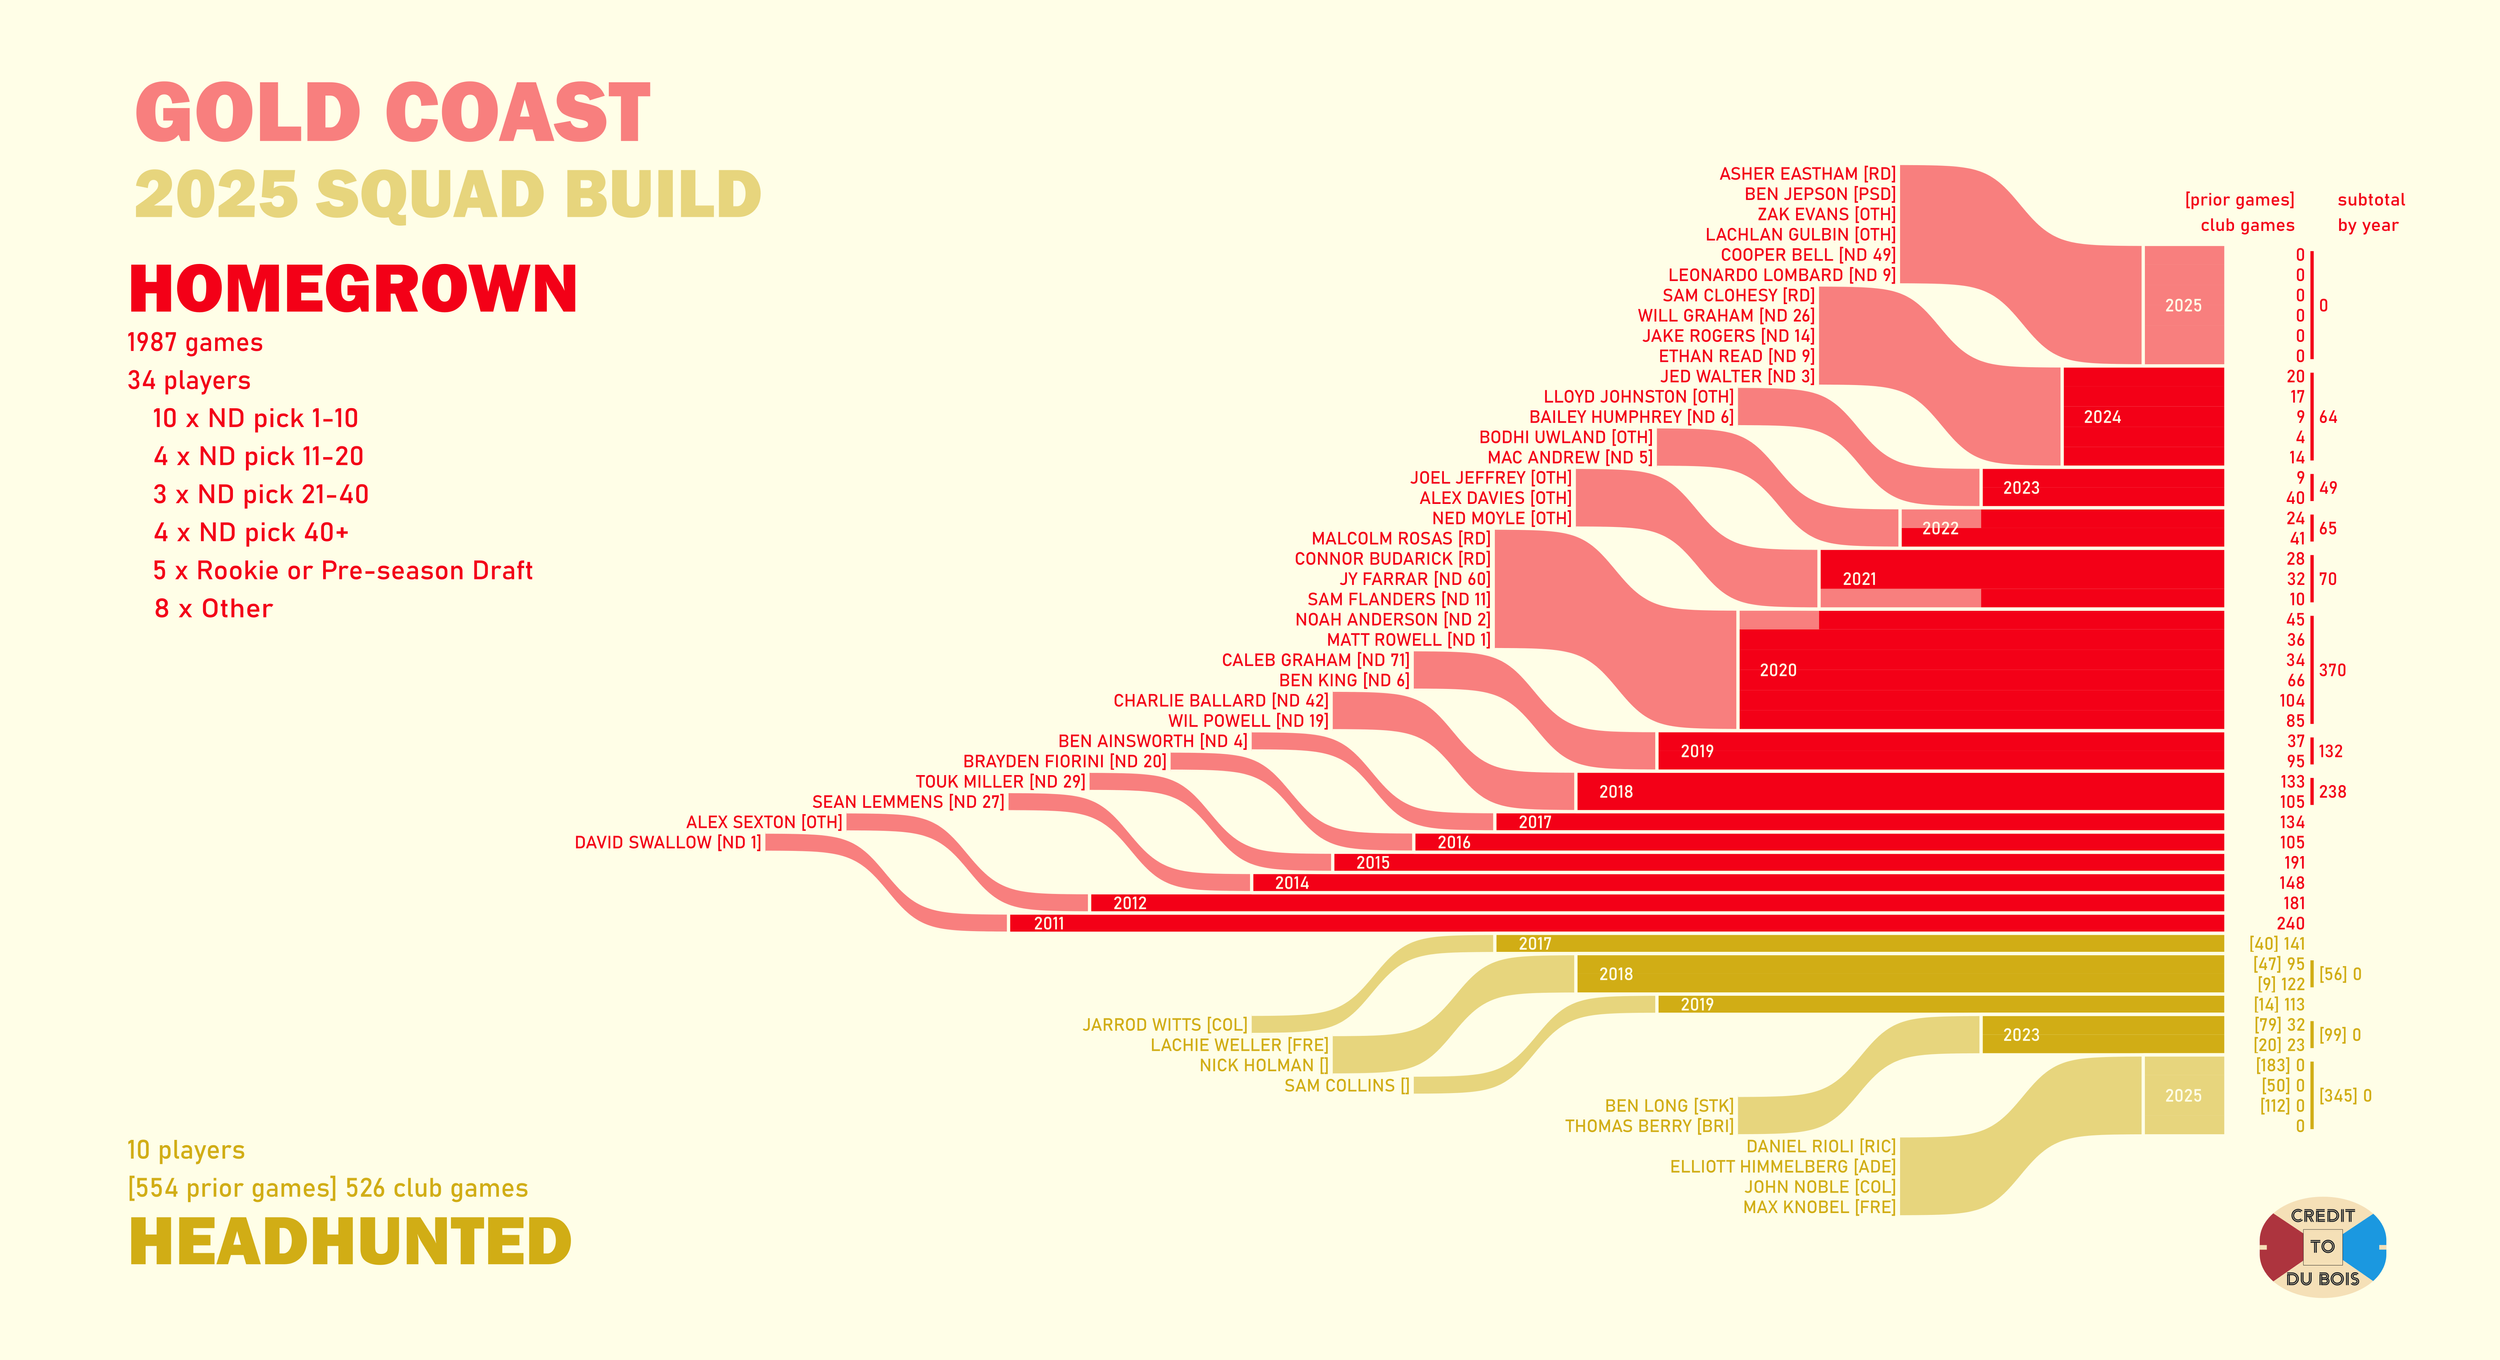
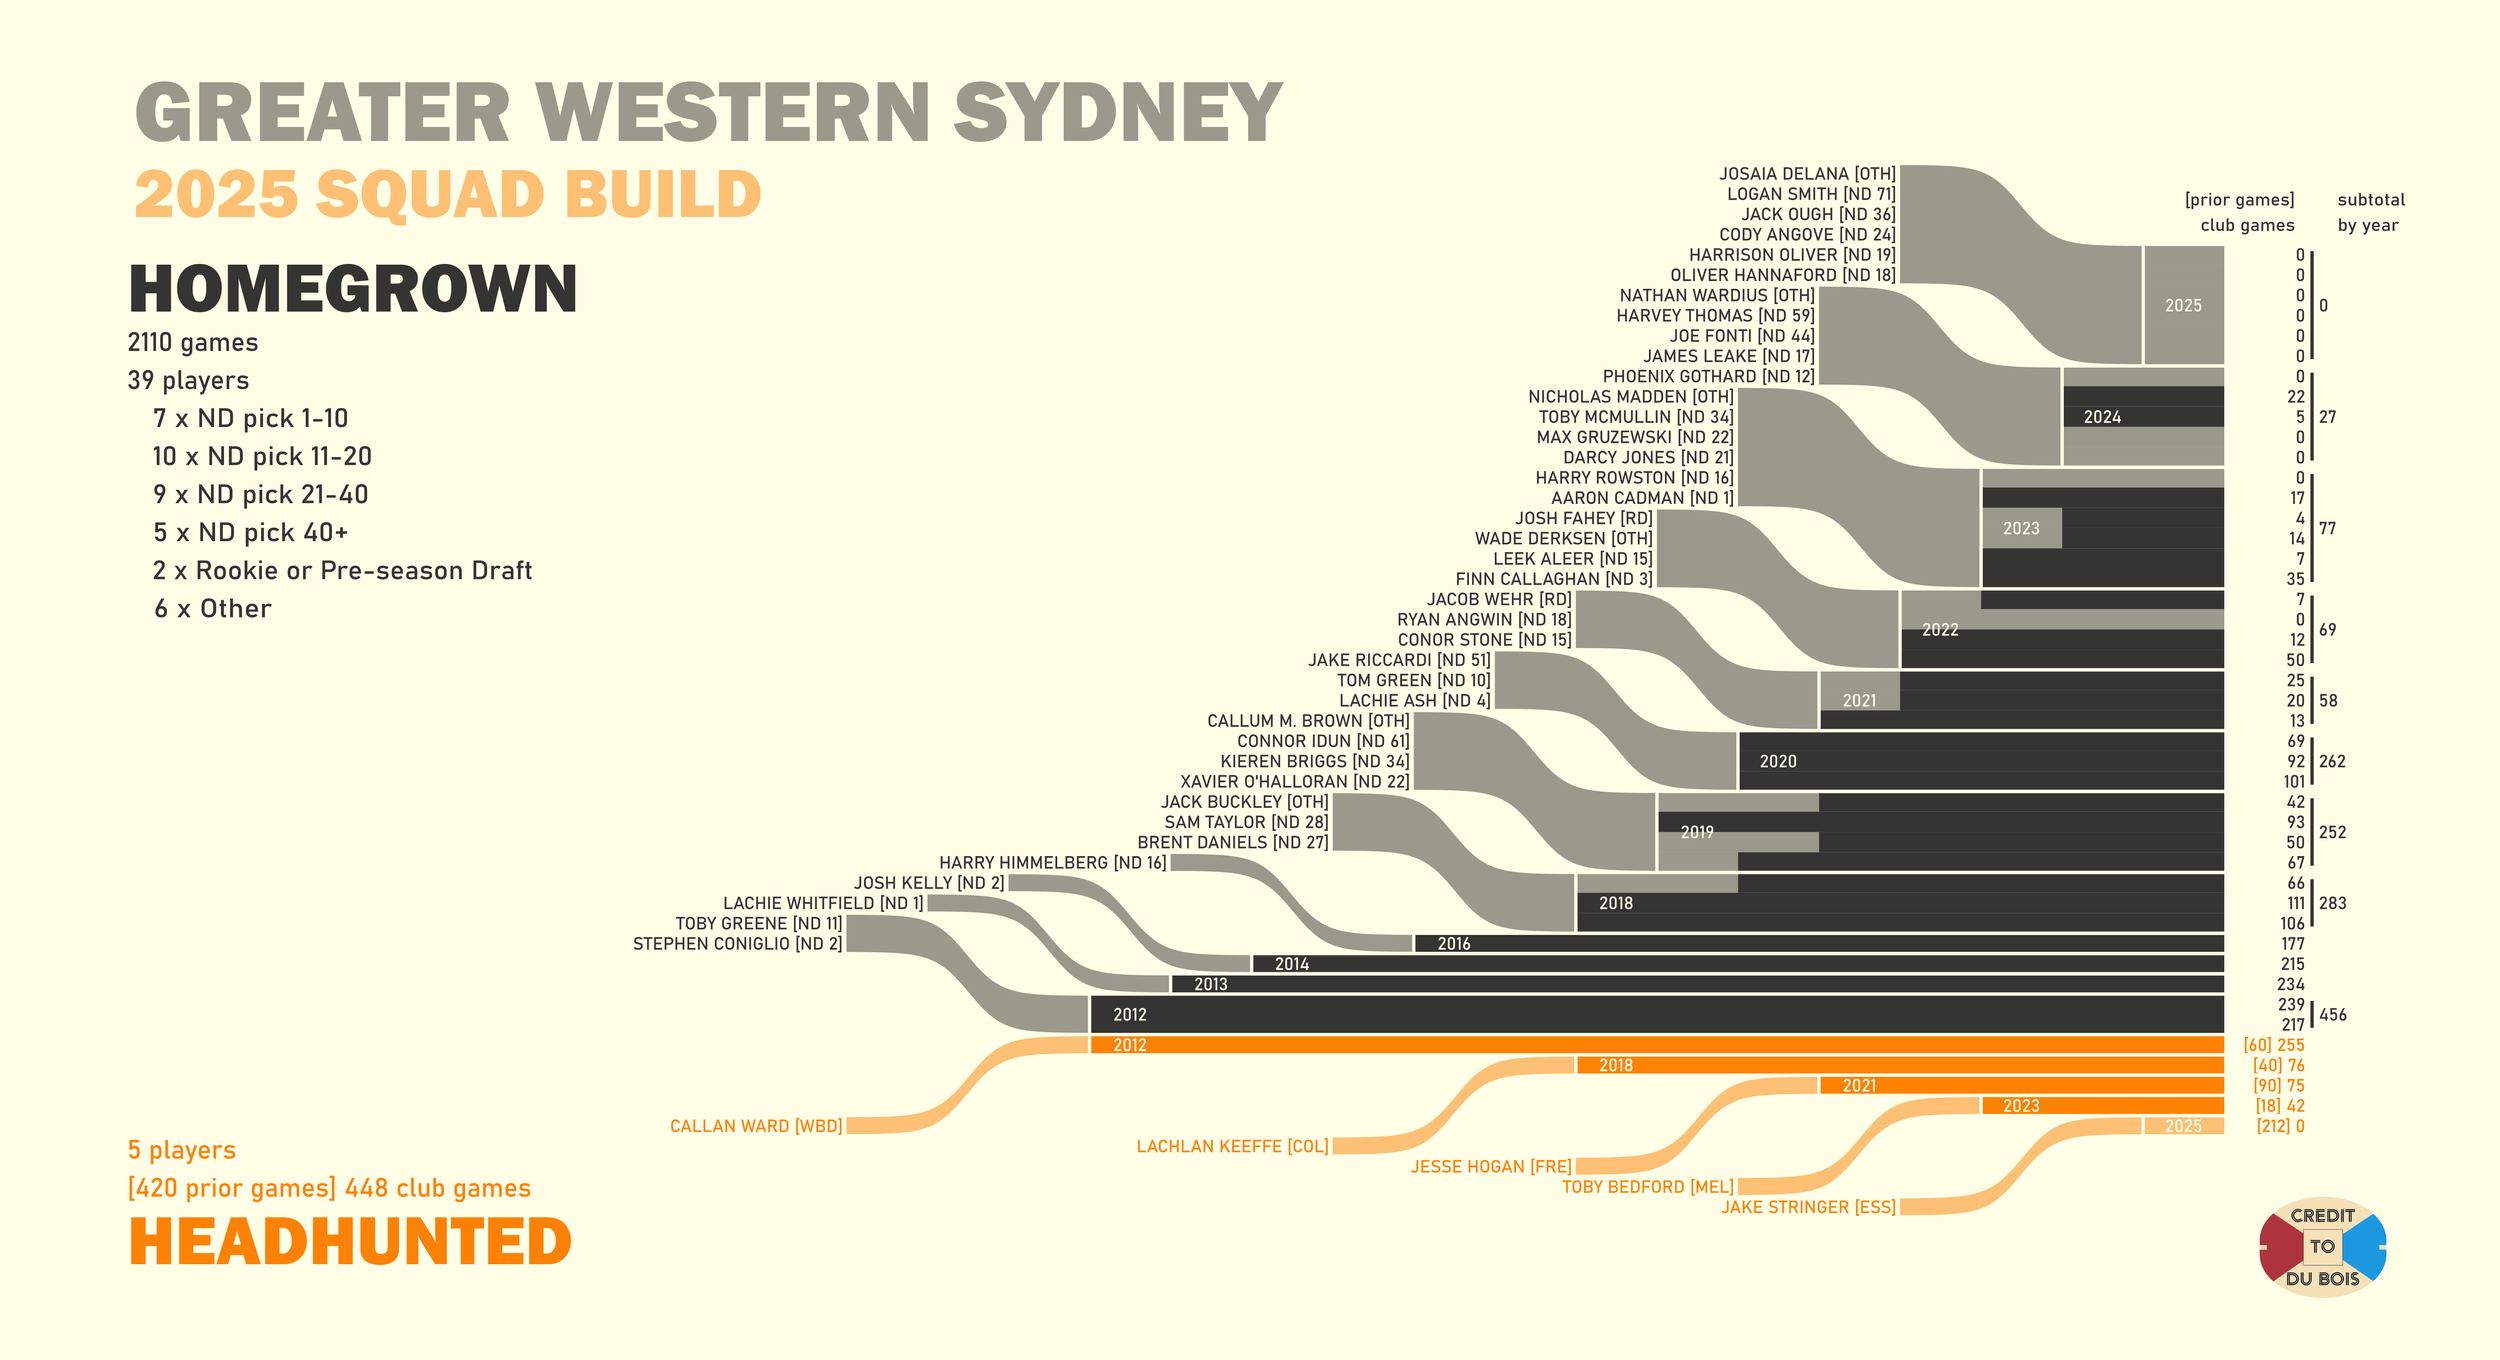
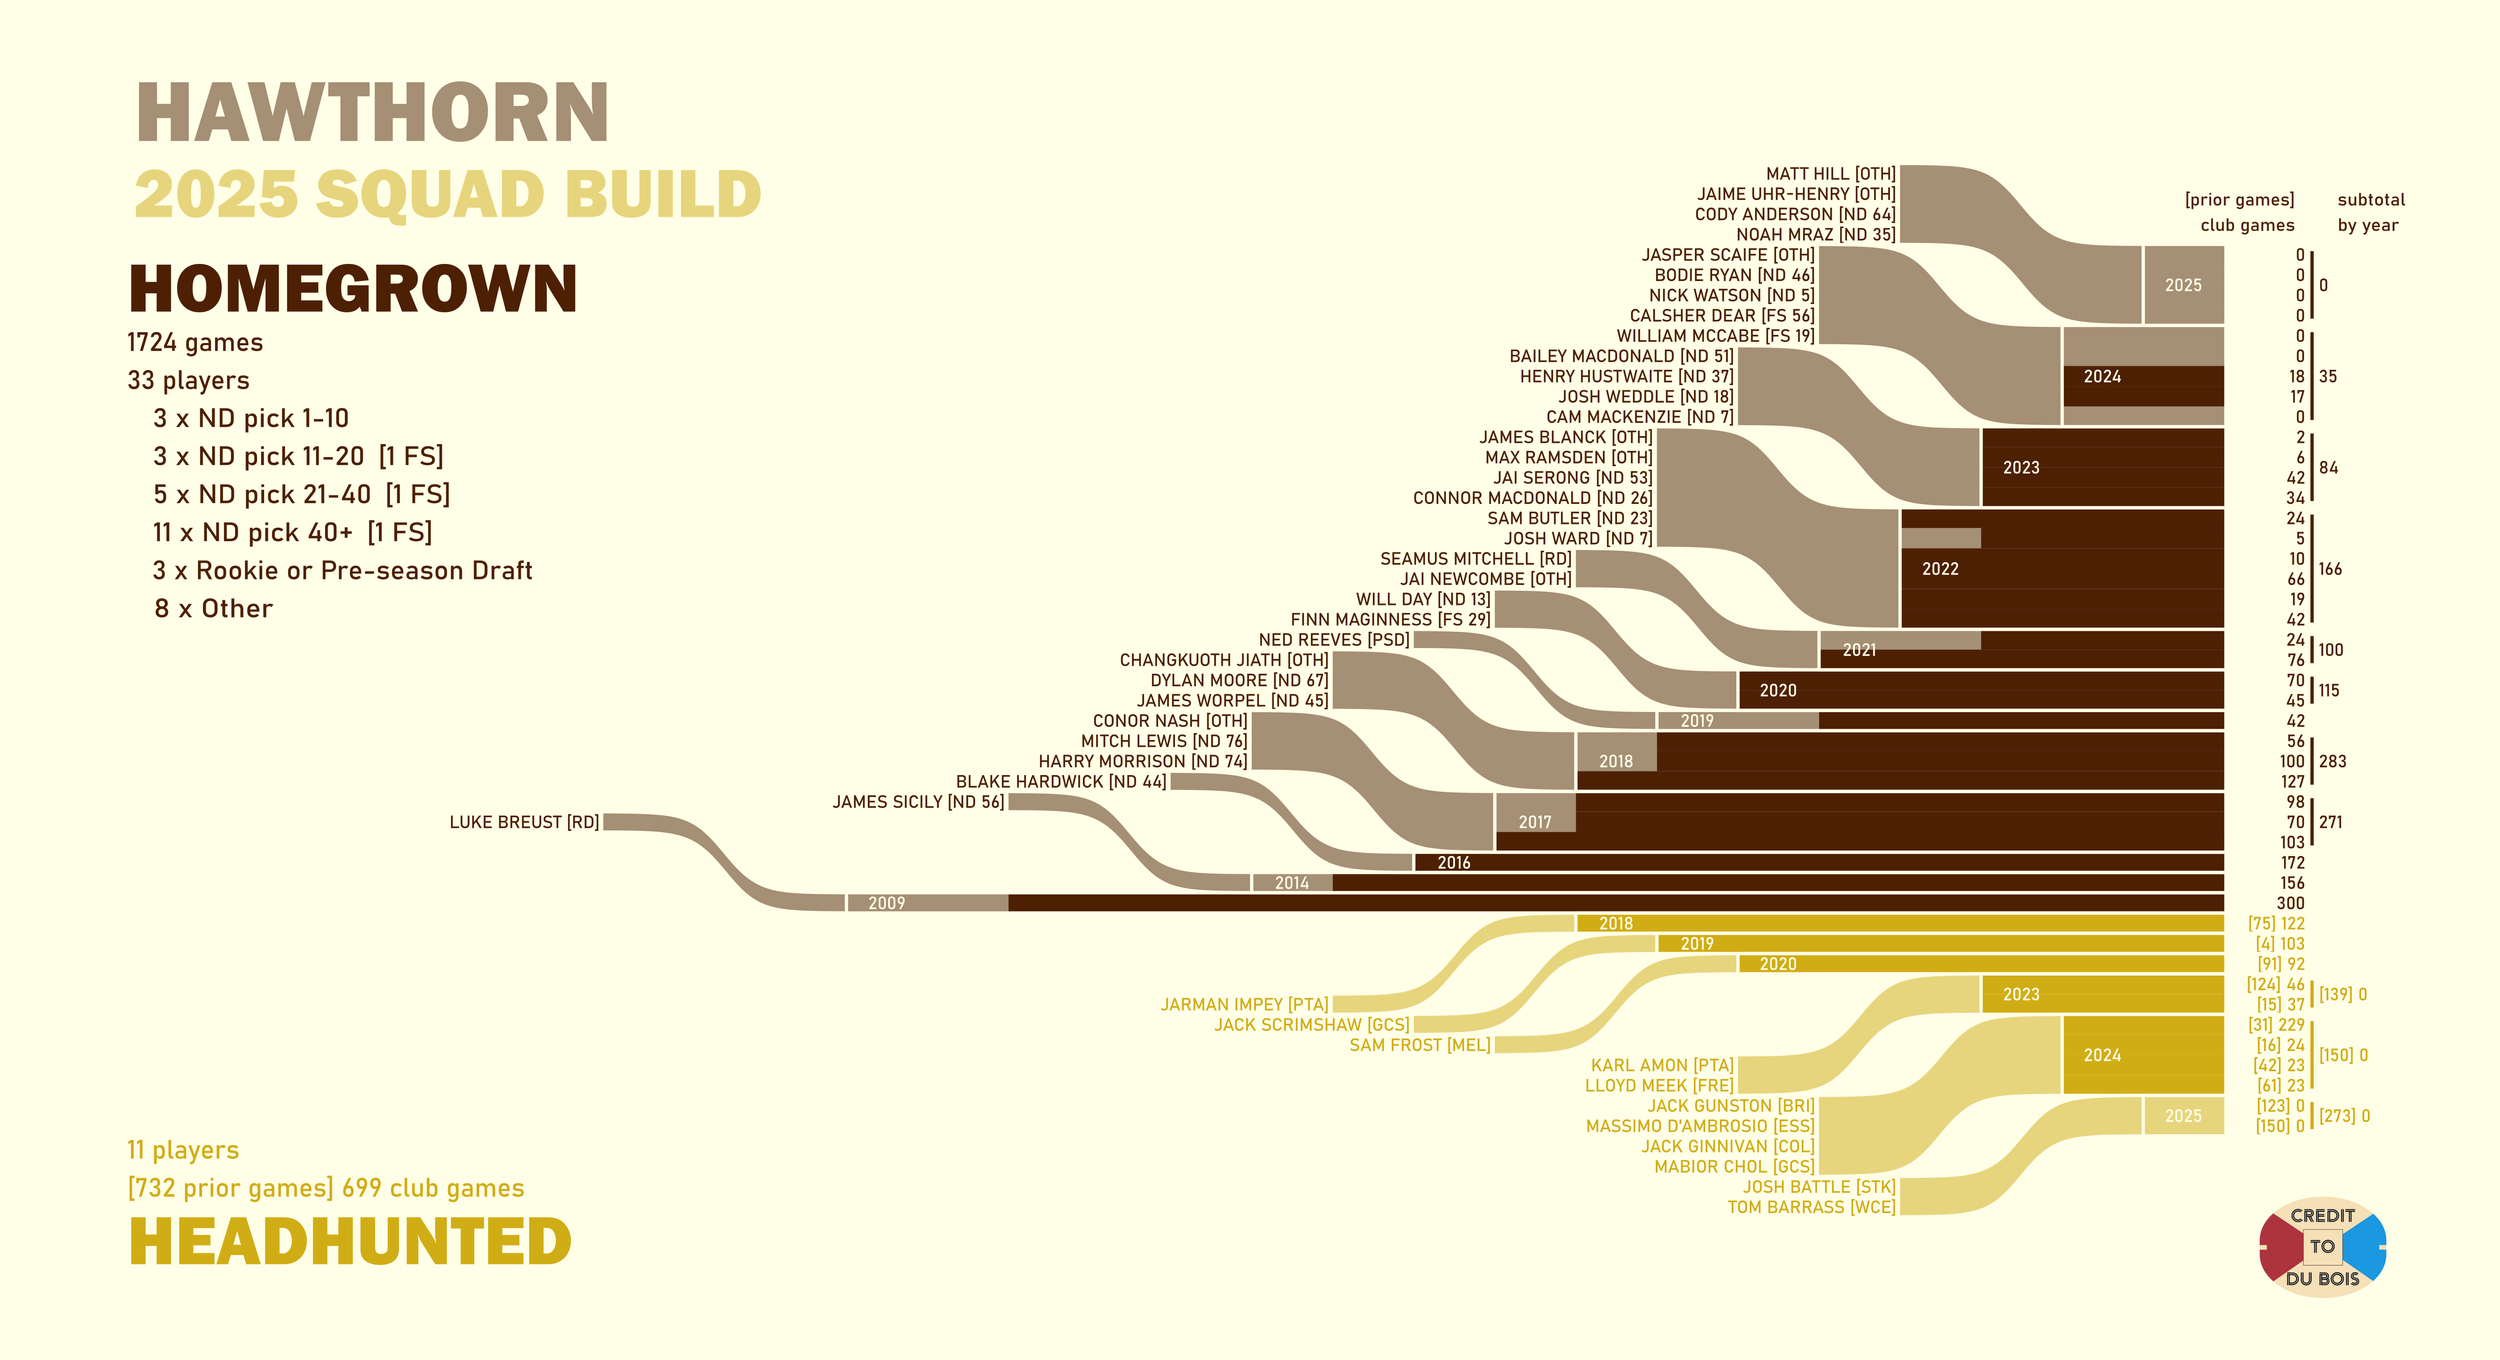
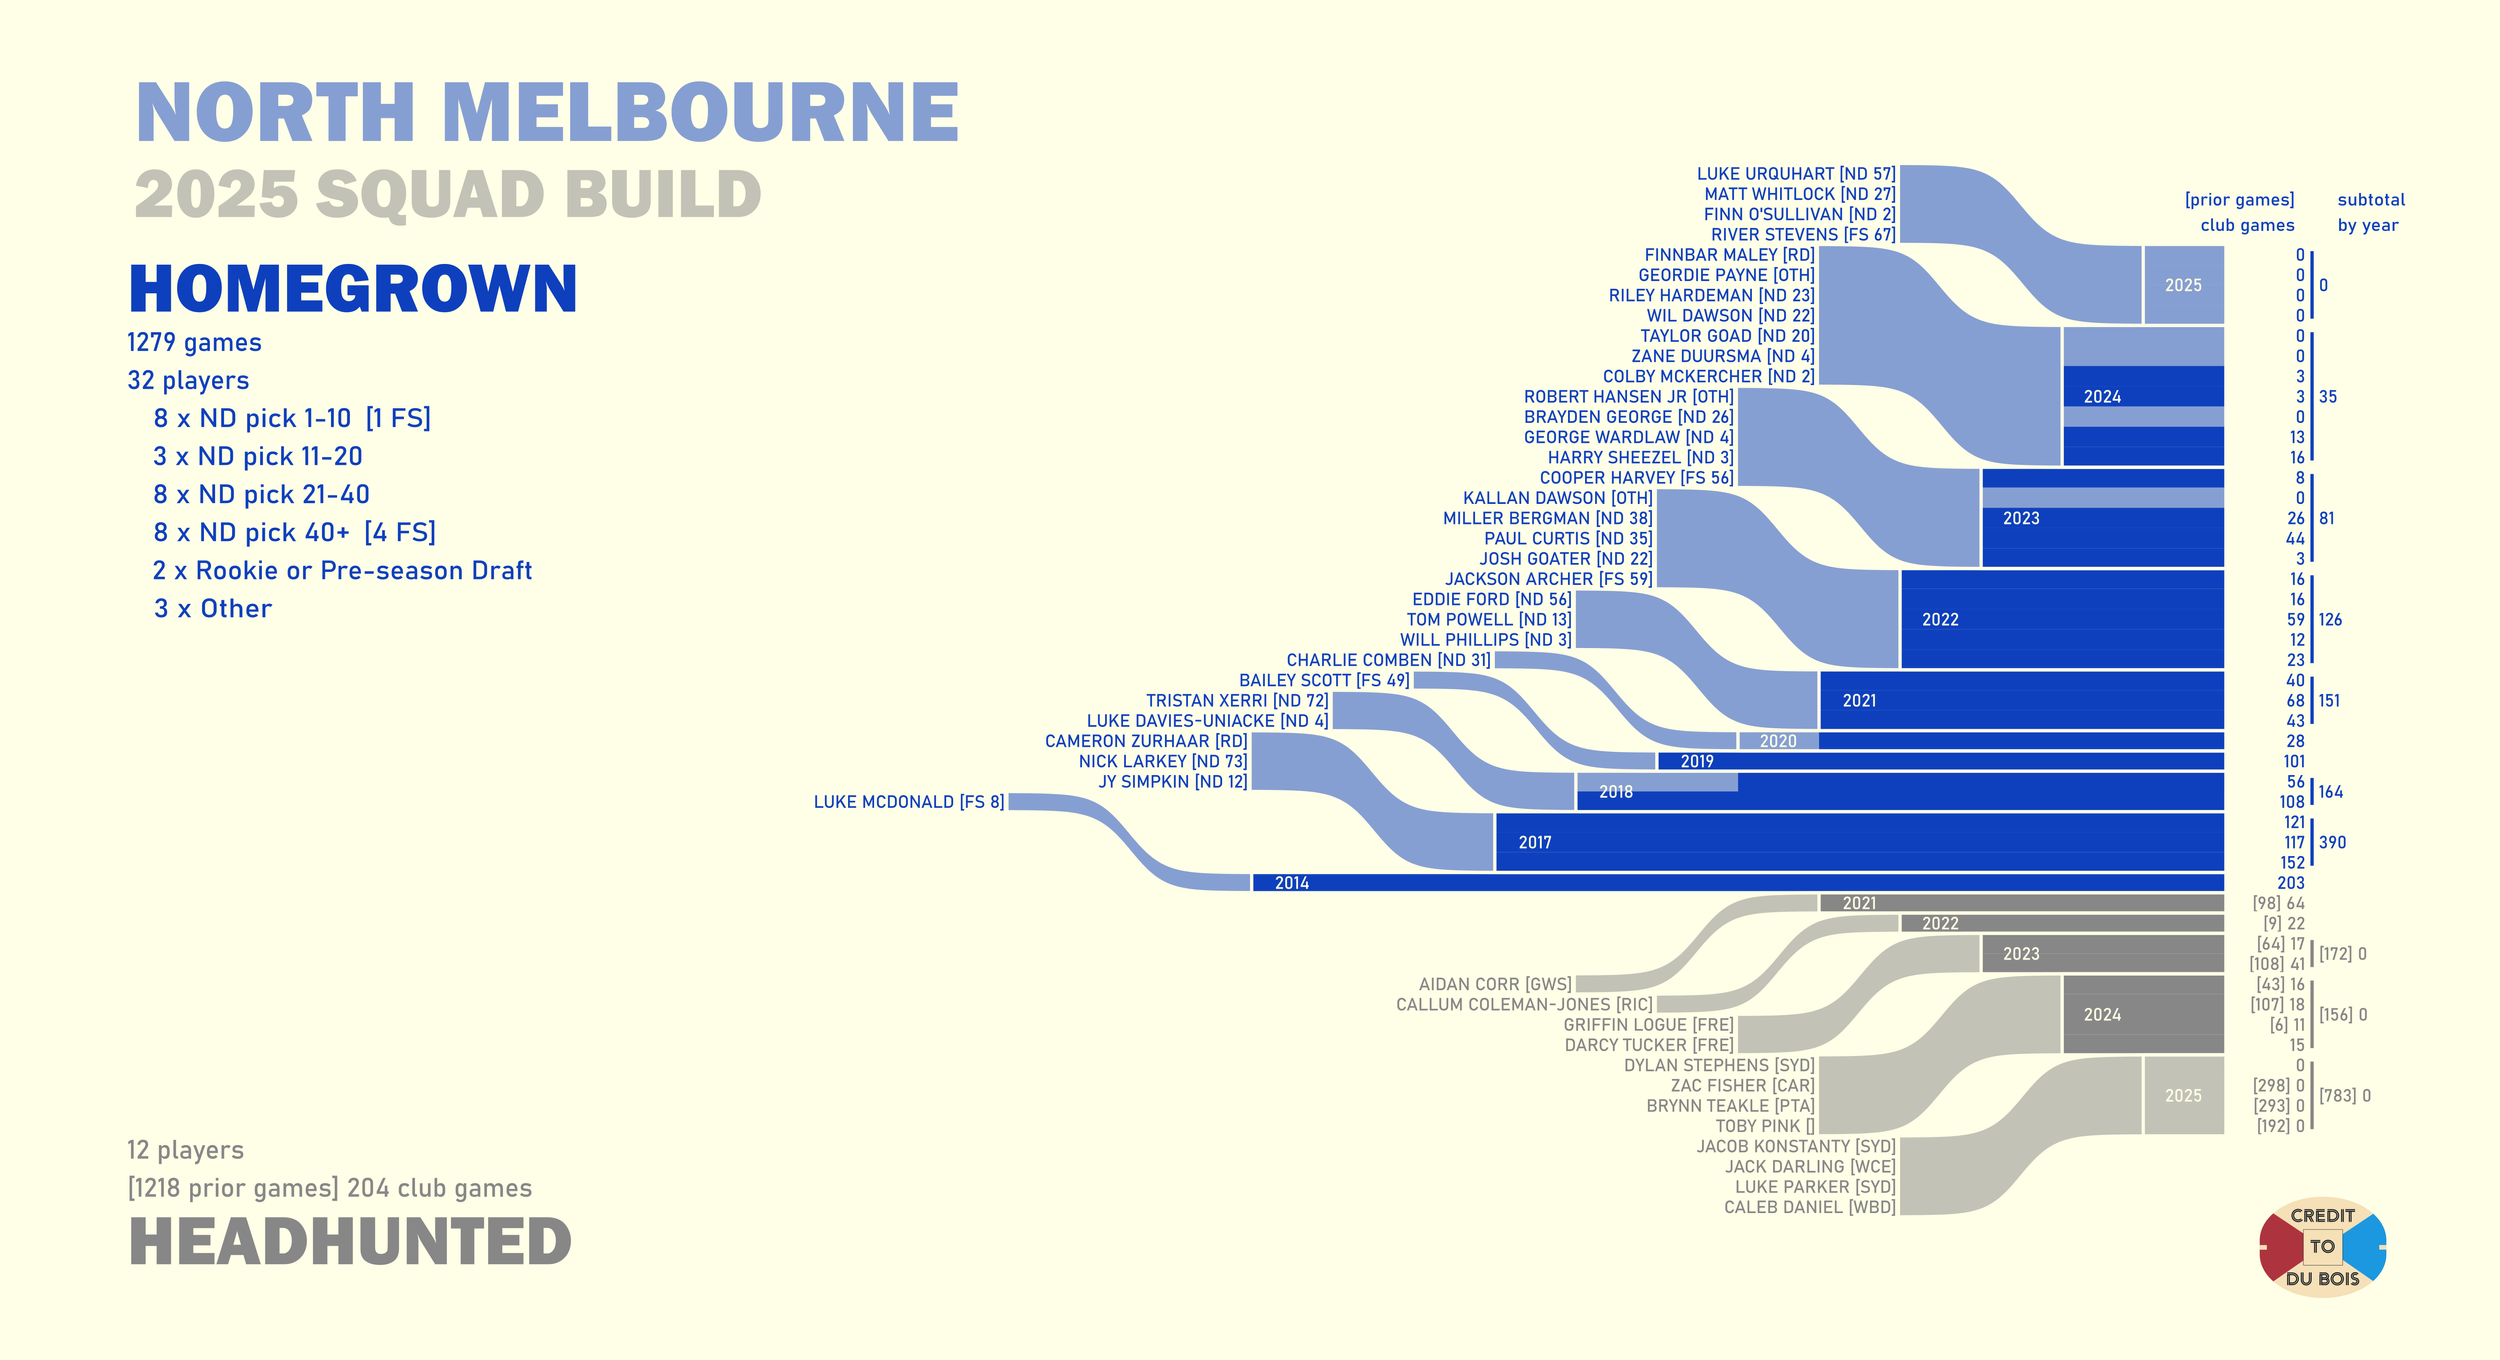
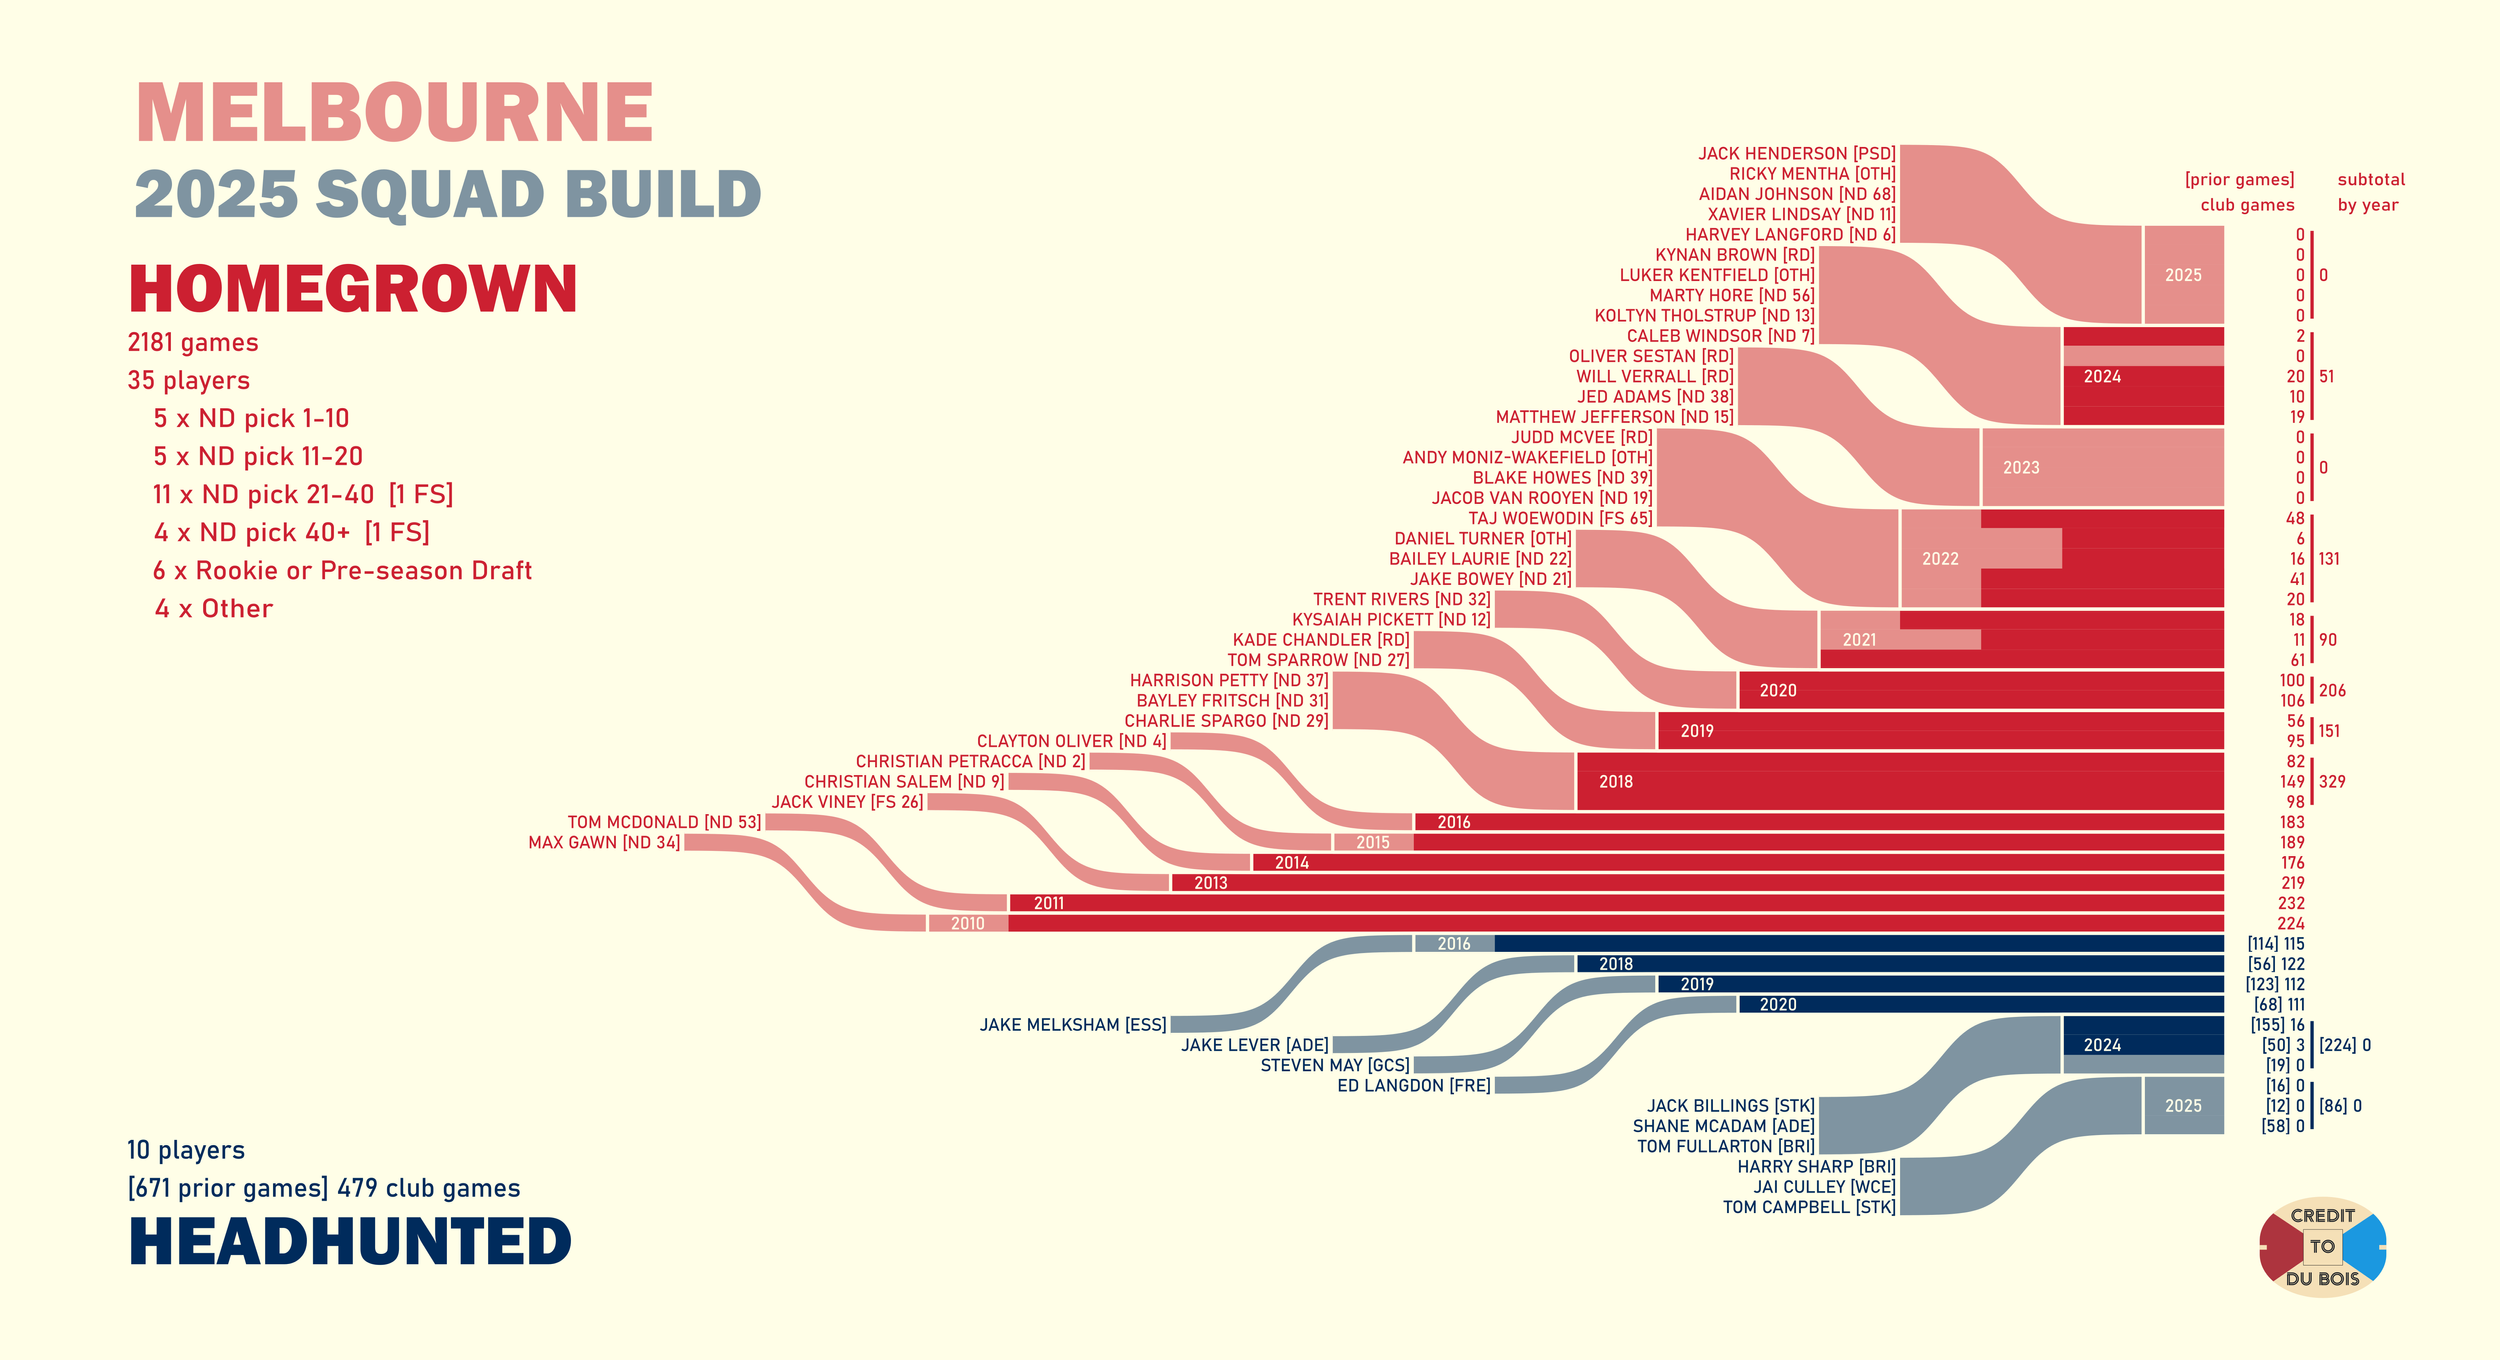
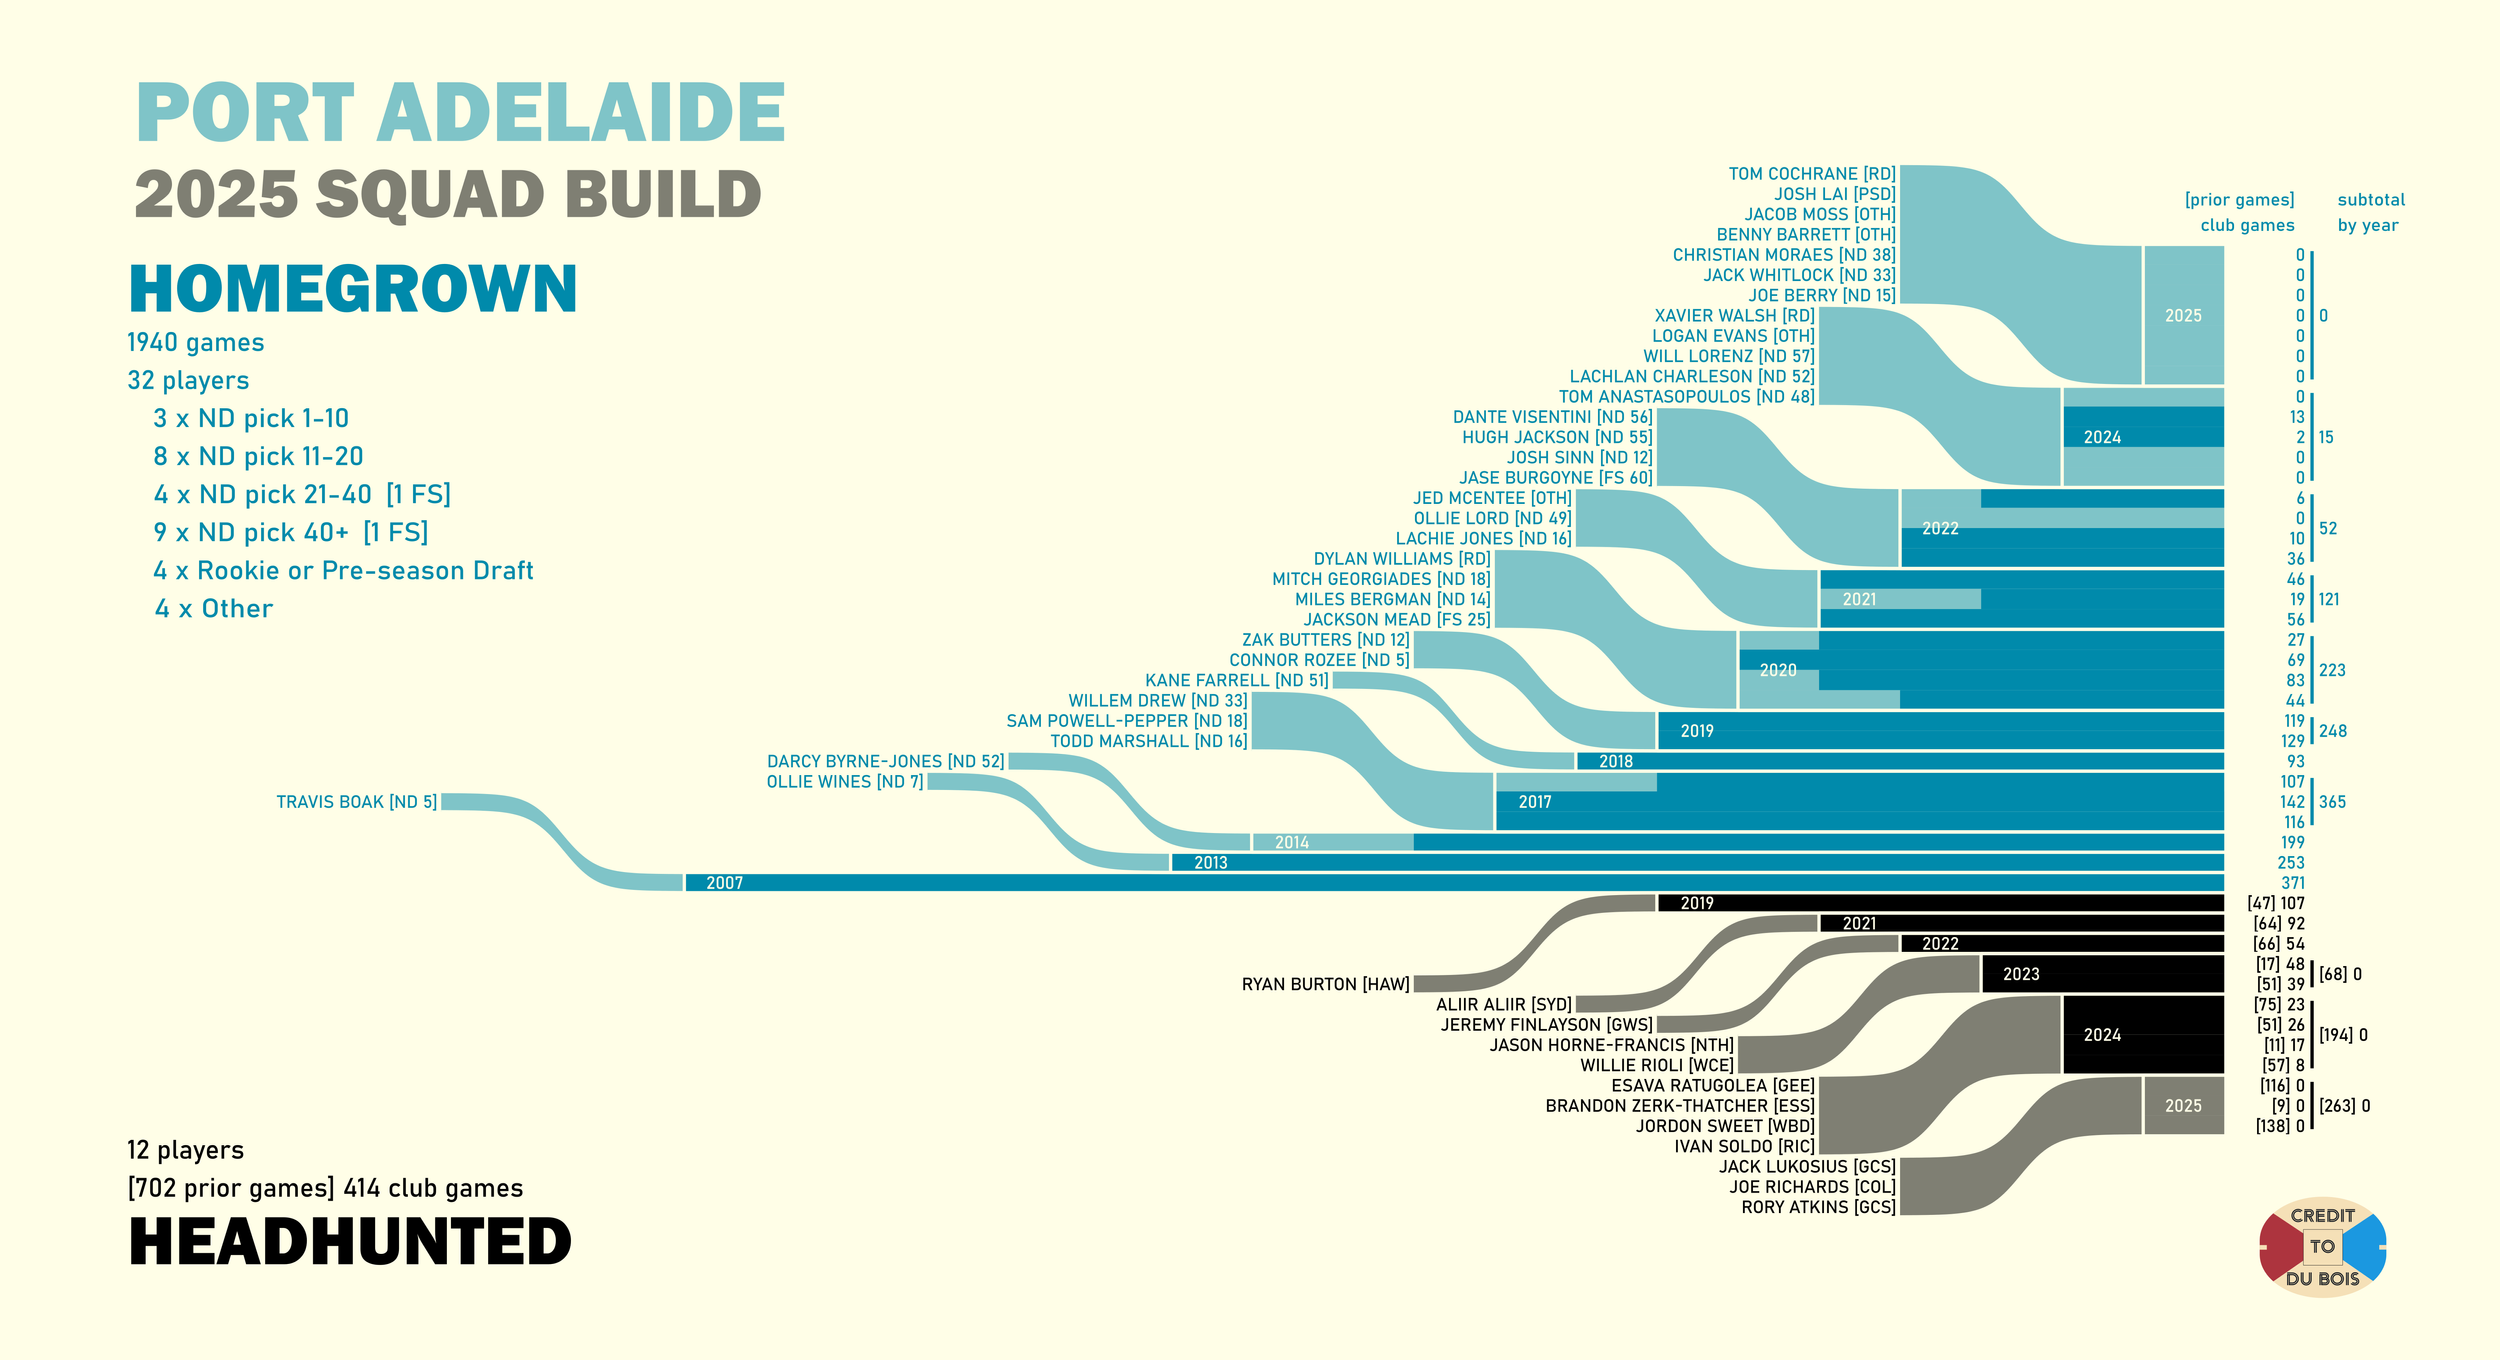
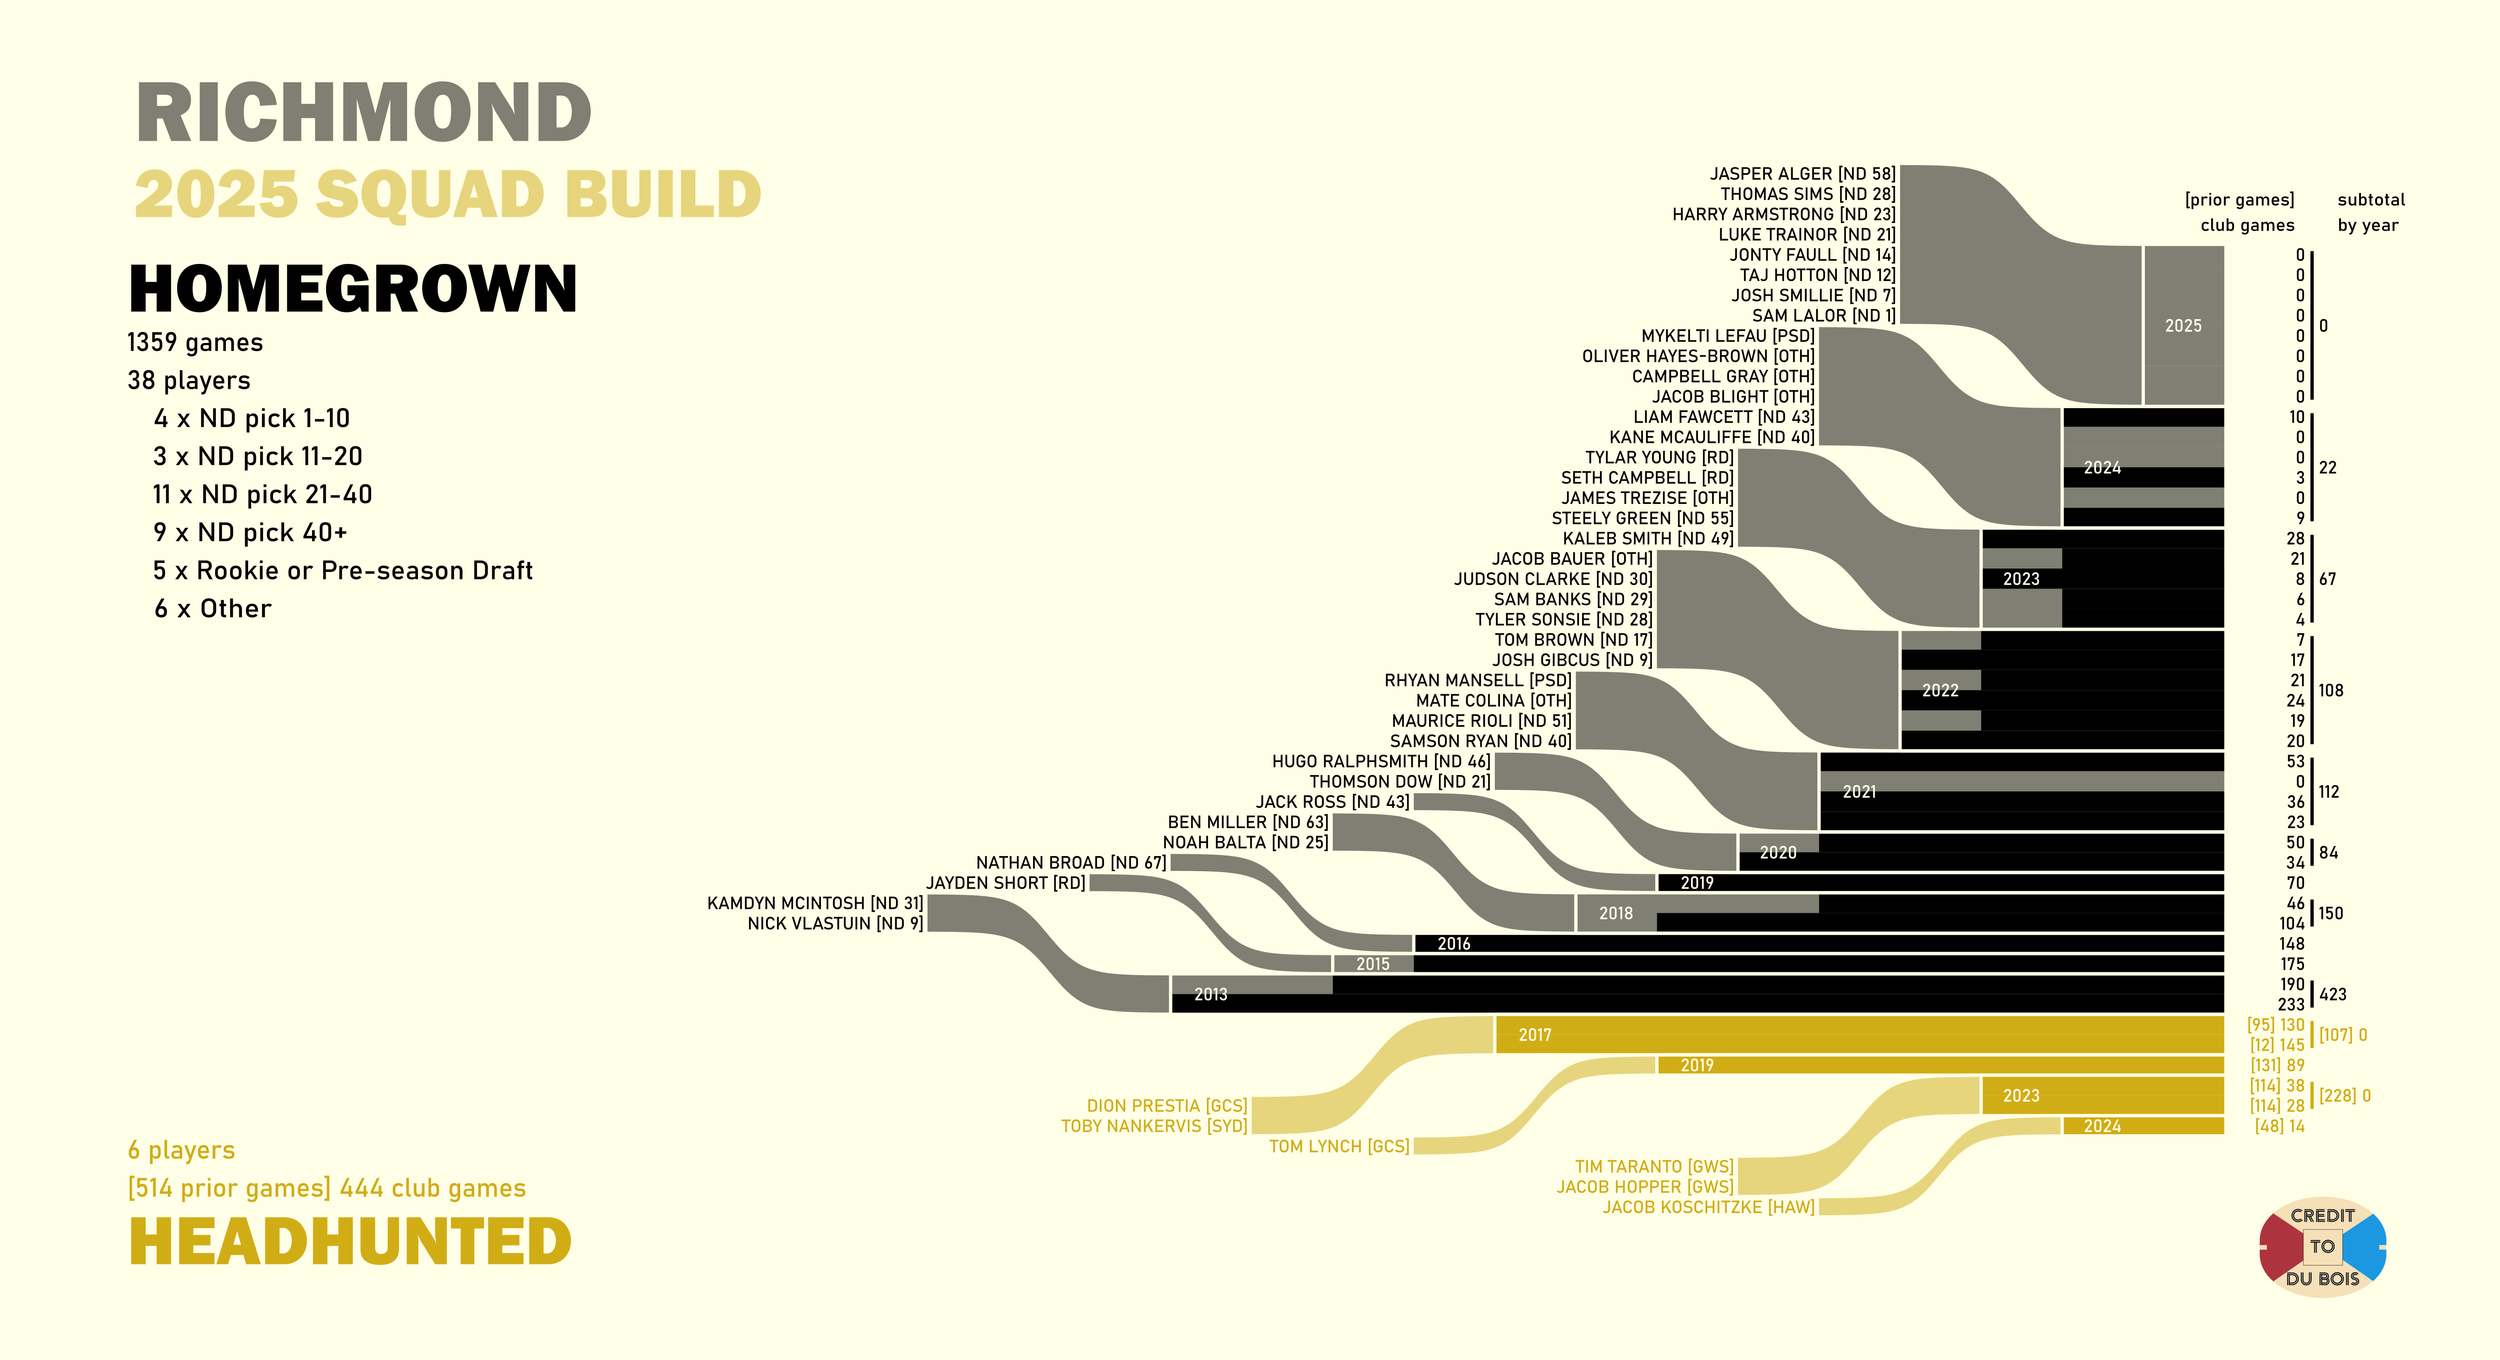
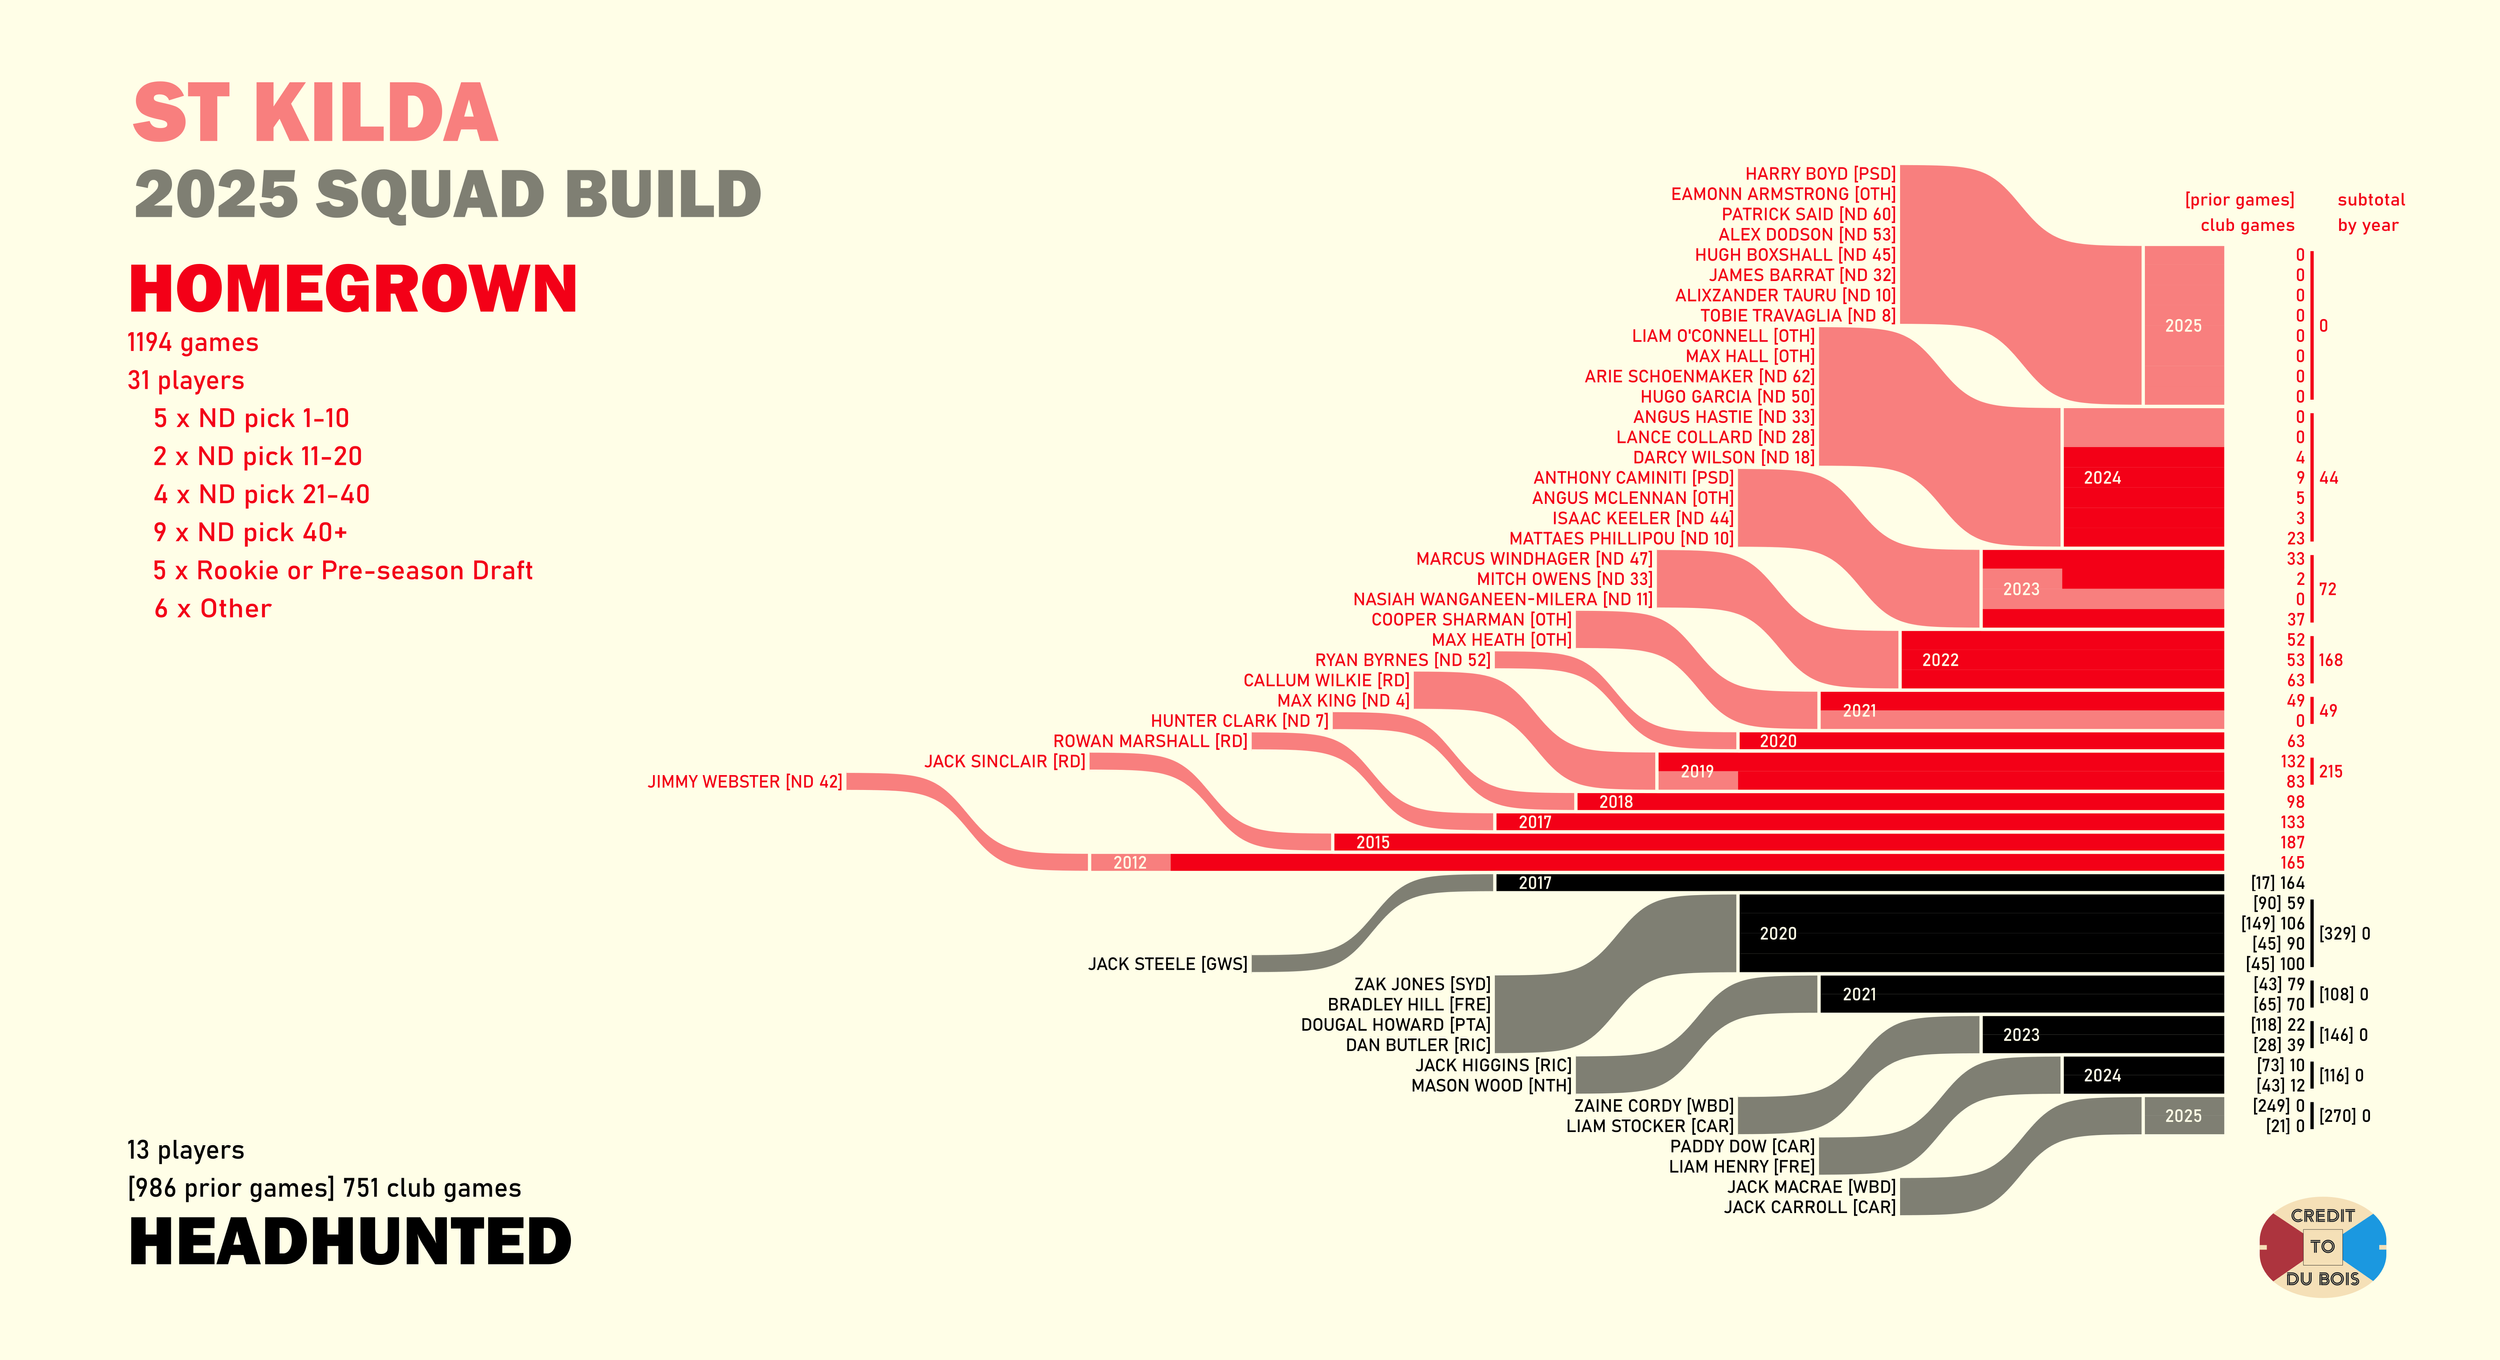
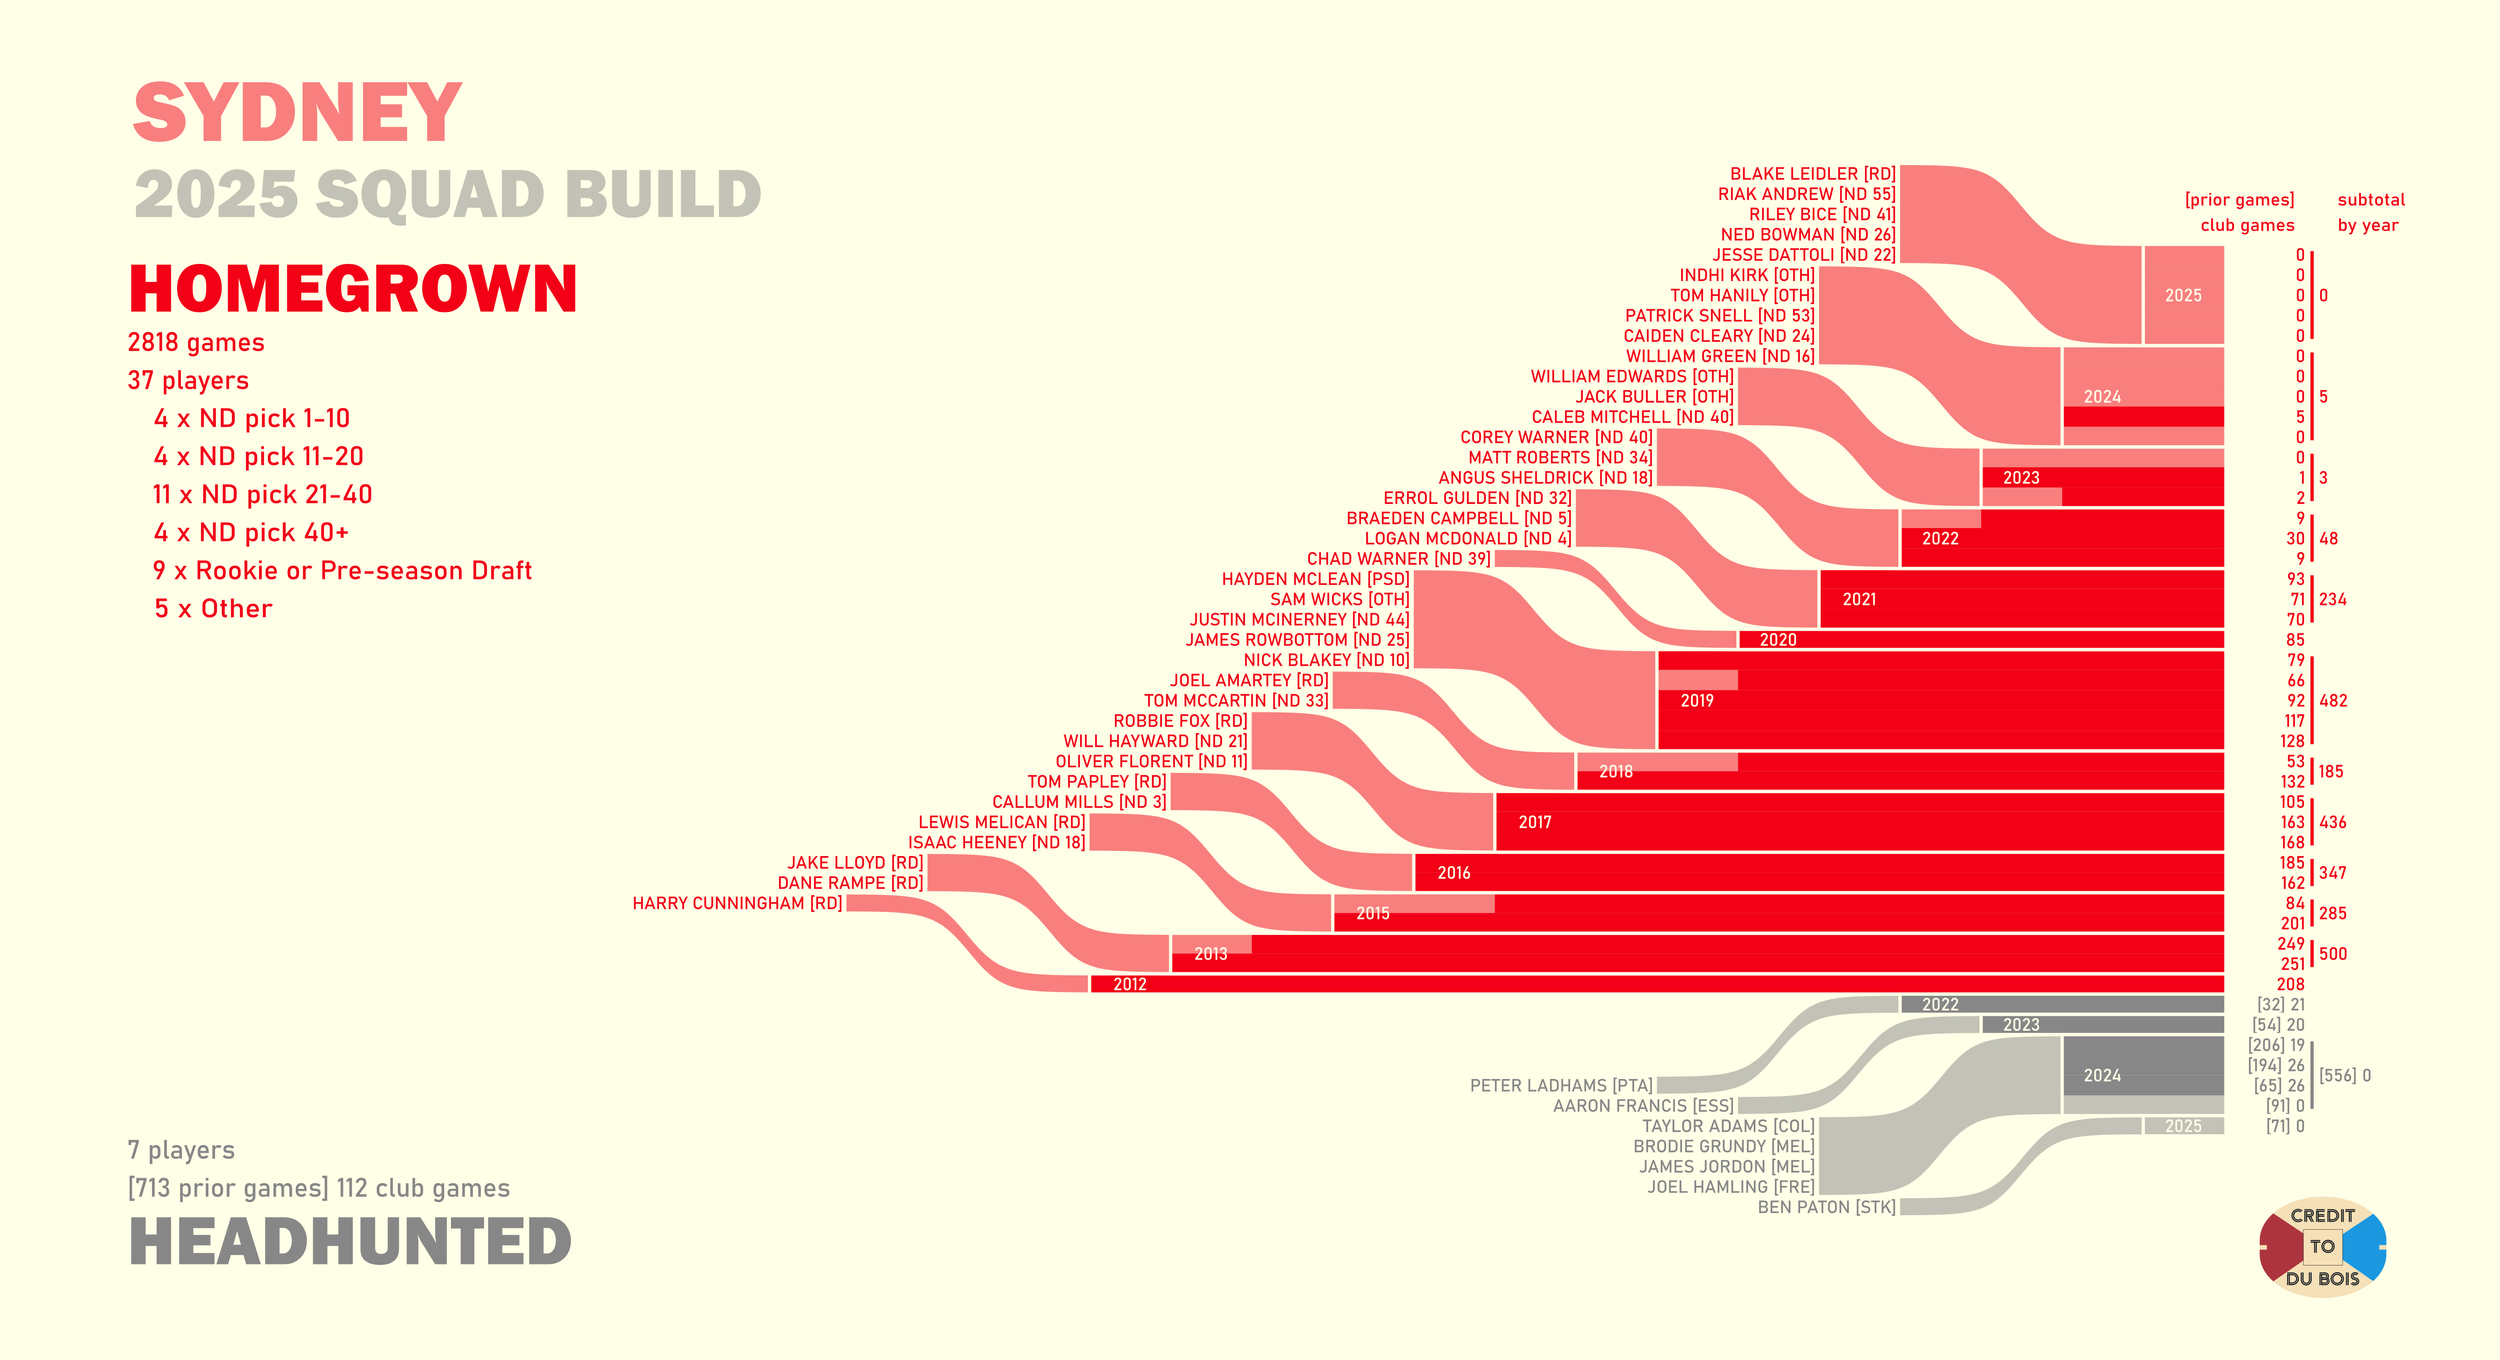
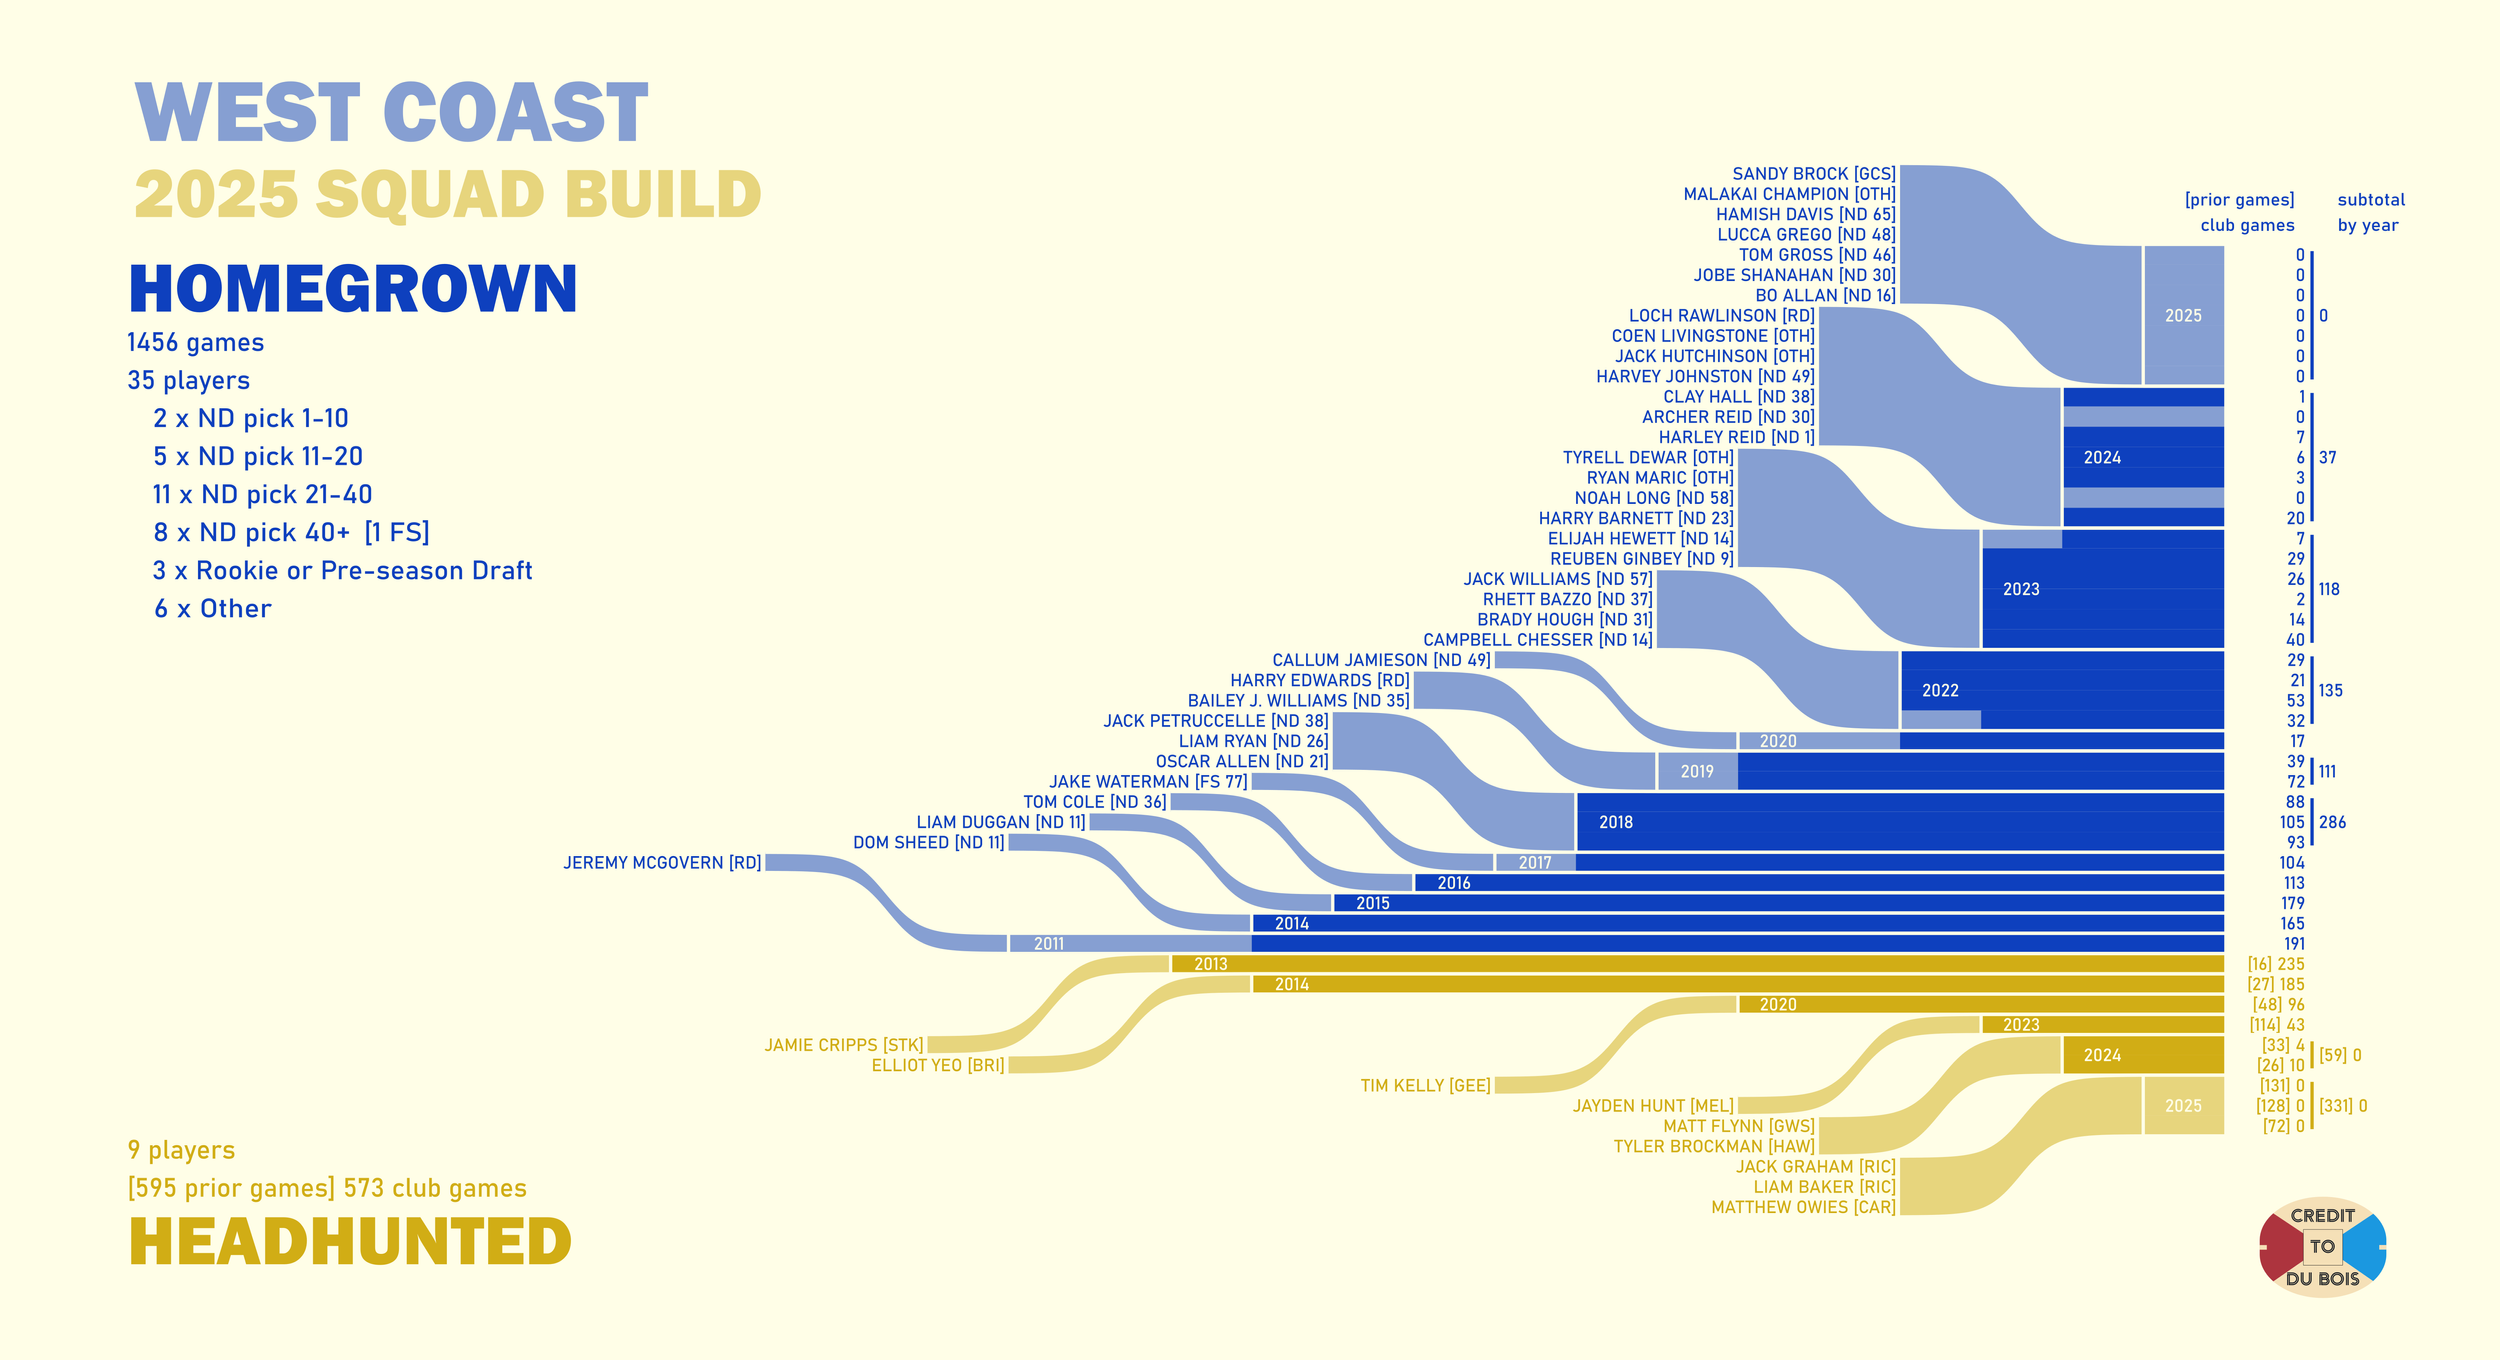
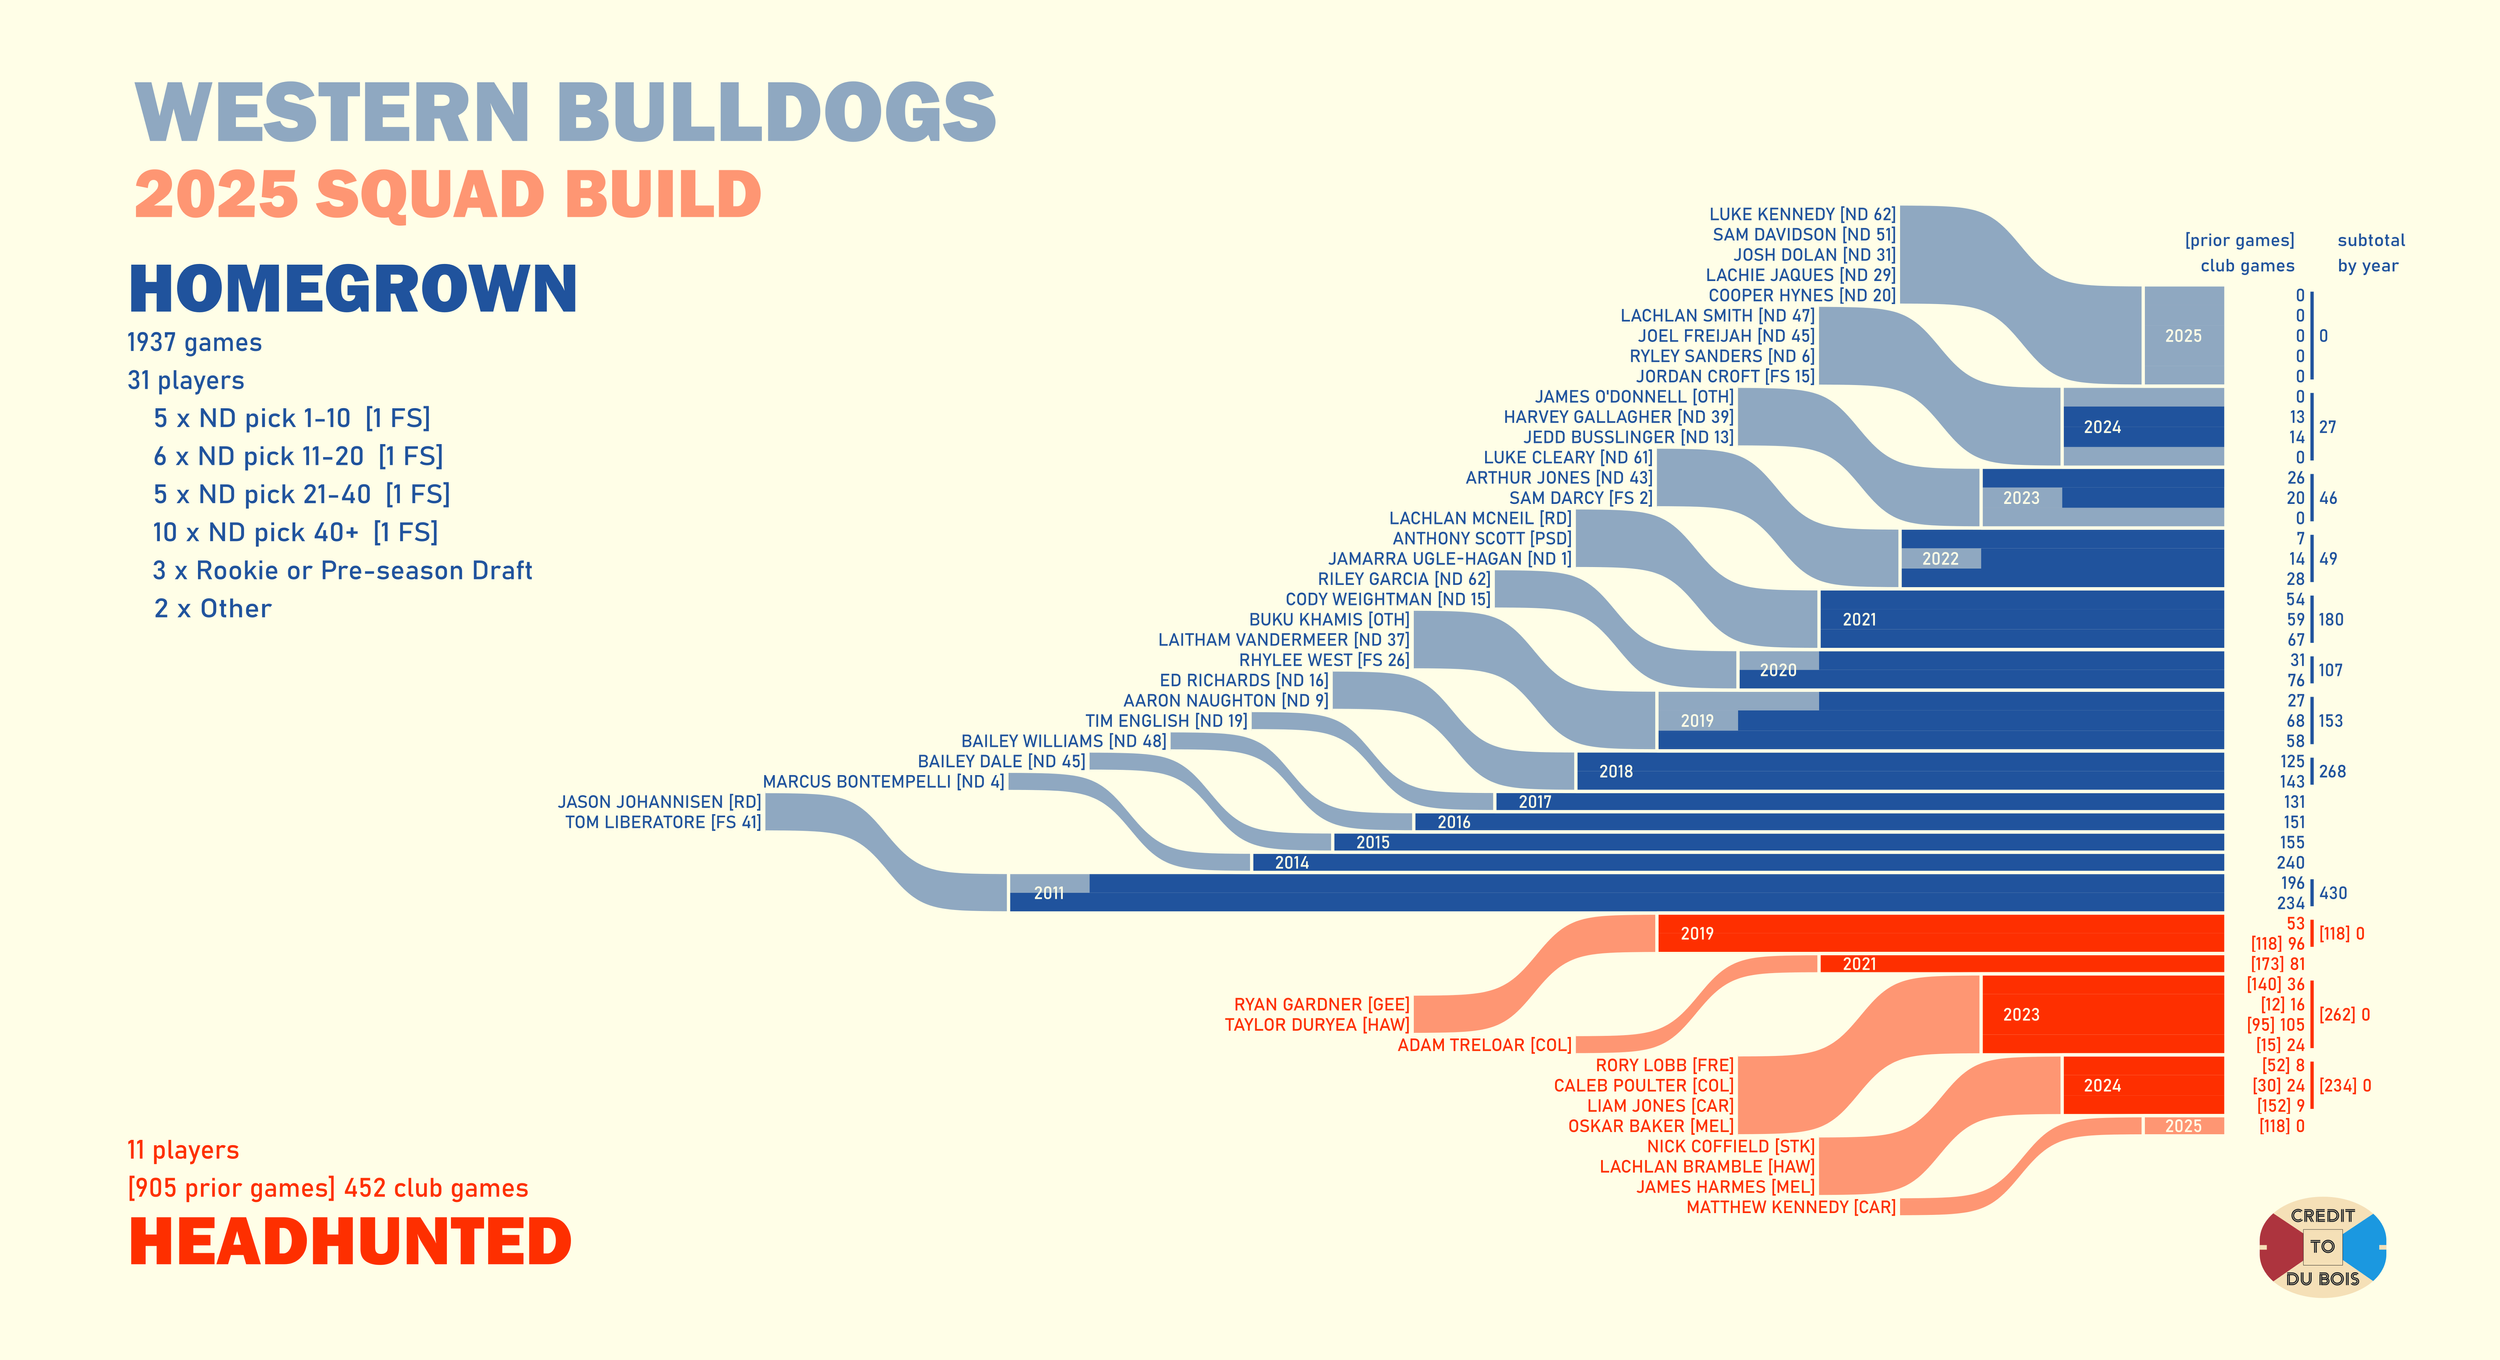
Here’s a display of how each men’s squad was assembled for 2025 – through the draft or through trades and free agency.
The criteria I’ve applied is a homegrown player is one who entered the AFL environment through their current club, whereas a headhunted player was on someone else’s list. Players are shaded a lighter colour until their club debut year.
Game totals should reflect to the end of 2024. With several hundred players I haven’t checked through each individually, so if you notice someone is incorrect (particularly bigger things like missing debutants) yell at me on bluesky about it (link in the banner).
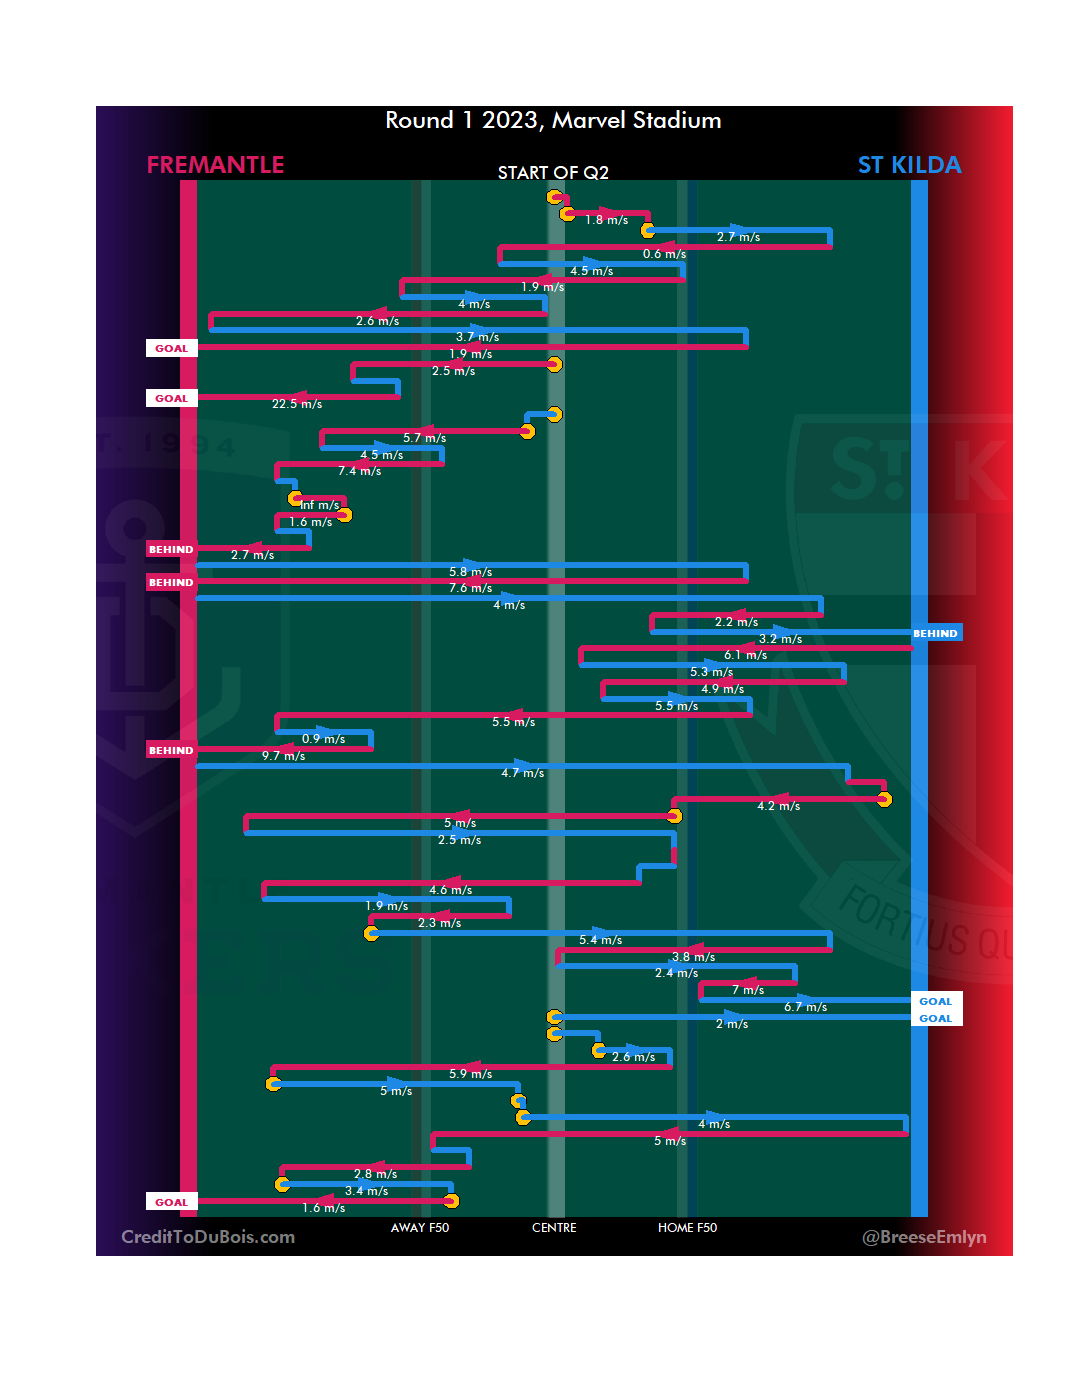
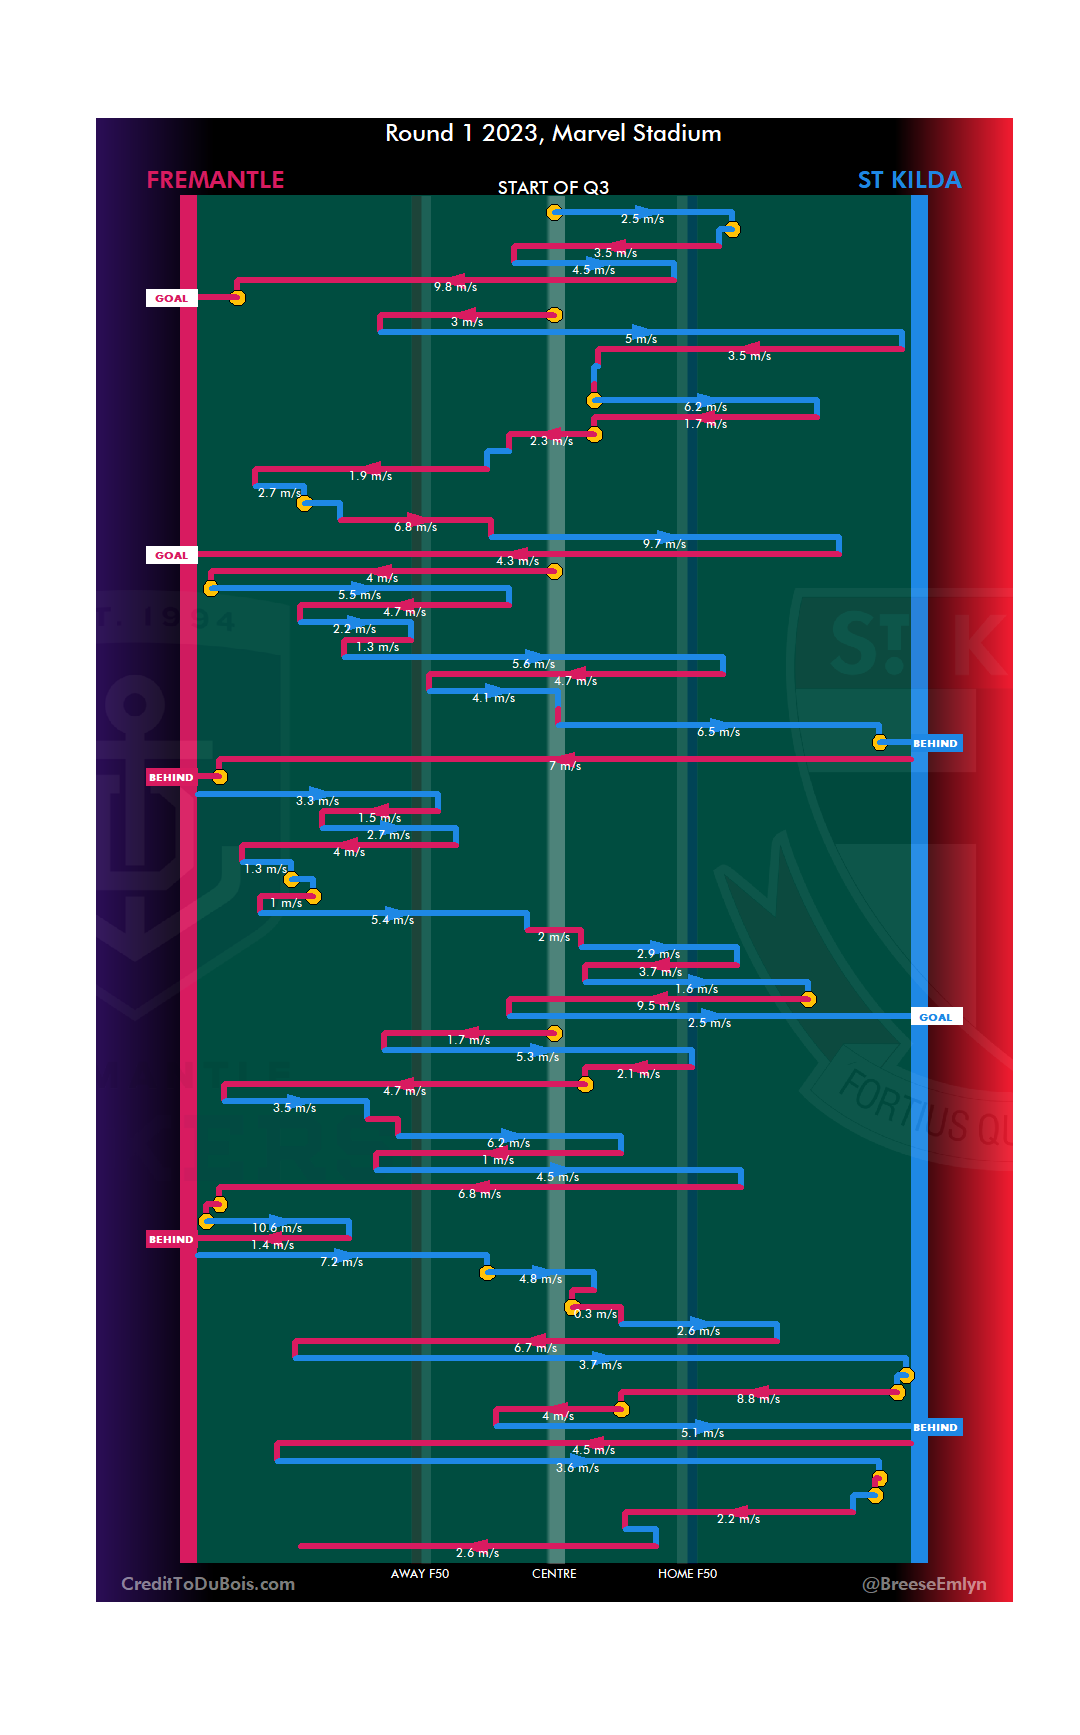
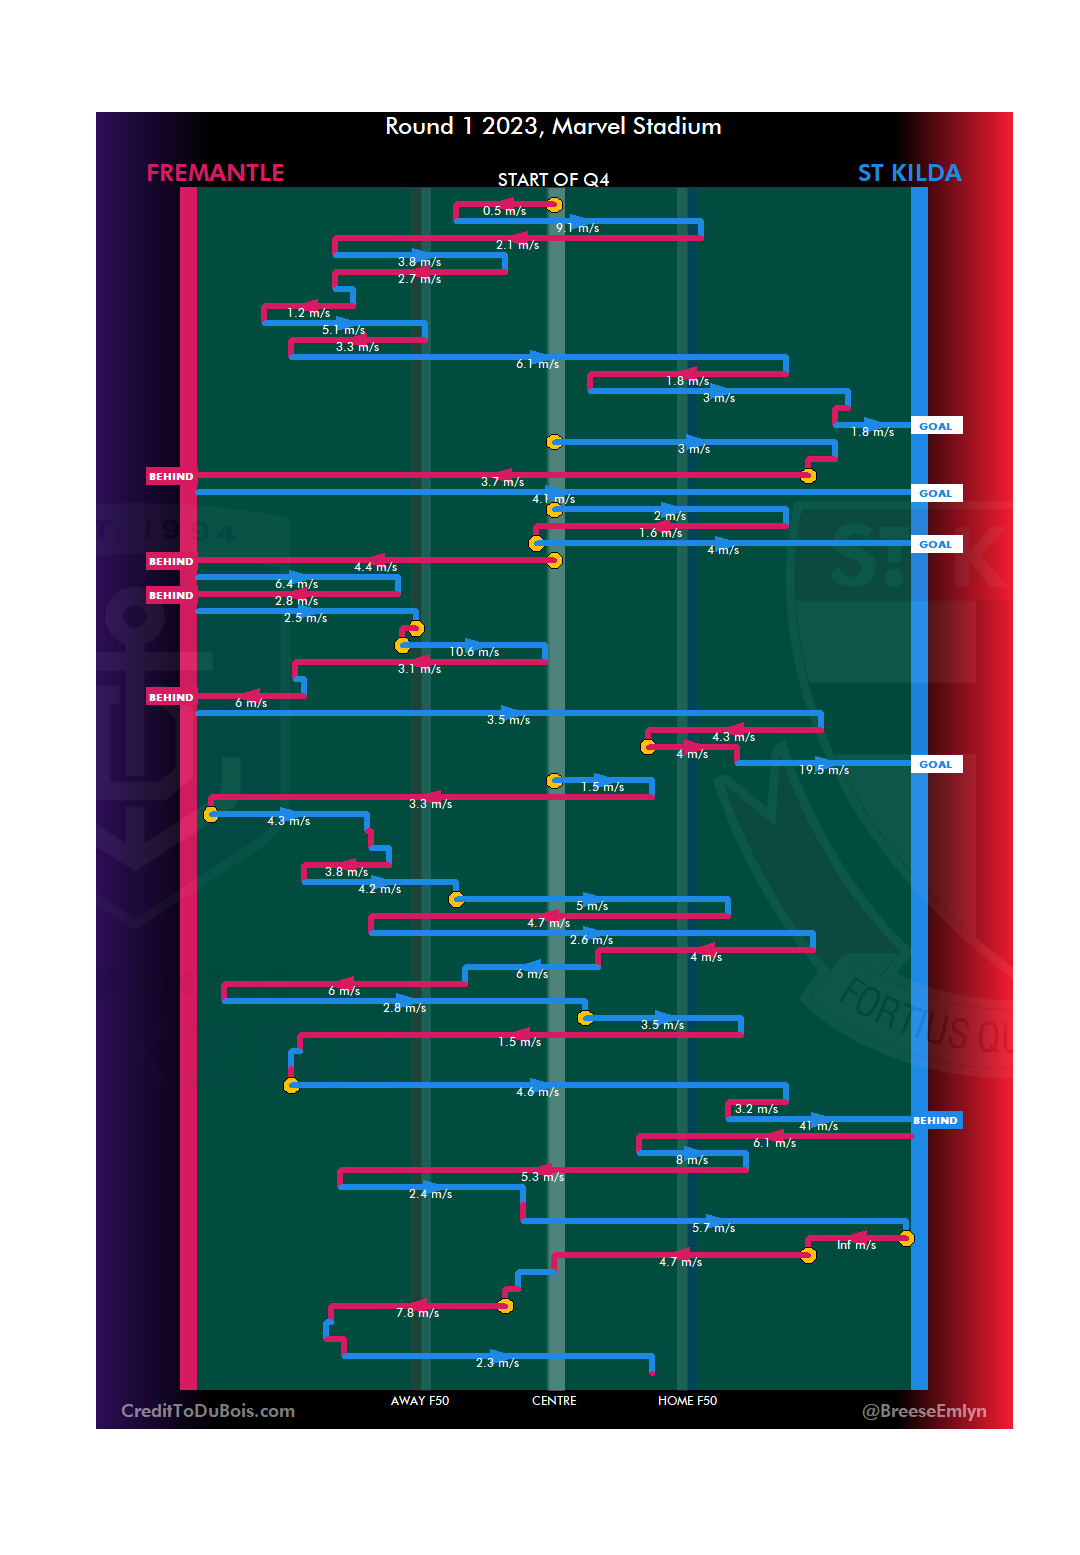
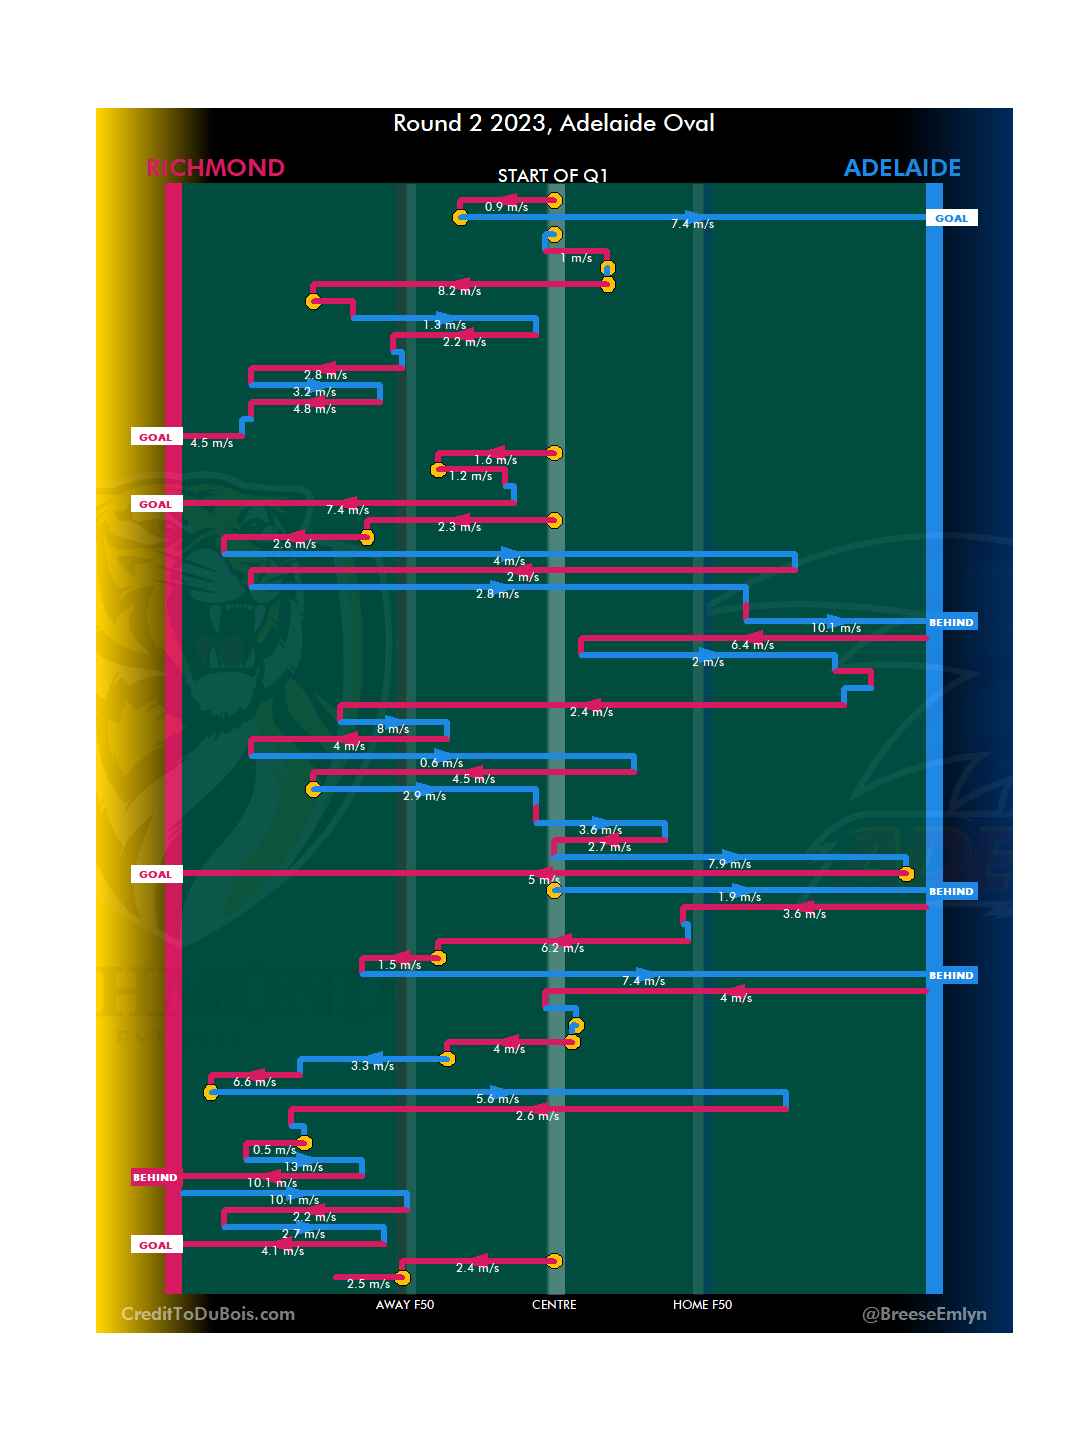
What better way to kick off a new column than having a niche axe to grind?
It happens numerous times each season, I’ve already caught a few this year, but every time it’s like fingernails on a chalkboard to me.
An expert commentator says something to the effect of “he won’t get a stat for that” in reference to something that is categorically recorded as a stat and has been for over a decade.
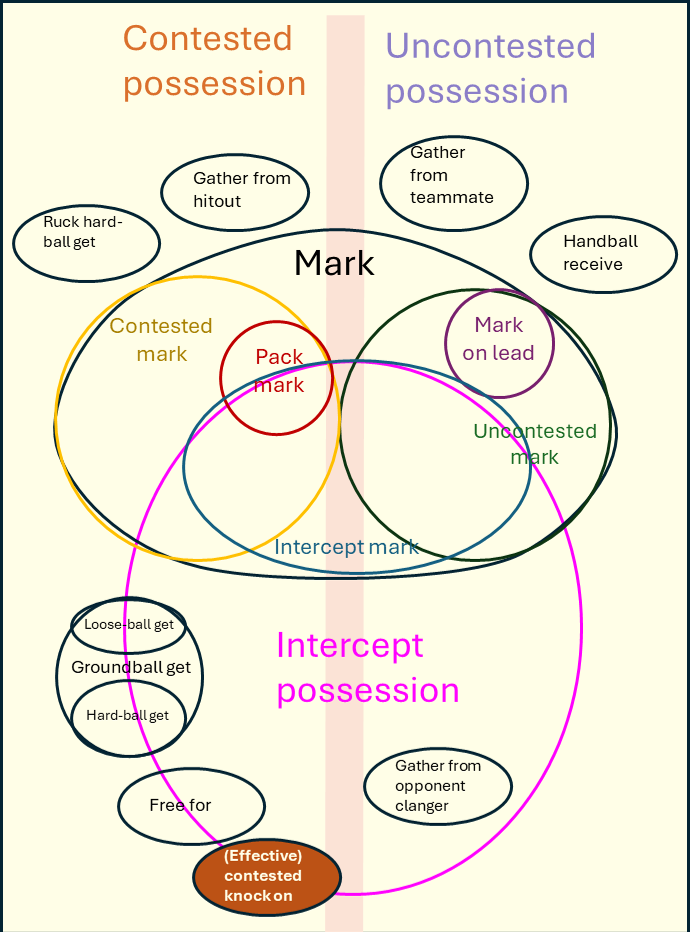
> “Knock on: When a player uses his hand to knock the ball to a teammate’s advantage rather than attempting to take possession within his team’s chain of play.”
— Tom Wills, probably?
Knock ons can also be recorded as contested. Effective contested knock ons are also included in a player’s possession count, as demonstrated in the below venn diagram I prepared earlier (frankly, I don’t see what the confusion over the definition of possessions is, it all seems perfectly clear to me).
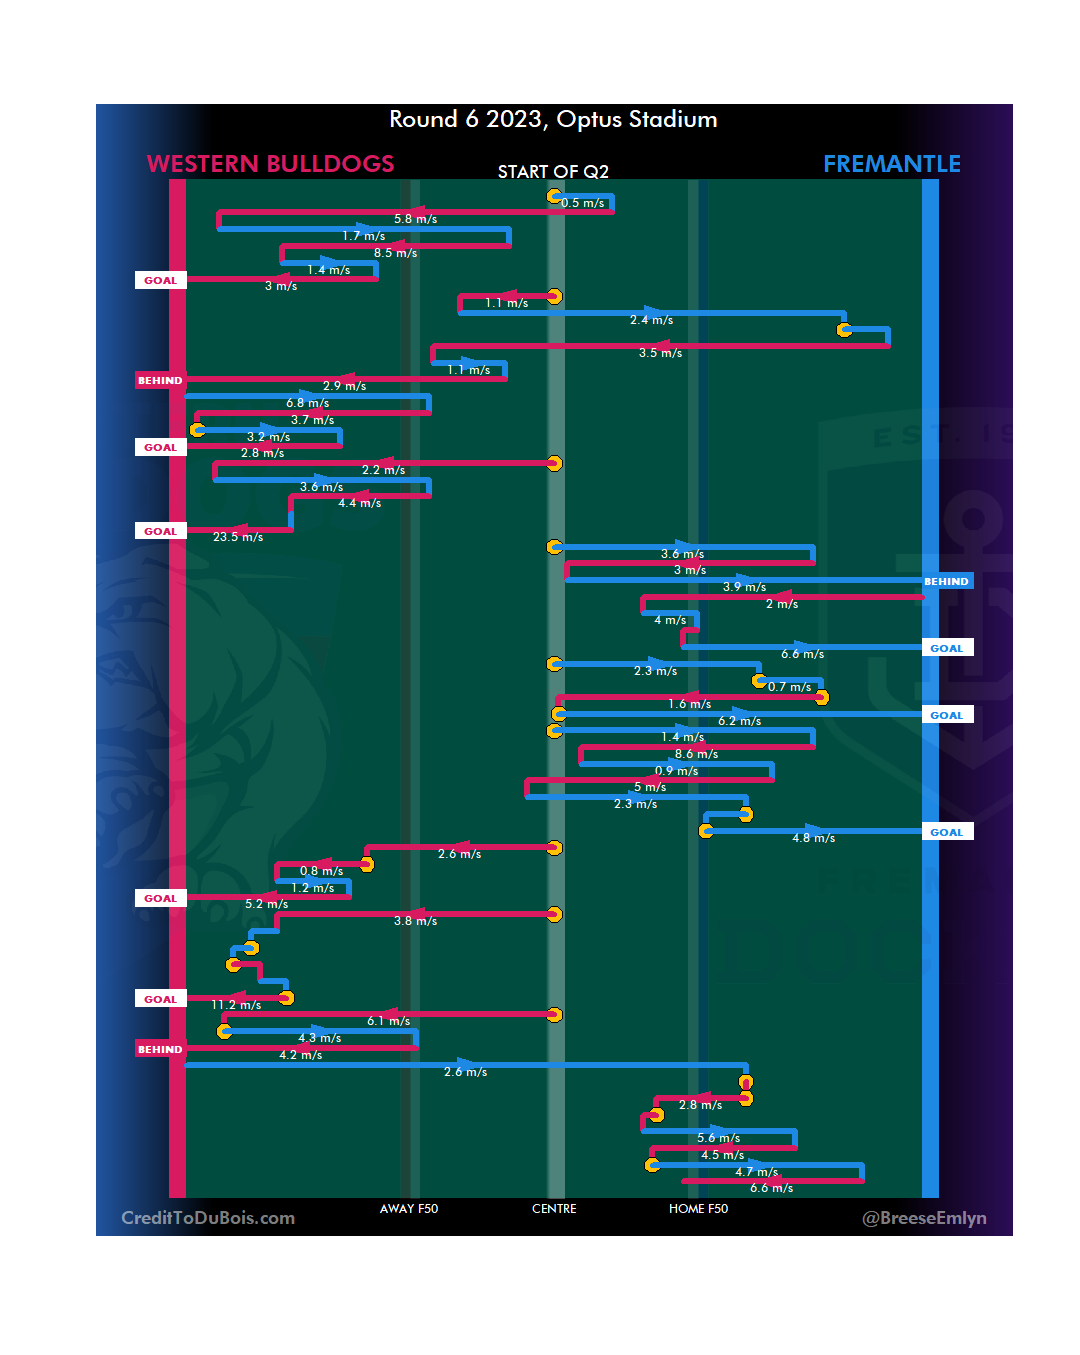
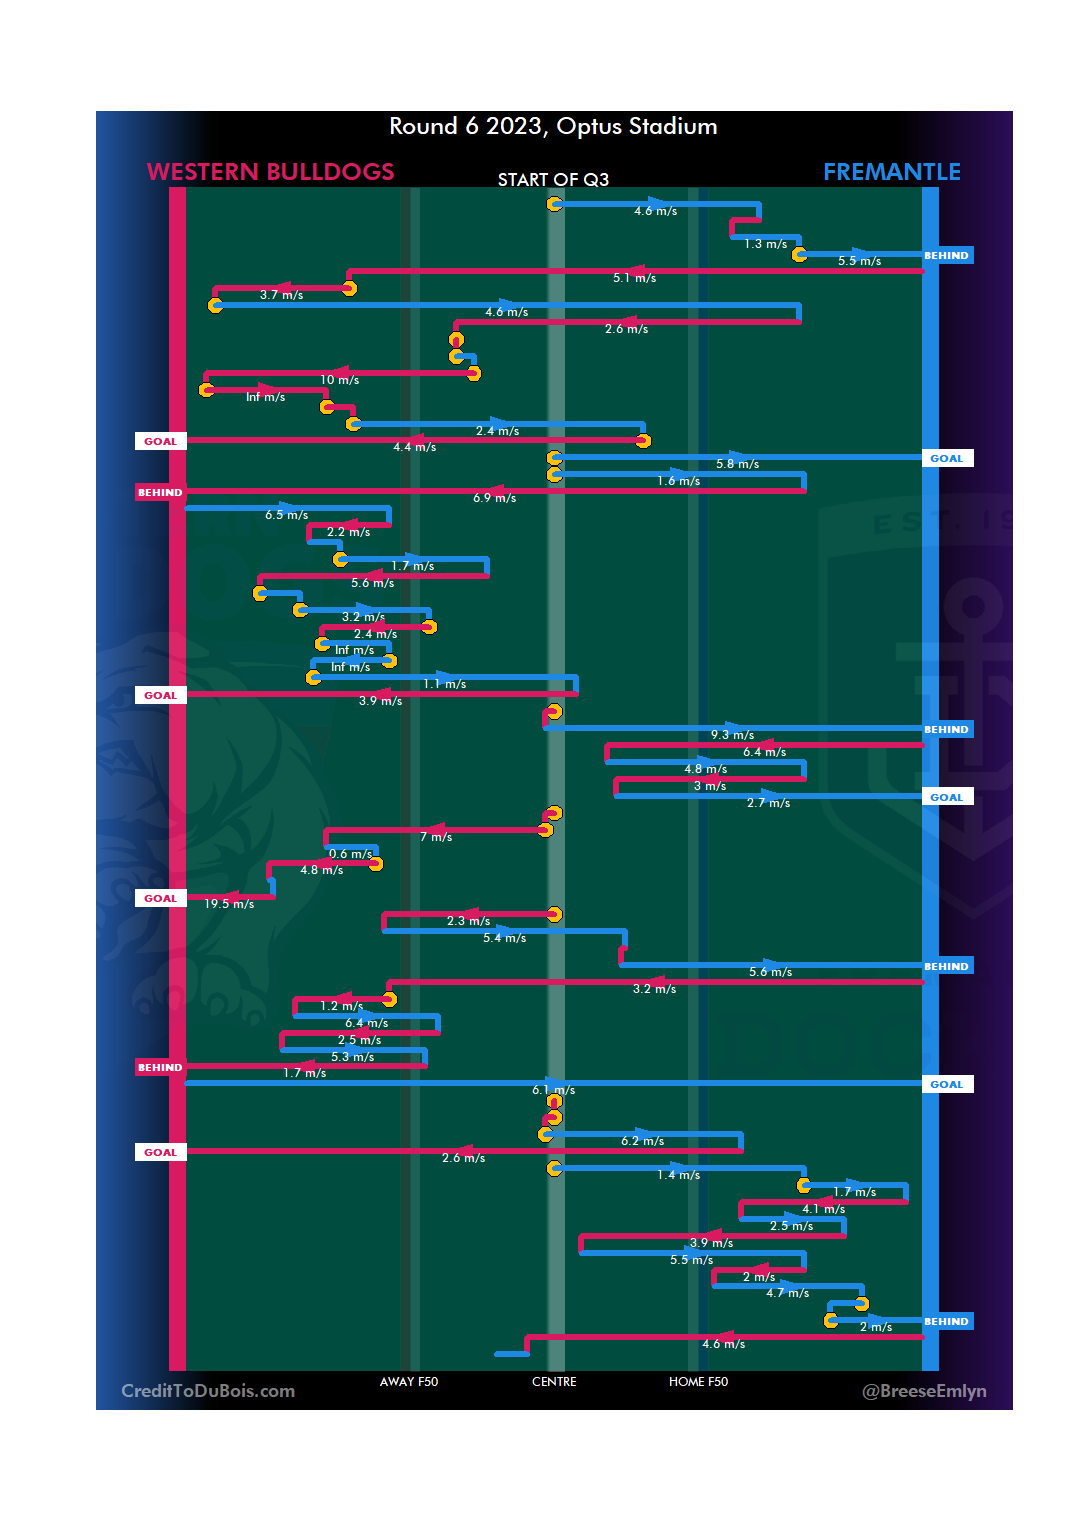
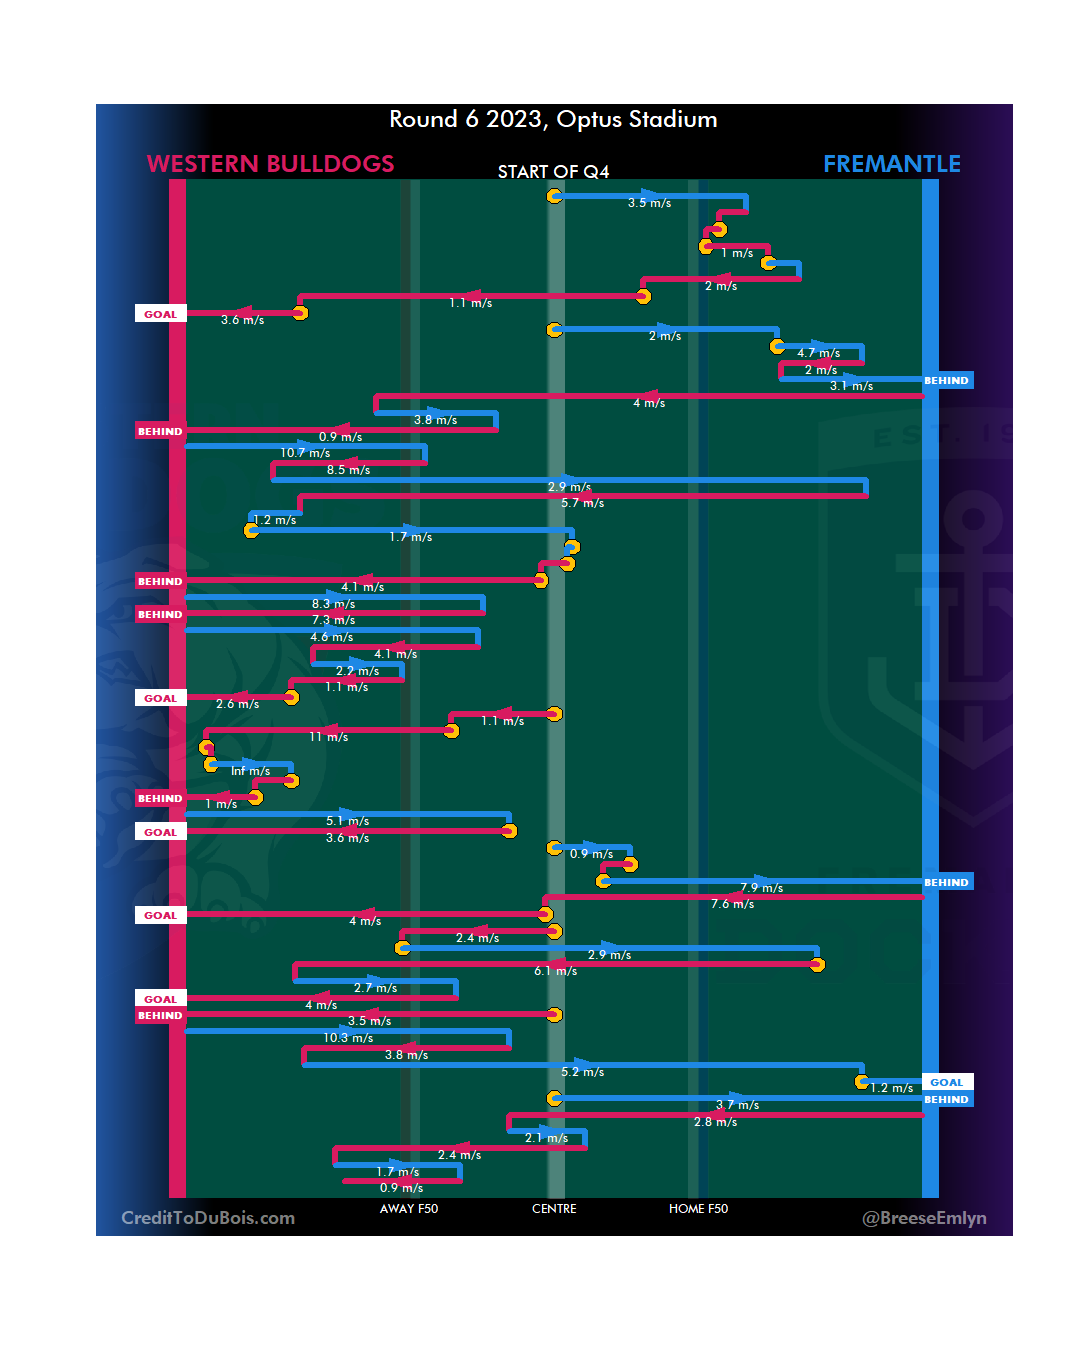
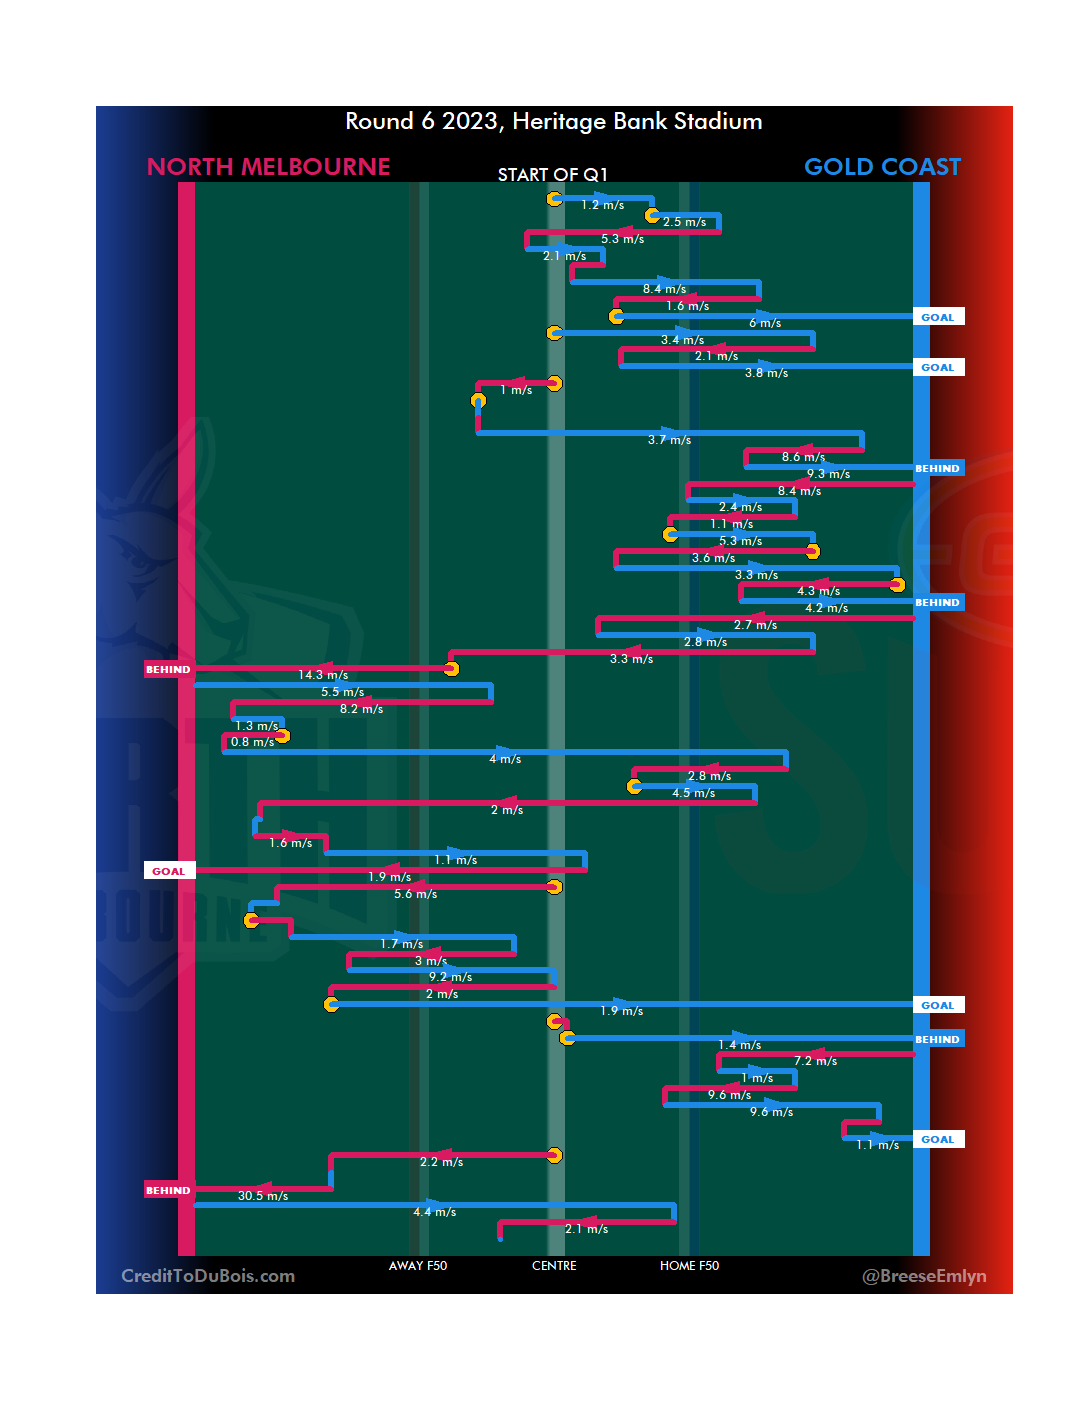
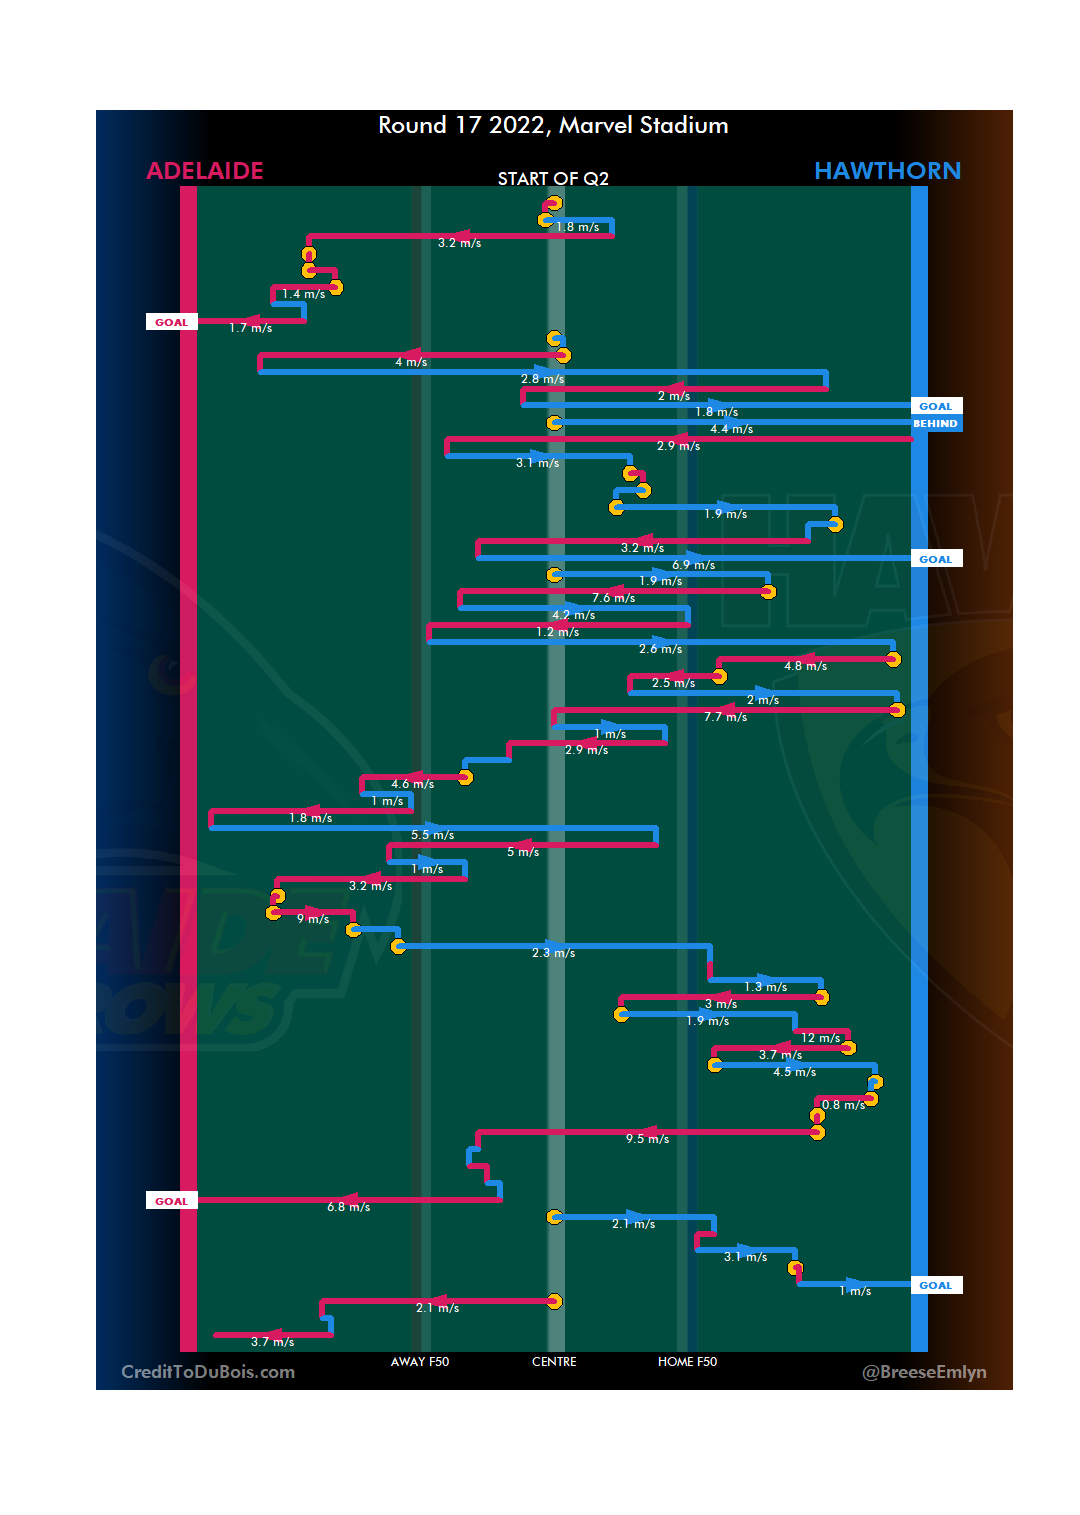
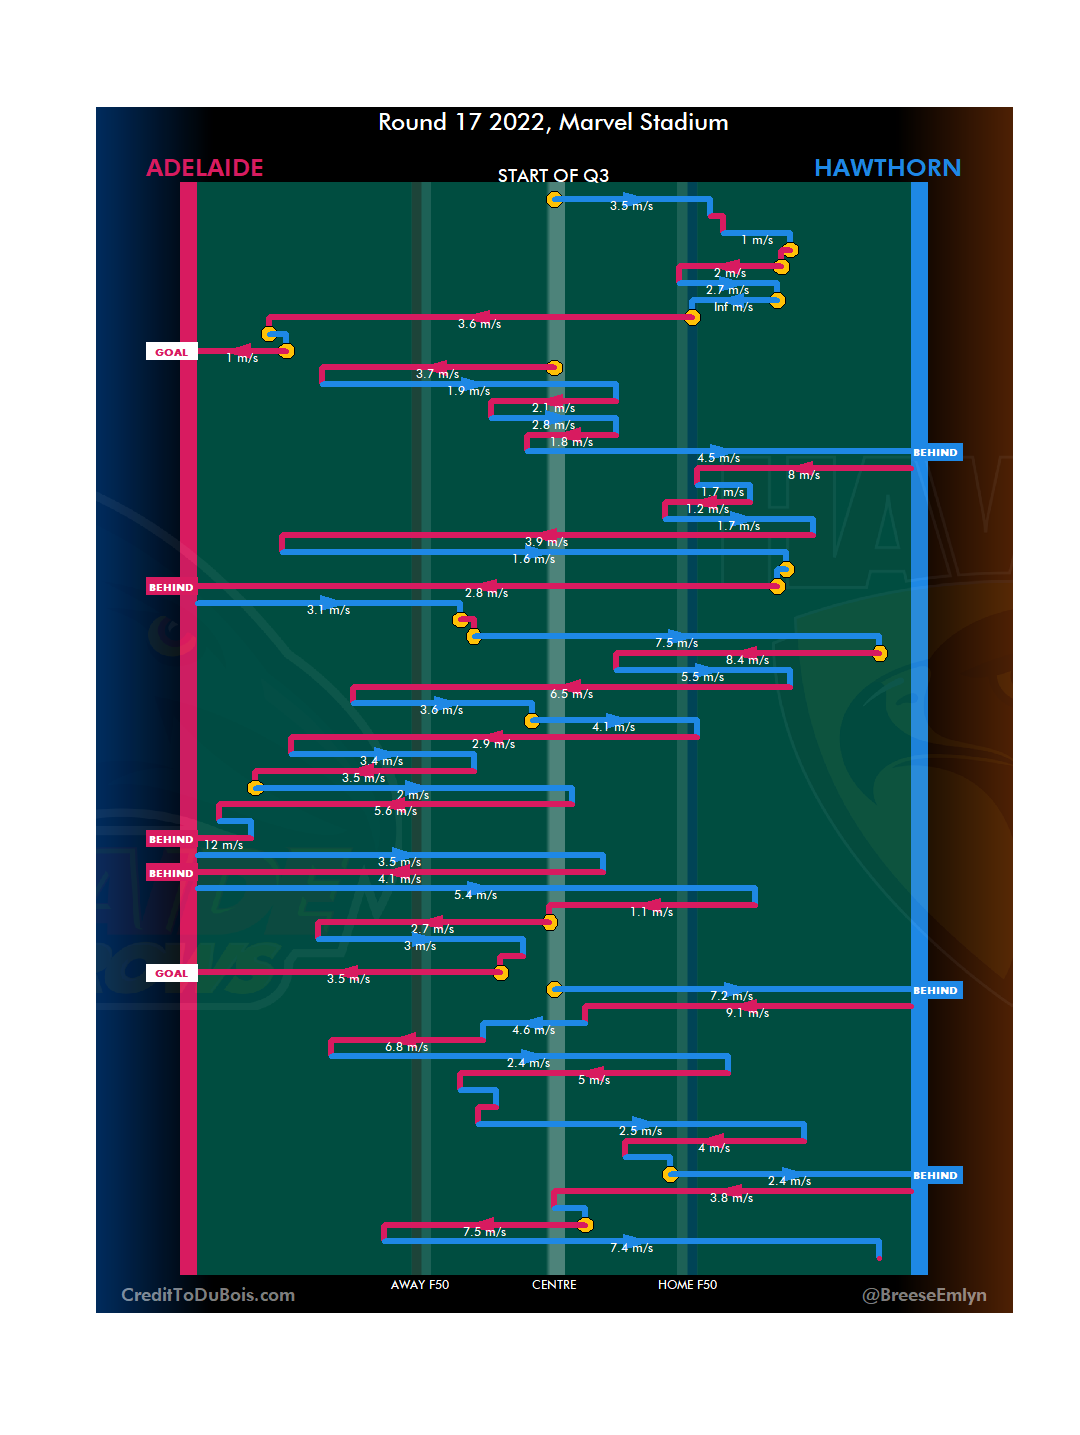
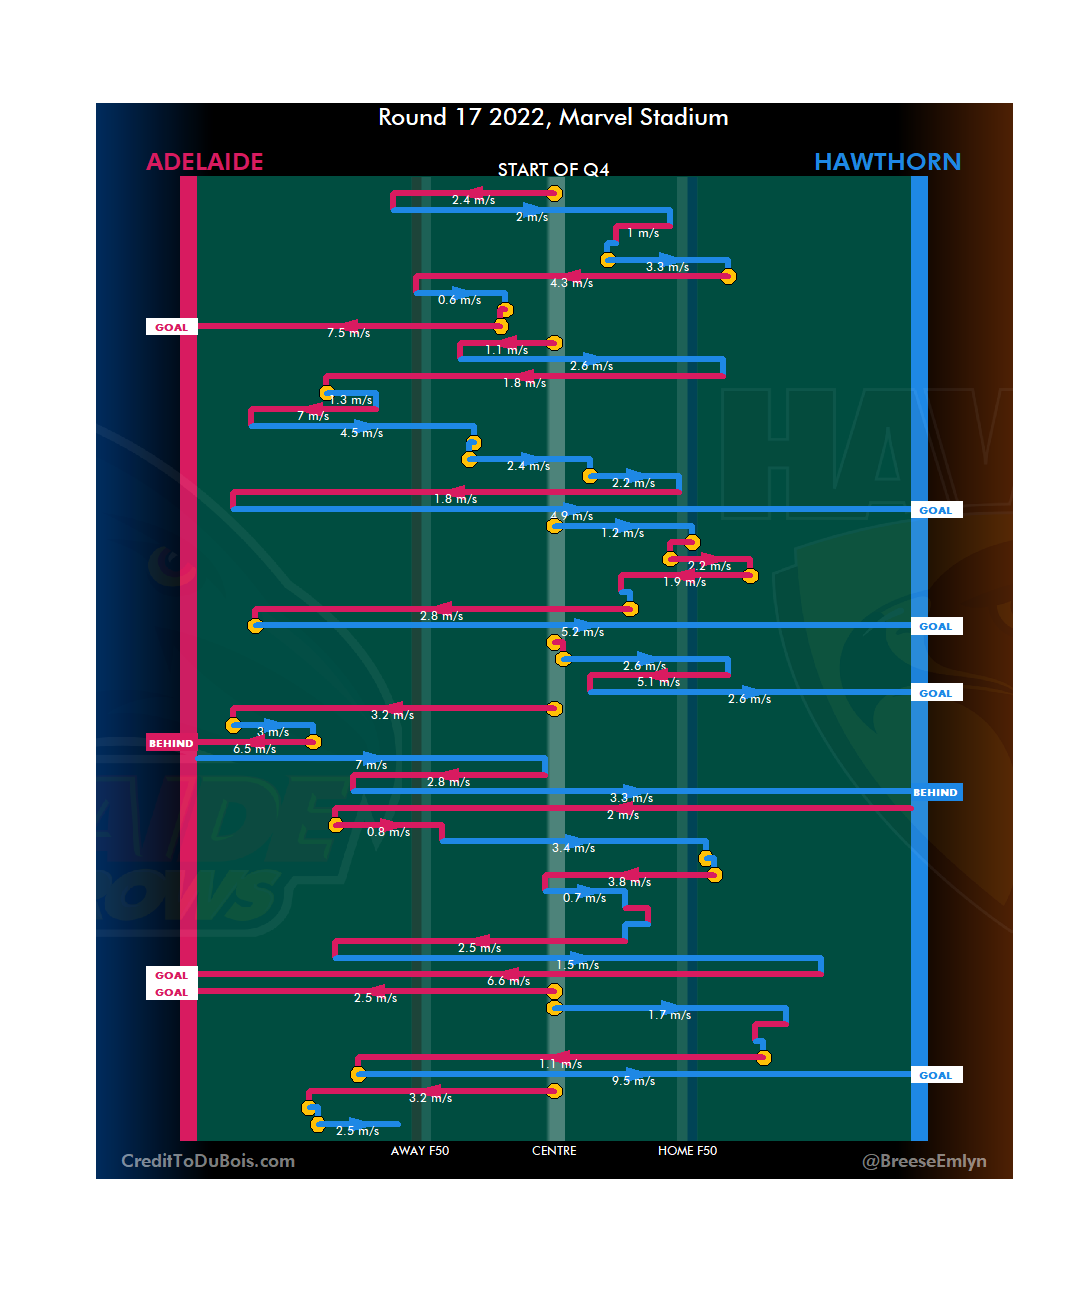
What to do with our newfound knowledge of knock ons and their statistical validity? I’m going to make a completely objective list of the top knock ons (from 2021 onwards – the most comprehensive data set I have access to only goes back that far).
I’ve got 11,432 knock ons coming up in my data set so clearly we’ll need to set some criteria to cut that down to a more reasonable size.
I’m only going to consider contested knock ons, that is ones that happen when the ball is in dispute rather than the ball has been directed to a player by their teammate. That leaves us with 9,411.
Next let’s restrict it to knock ons that take possession away from the opponent, as that’s a more drastic change of game state than simply keeping possession and gaining territory. Down to 3513 now.
Next, let’s cut to the chase and say only knock ons that contributed to a goal-scoring chain. This no doubt excludes many meritorious knock ons, but if we’re getting to a manageable number sacrifices are going to have to be made, and after all do any stats other than goals really matter? This gets us down to 329.
Let’s be really unfair here and filter not just on the result of the individual chain, but the result of the match. We’re only going to consider games where the margin was a goal or less in favour of the team that scored a goal following a knock on. Down to 35 and now we’re really talking.
In a moment I can only describe as serendipitous, I applied one final filter – only looking at the final quarter of games which brought us to an even 10.
I’ve ranked them (again, extremely scientifically) based on three criteria:
Technique – Does it go to a teammate’s advantage? Were there better options available (like taking possession)? How much pressure was it under?
Play context – How much did it impact the play? Were other teammates around that would have caused the intercept anyway? To what degree did the player’s efforts contribute to the eventual goal?
Match context – How much time is left in the final quarter? What is the current margin? Is this a go-ahead goal (or the final go-ahead goal)?
Where necessary the tiebreaker will be the vibe of it.
So without further ado,
The completely objective top (and only) 10 (contested) knock ons (that launched a goal-scoring chain in the final quarter and the scoring team drew or won by a goal or less) in the history of the AFL (from 2021 onwards)
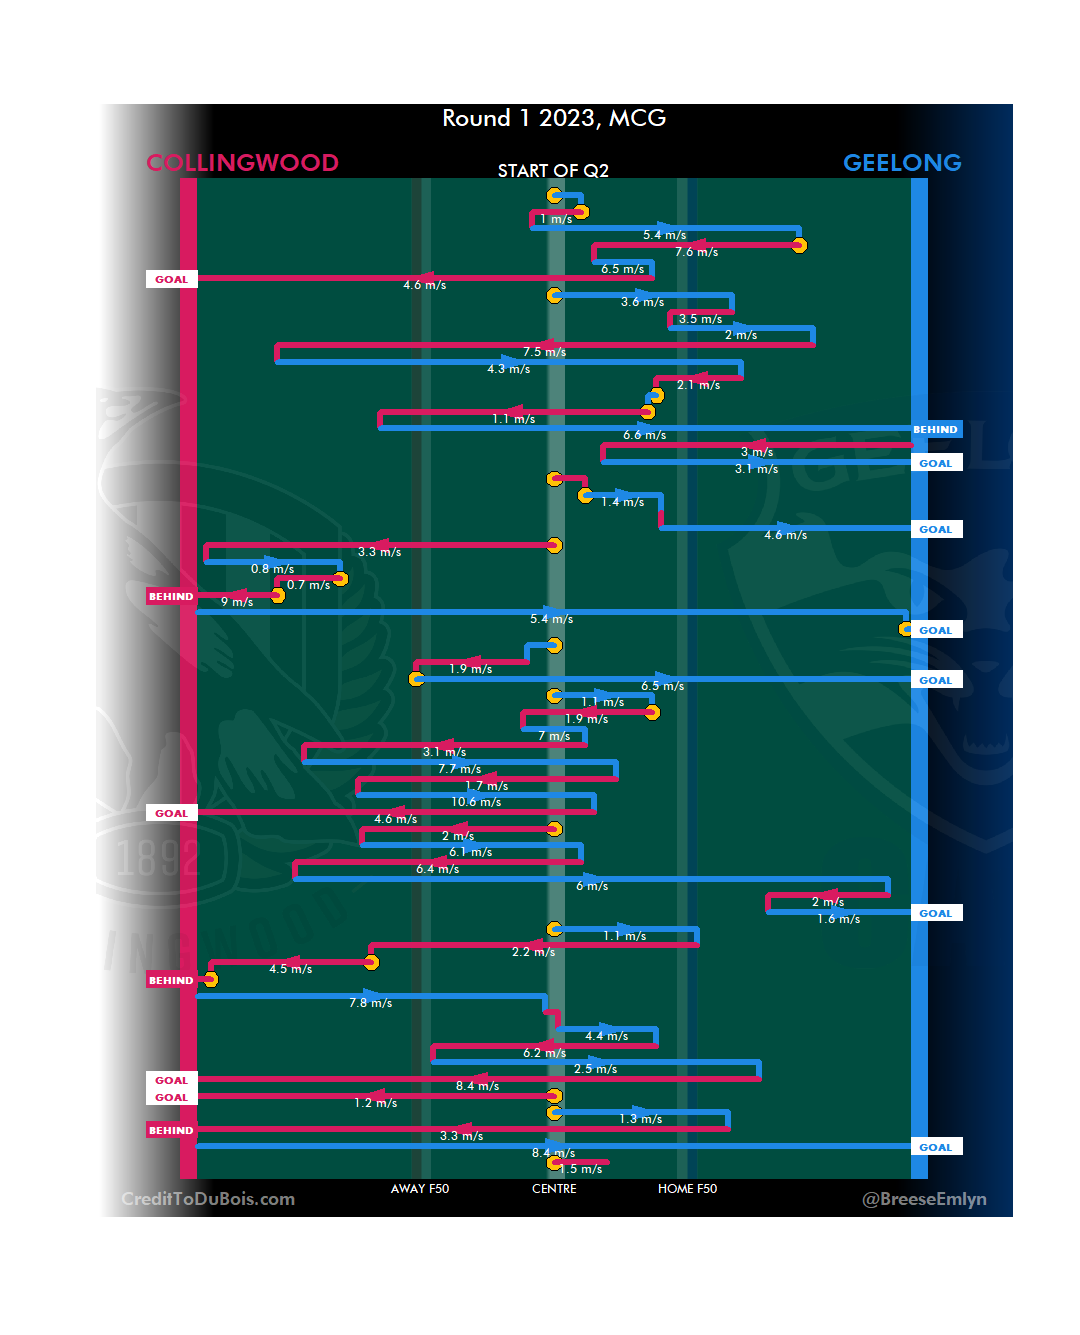
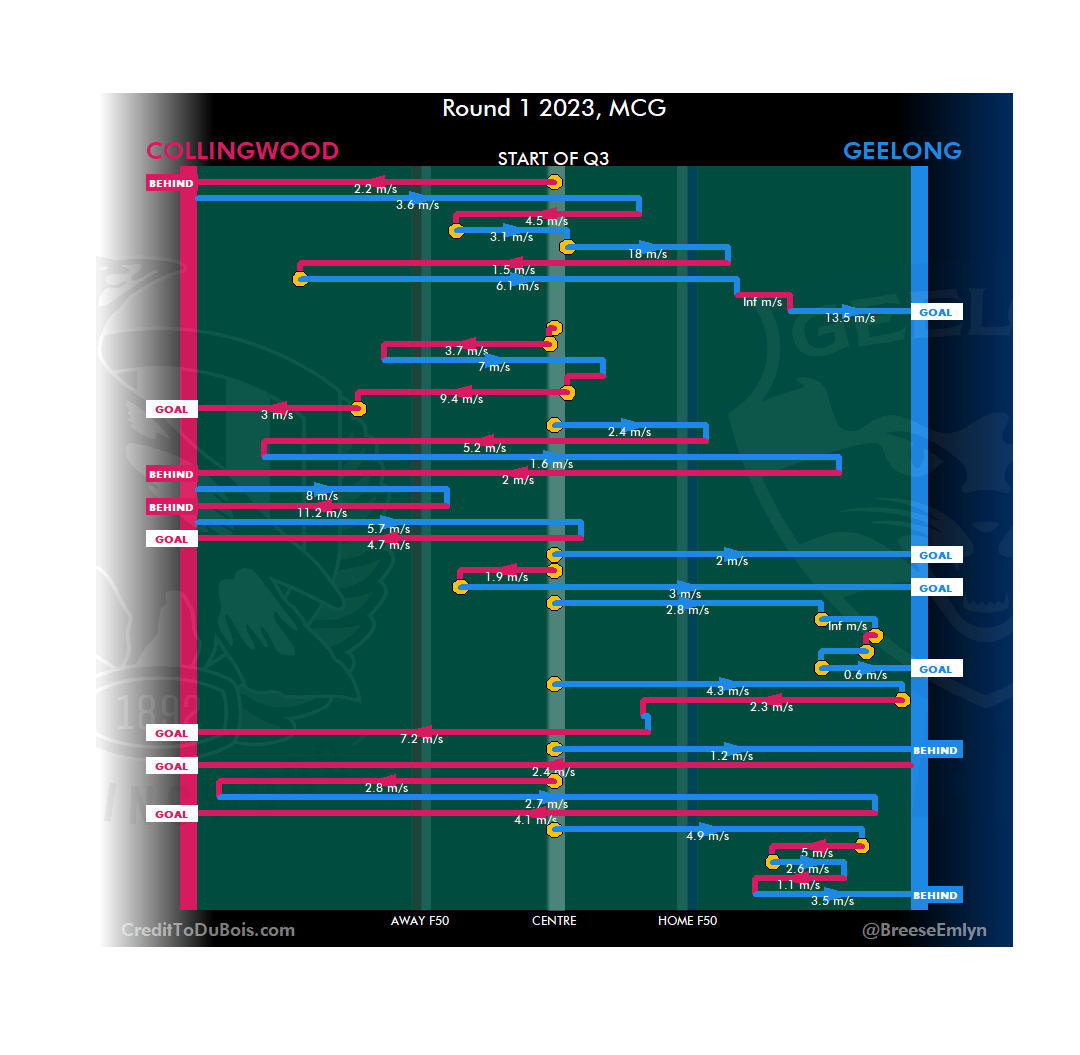
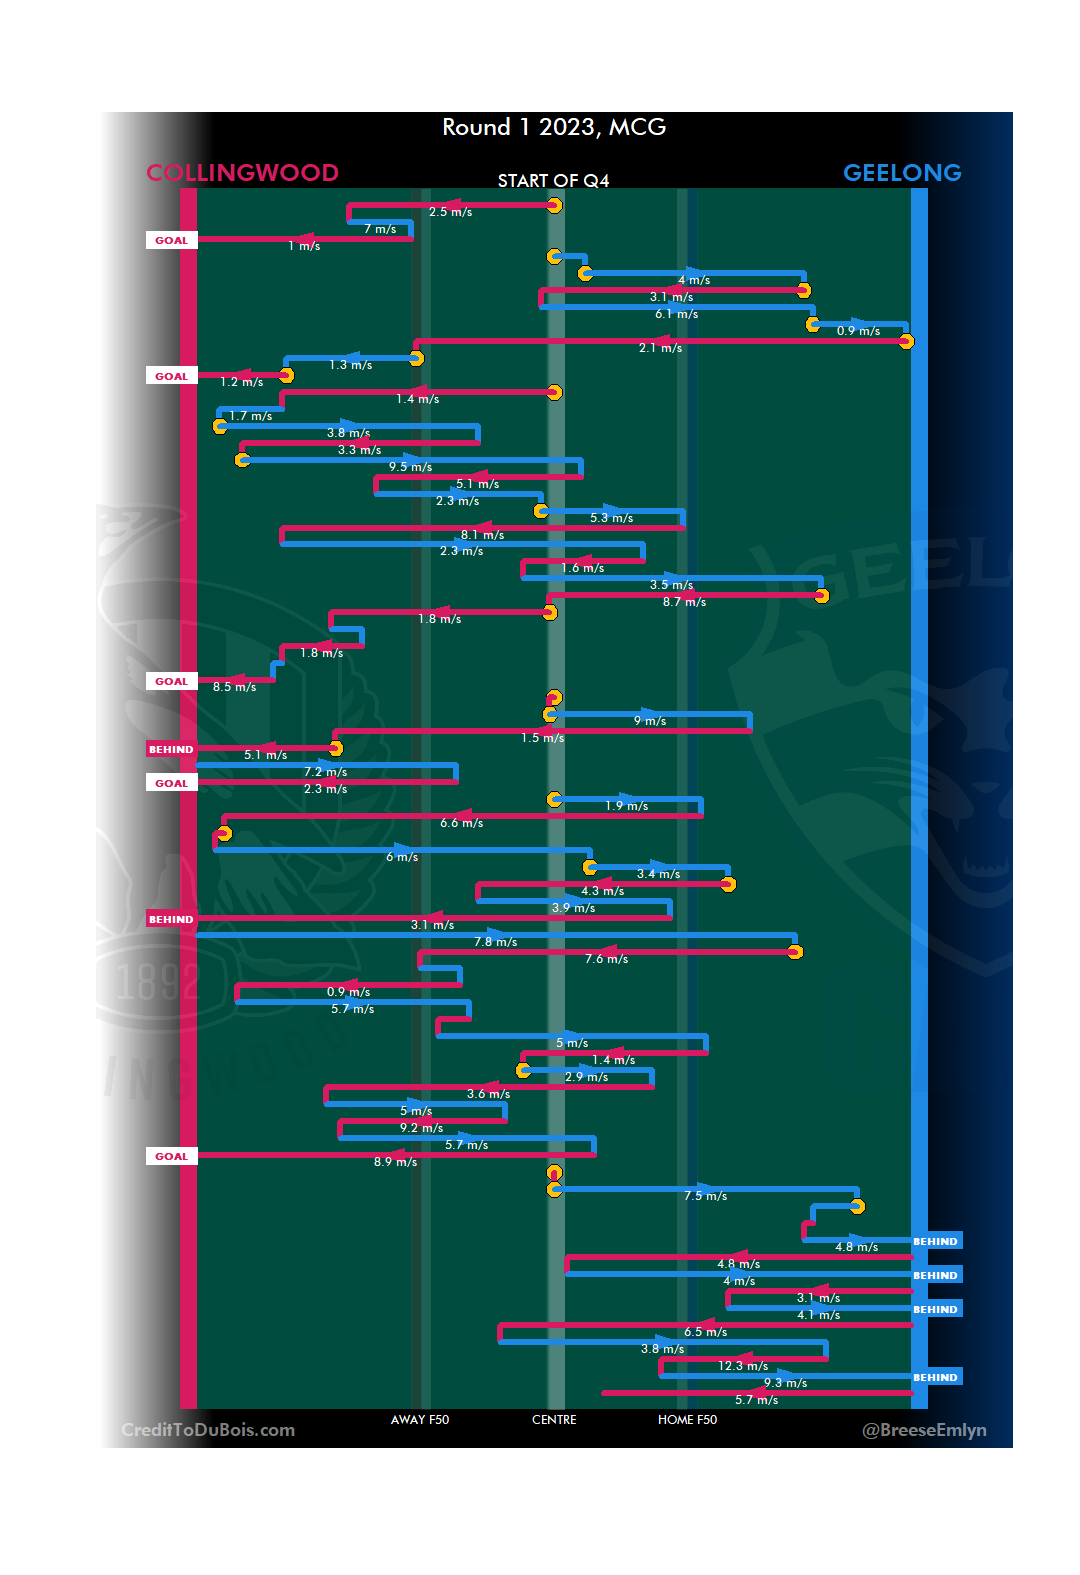
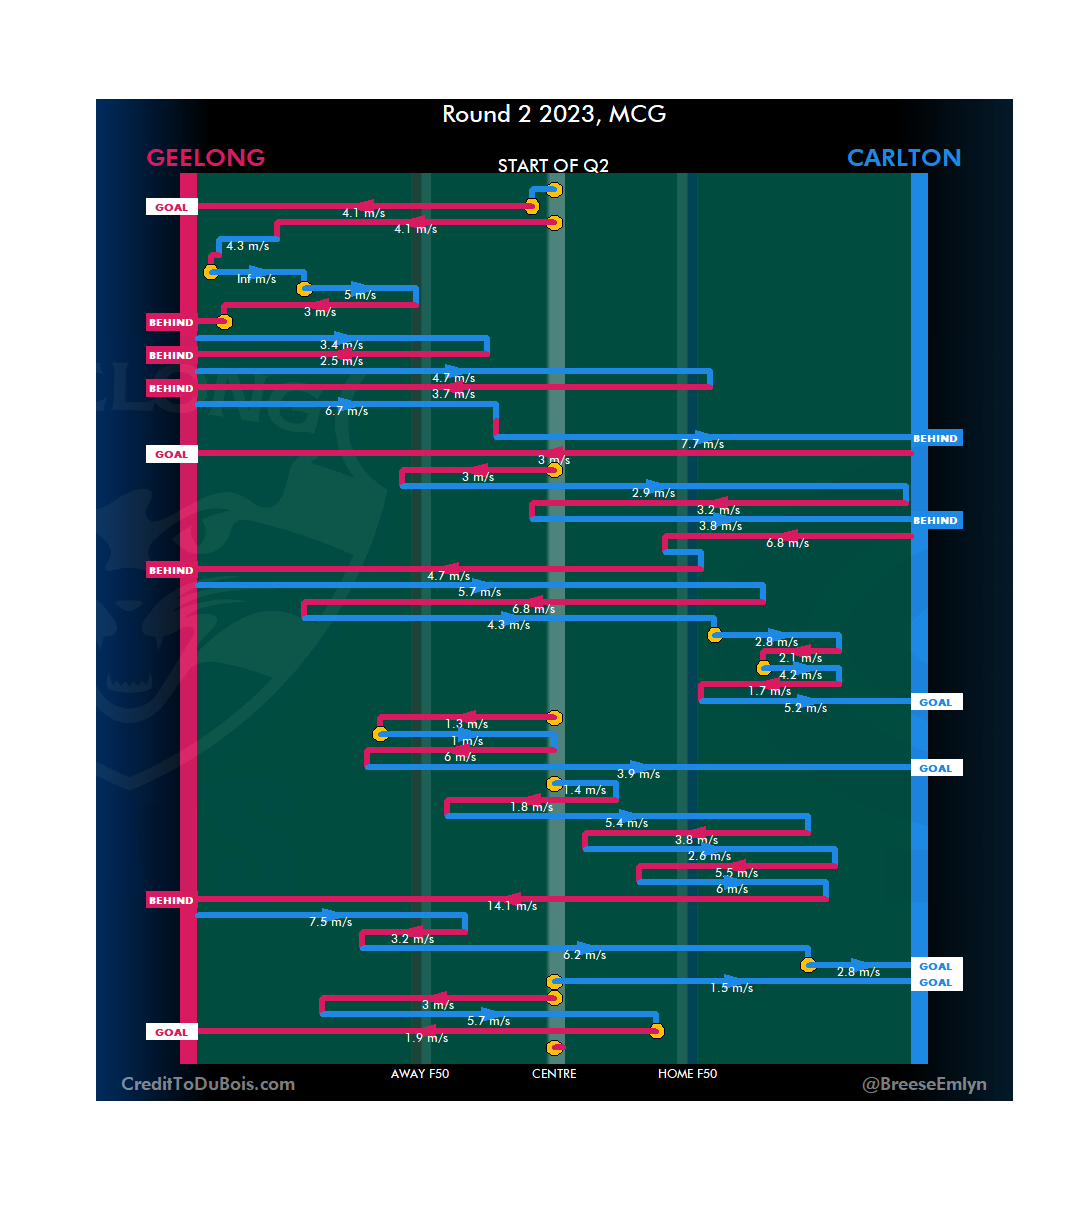
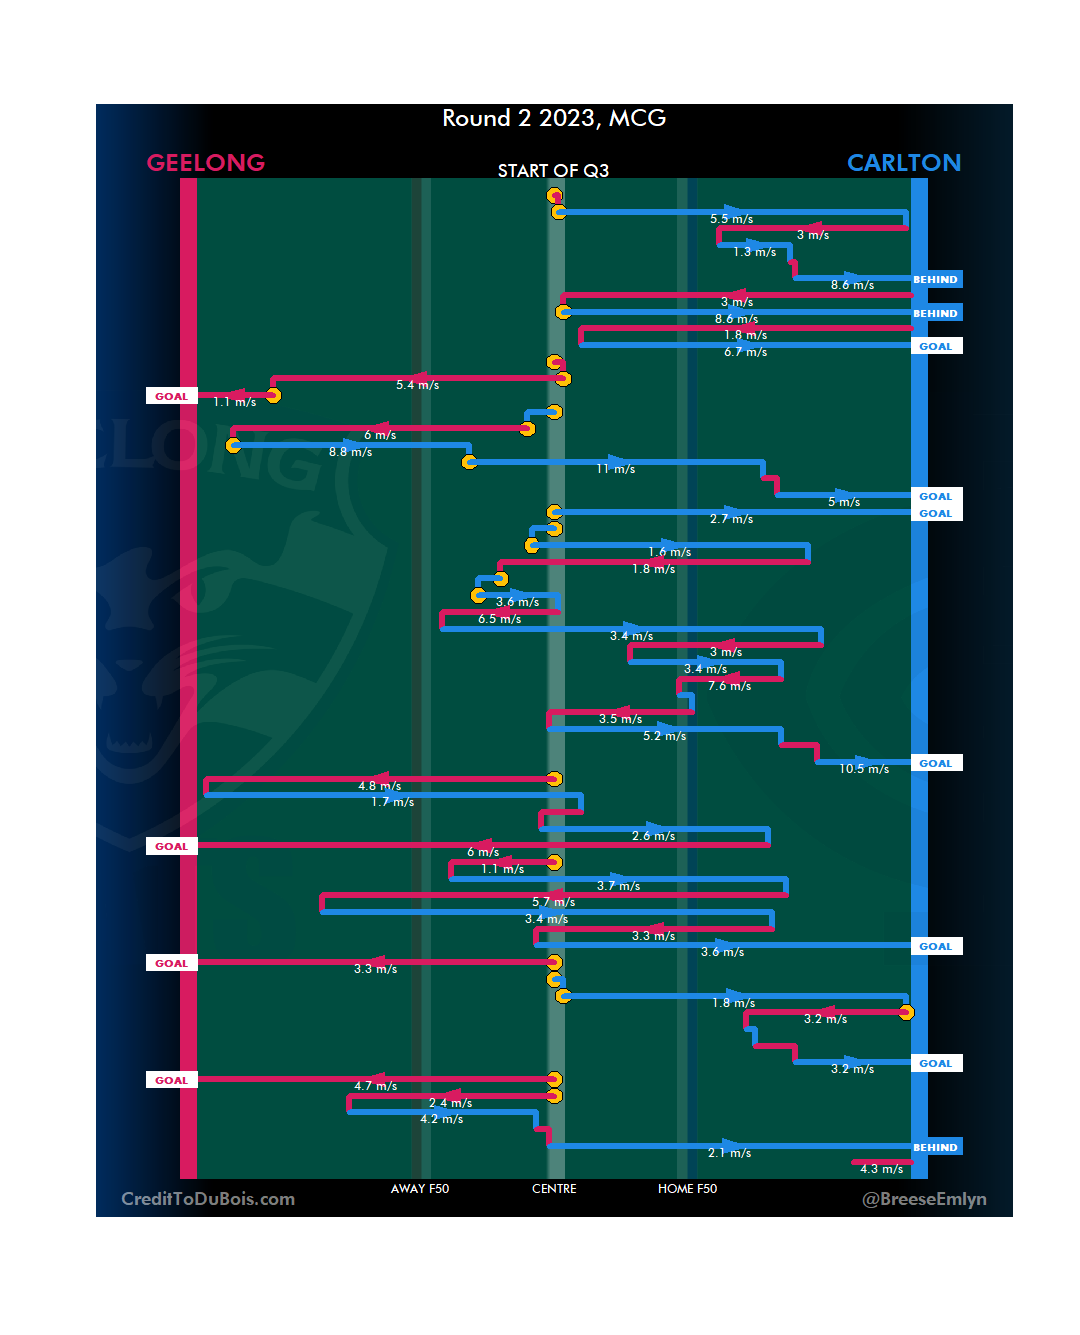
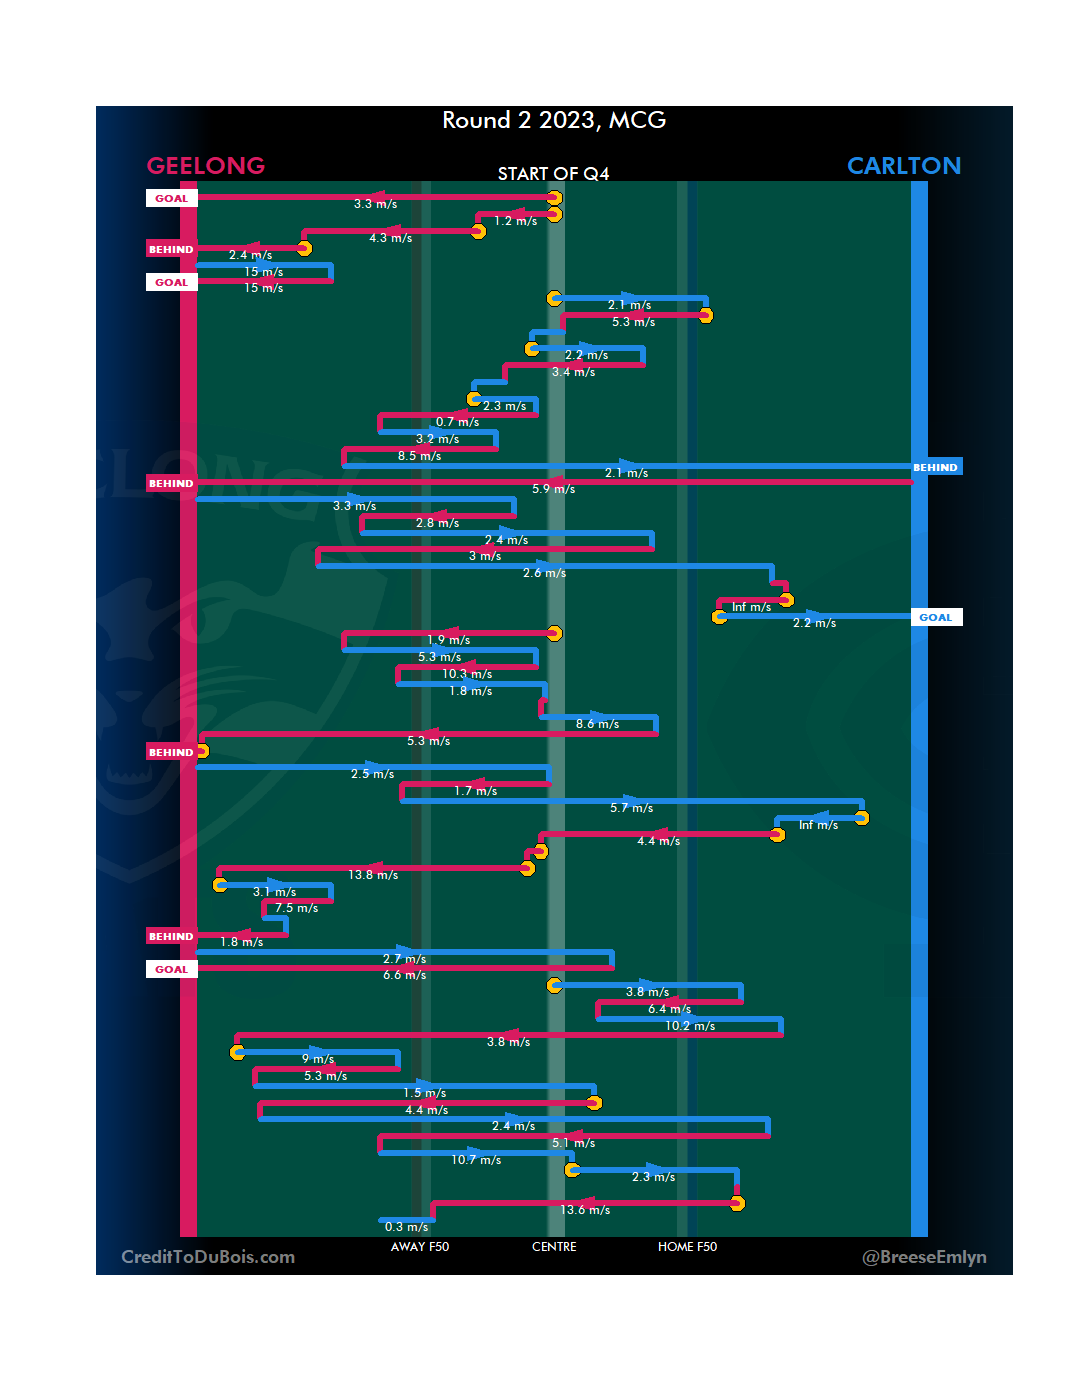
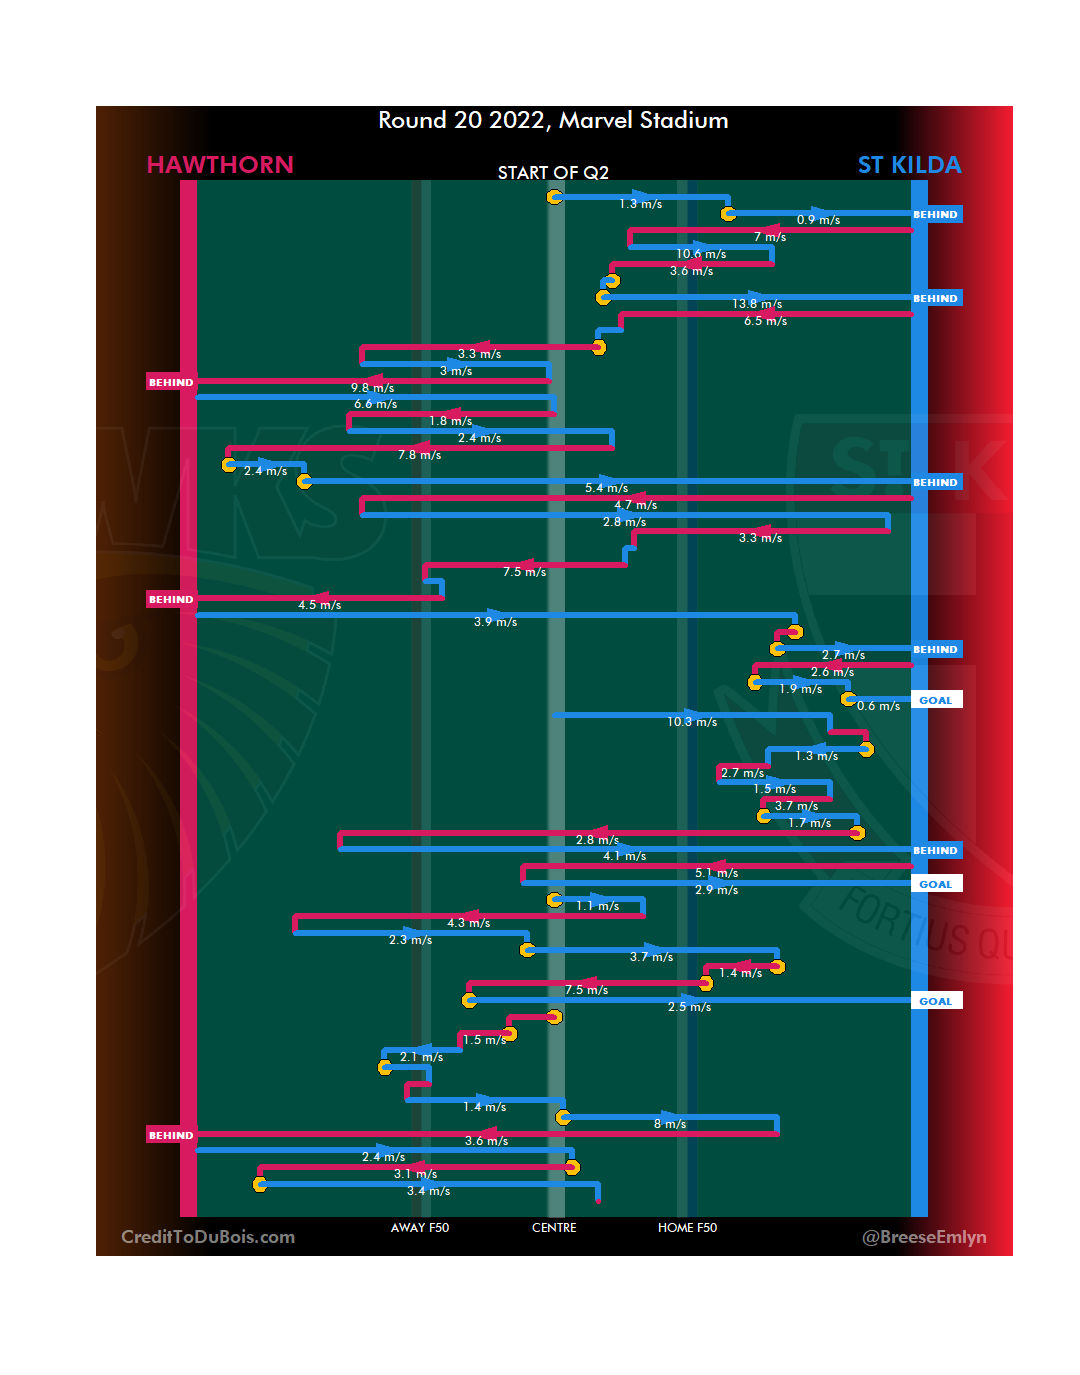
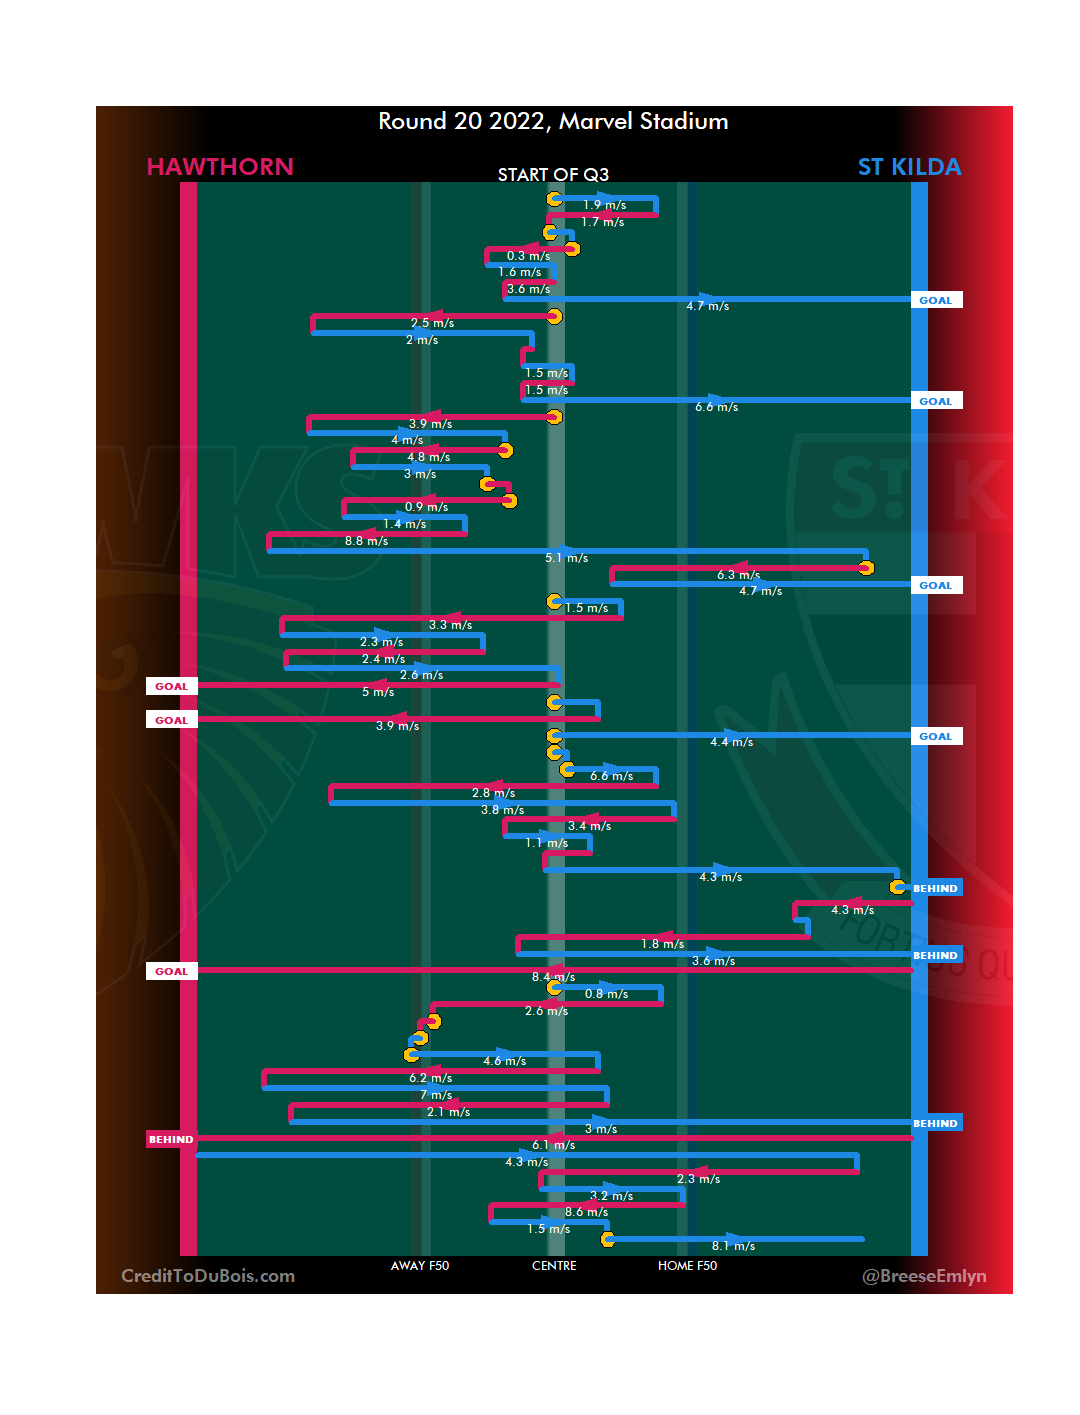
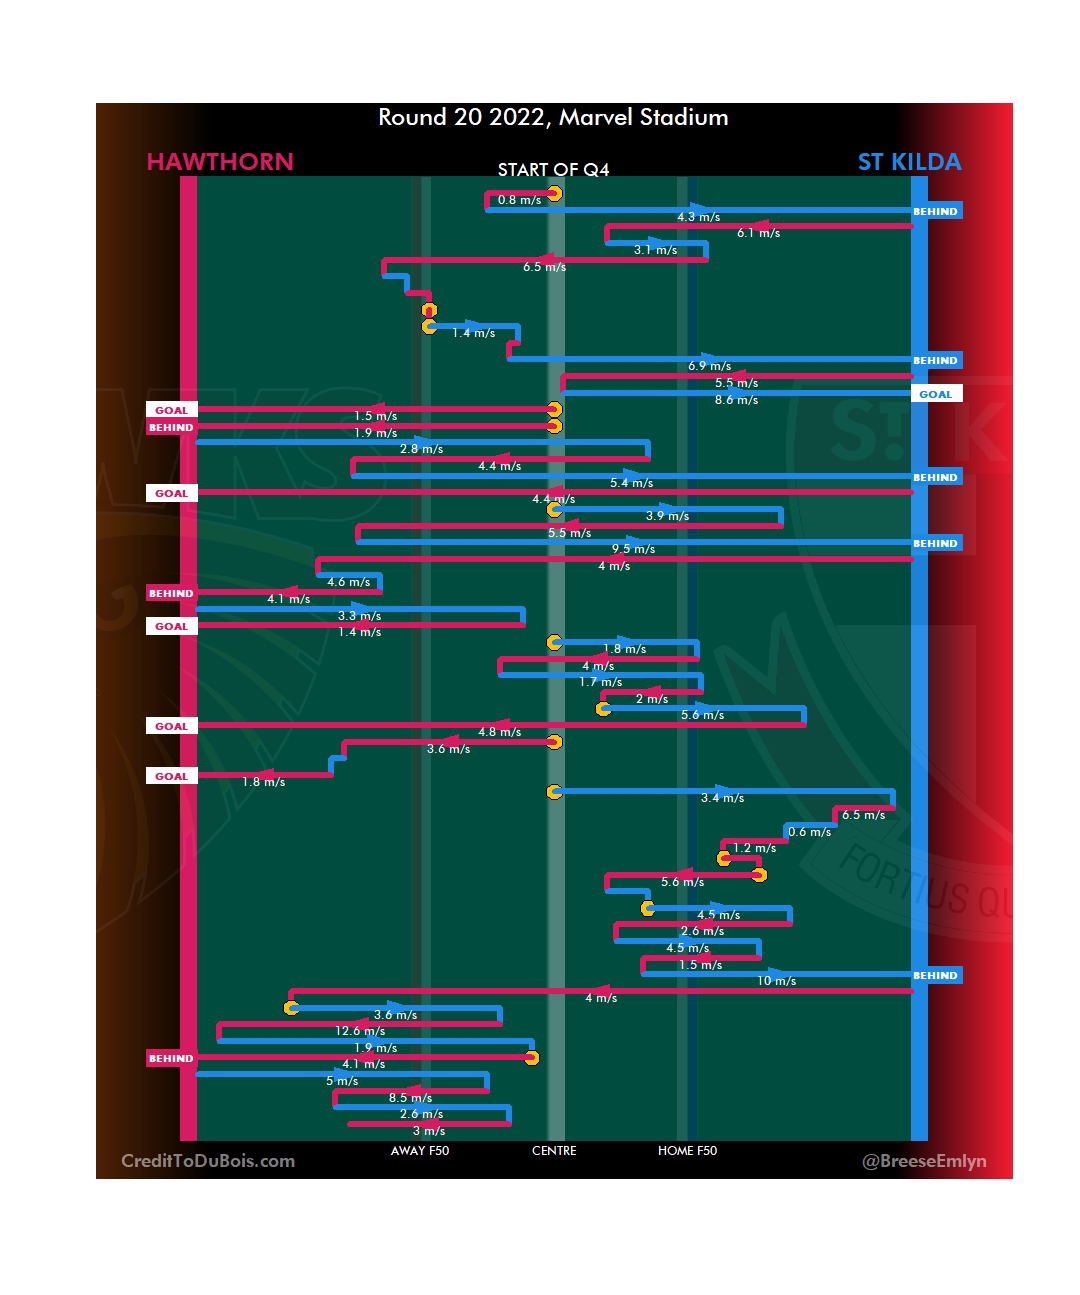
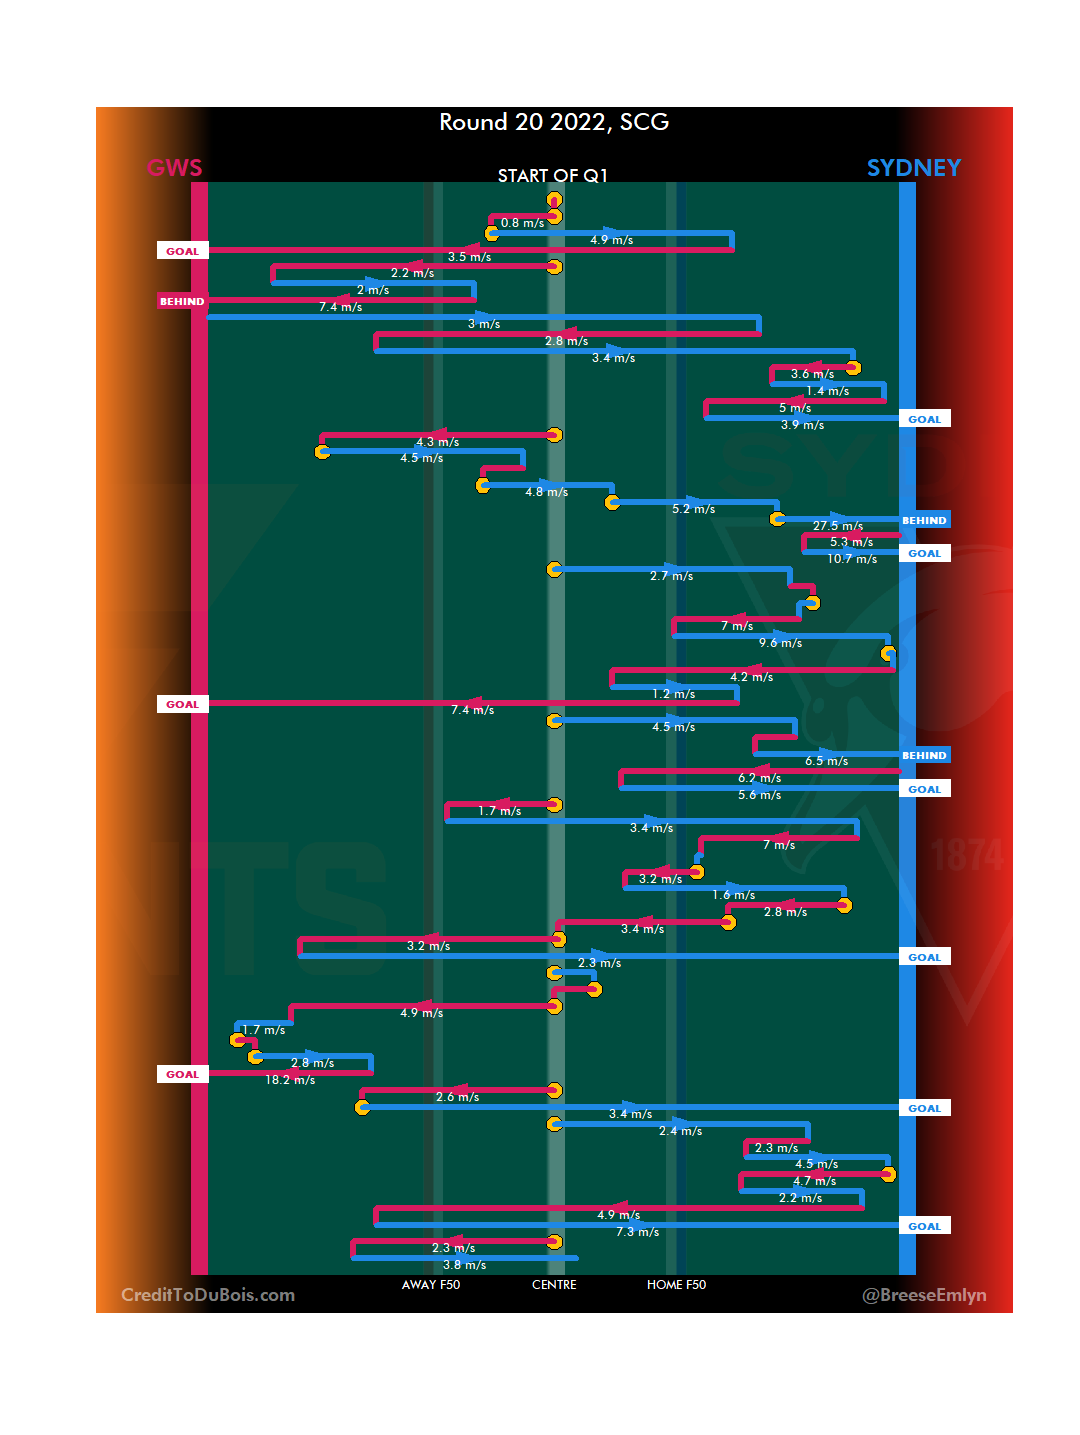
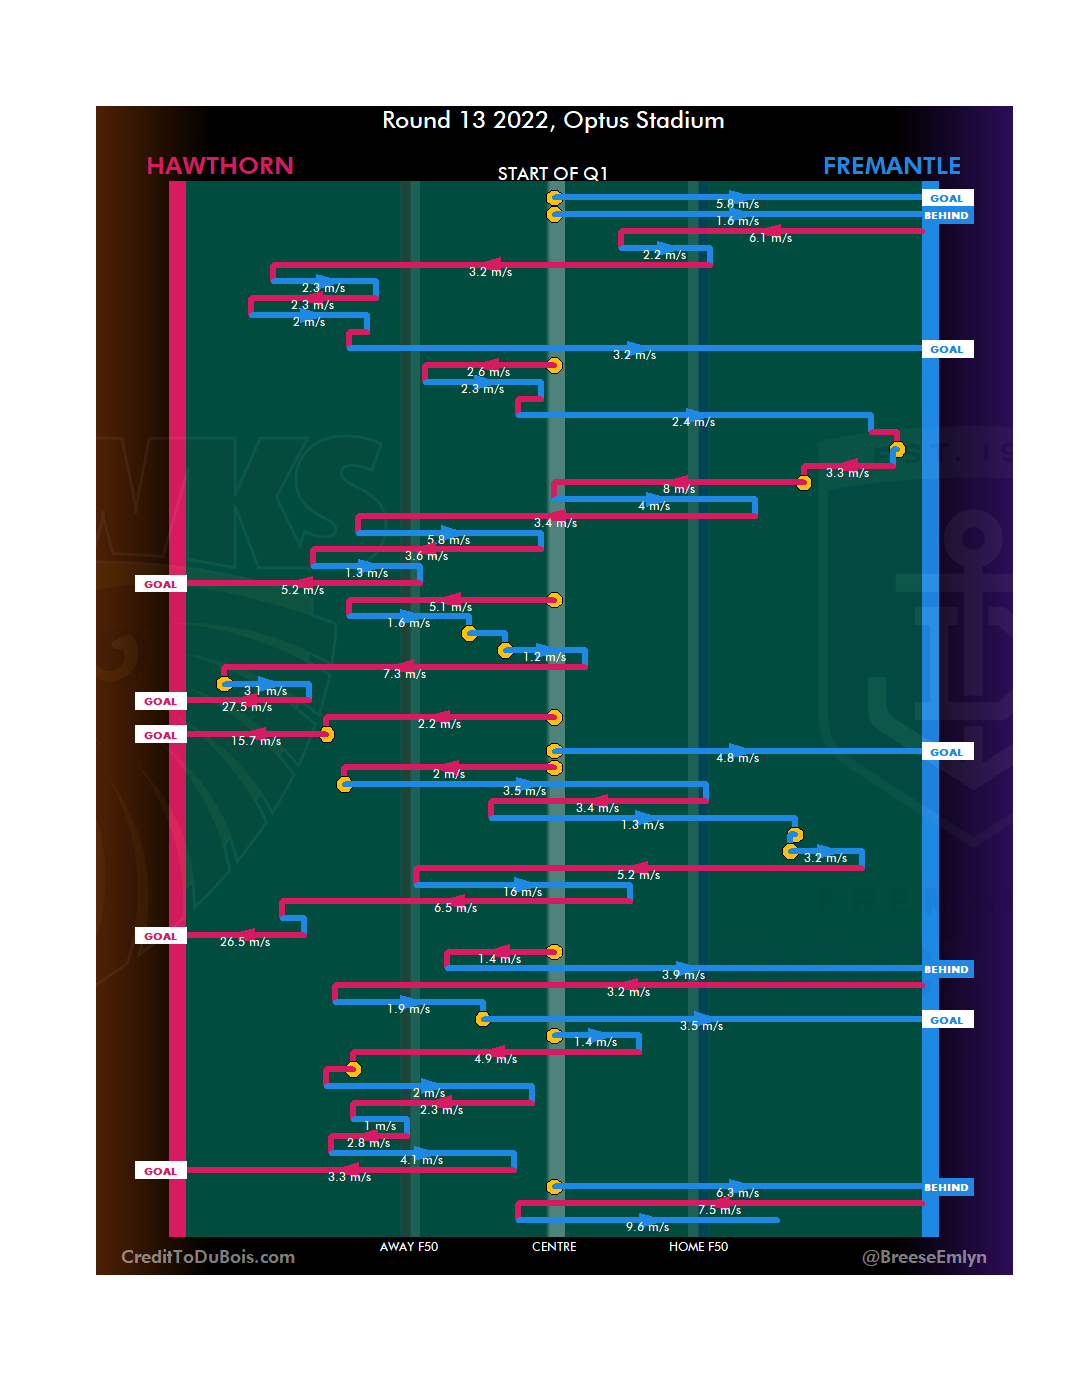
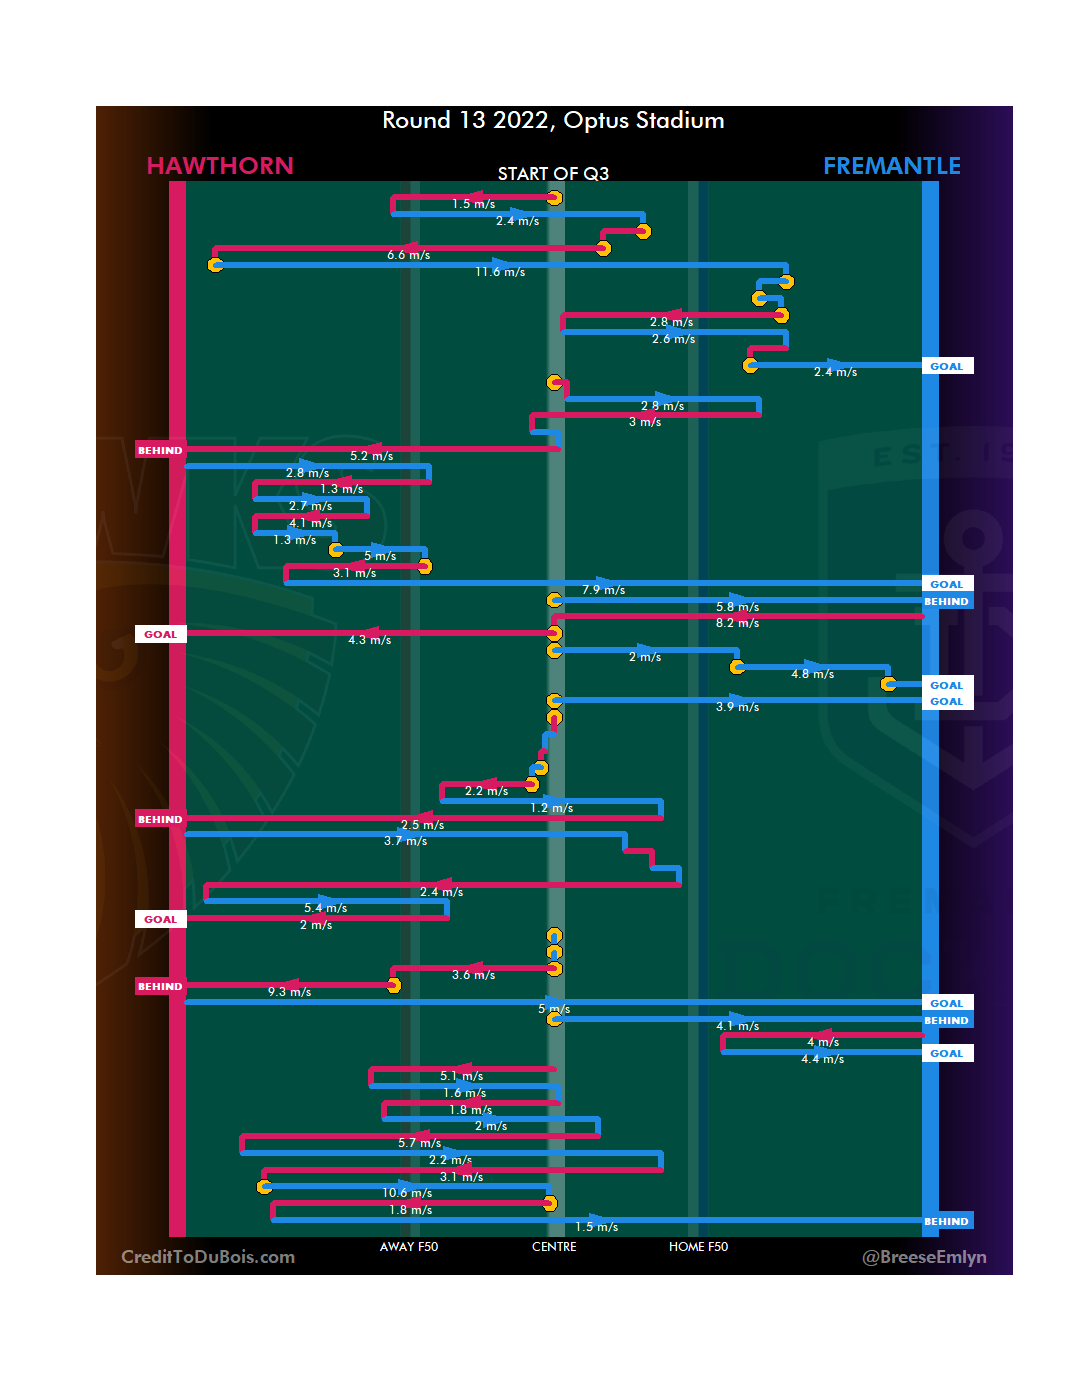
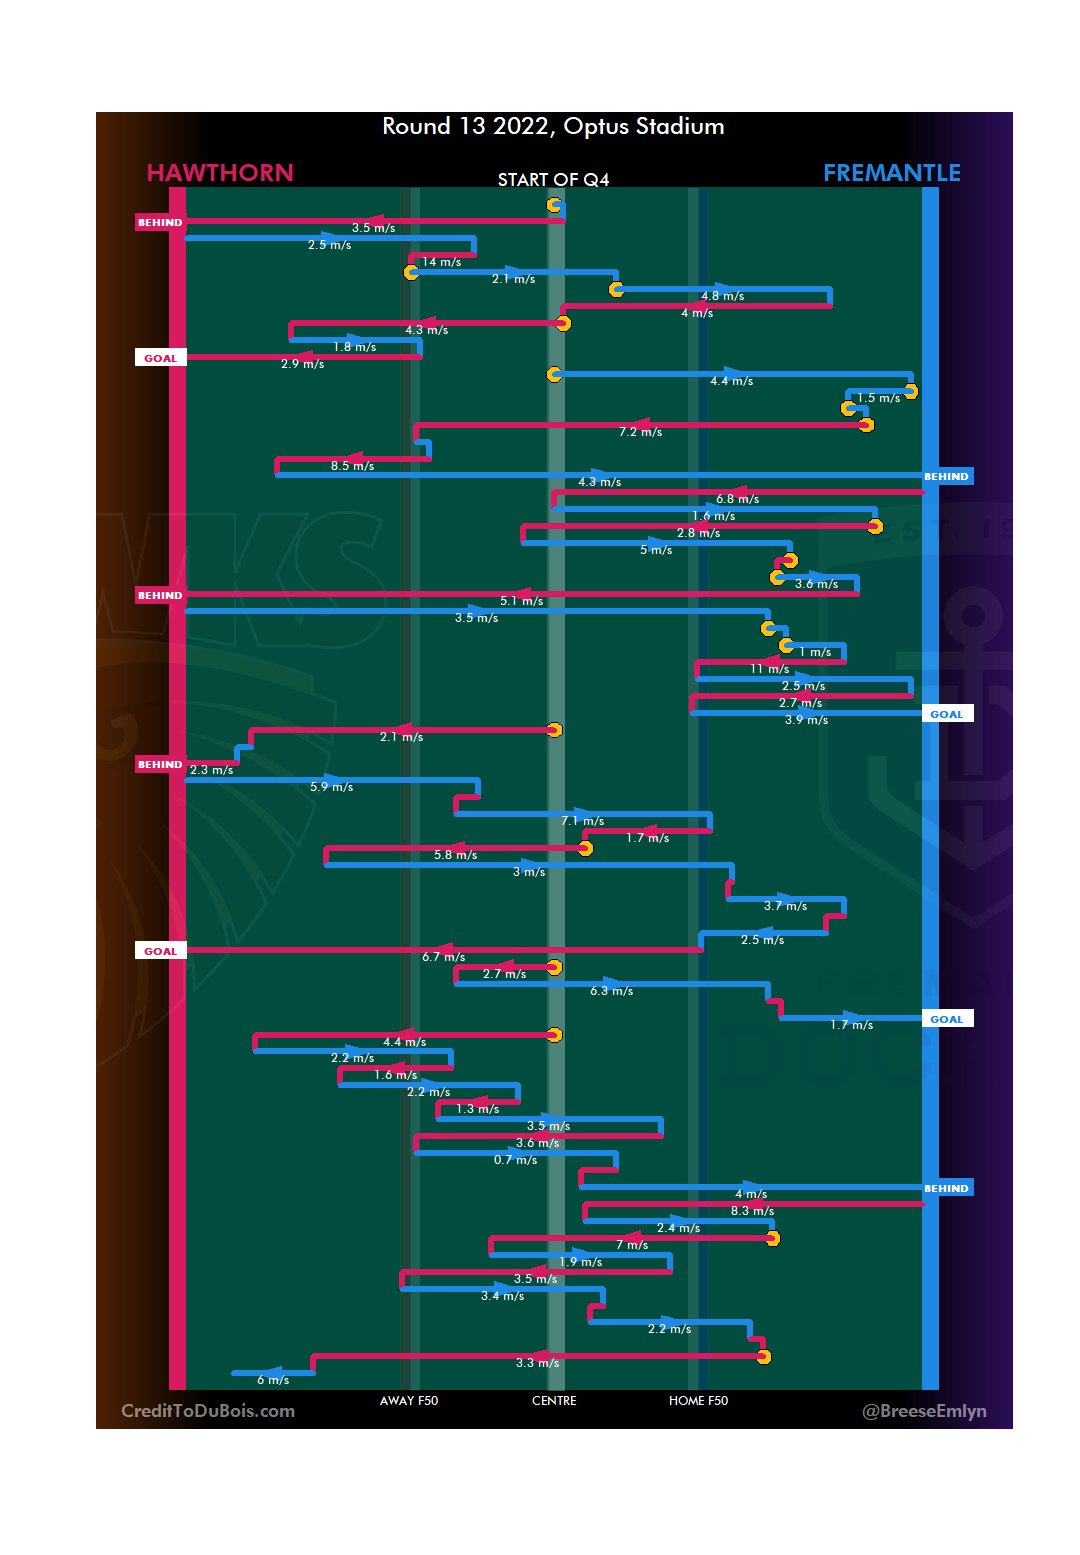
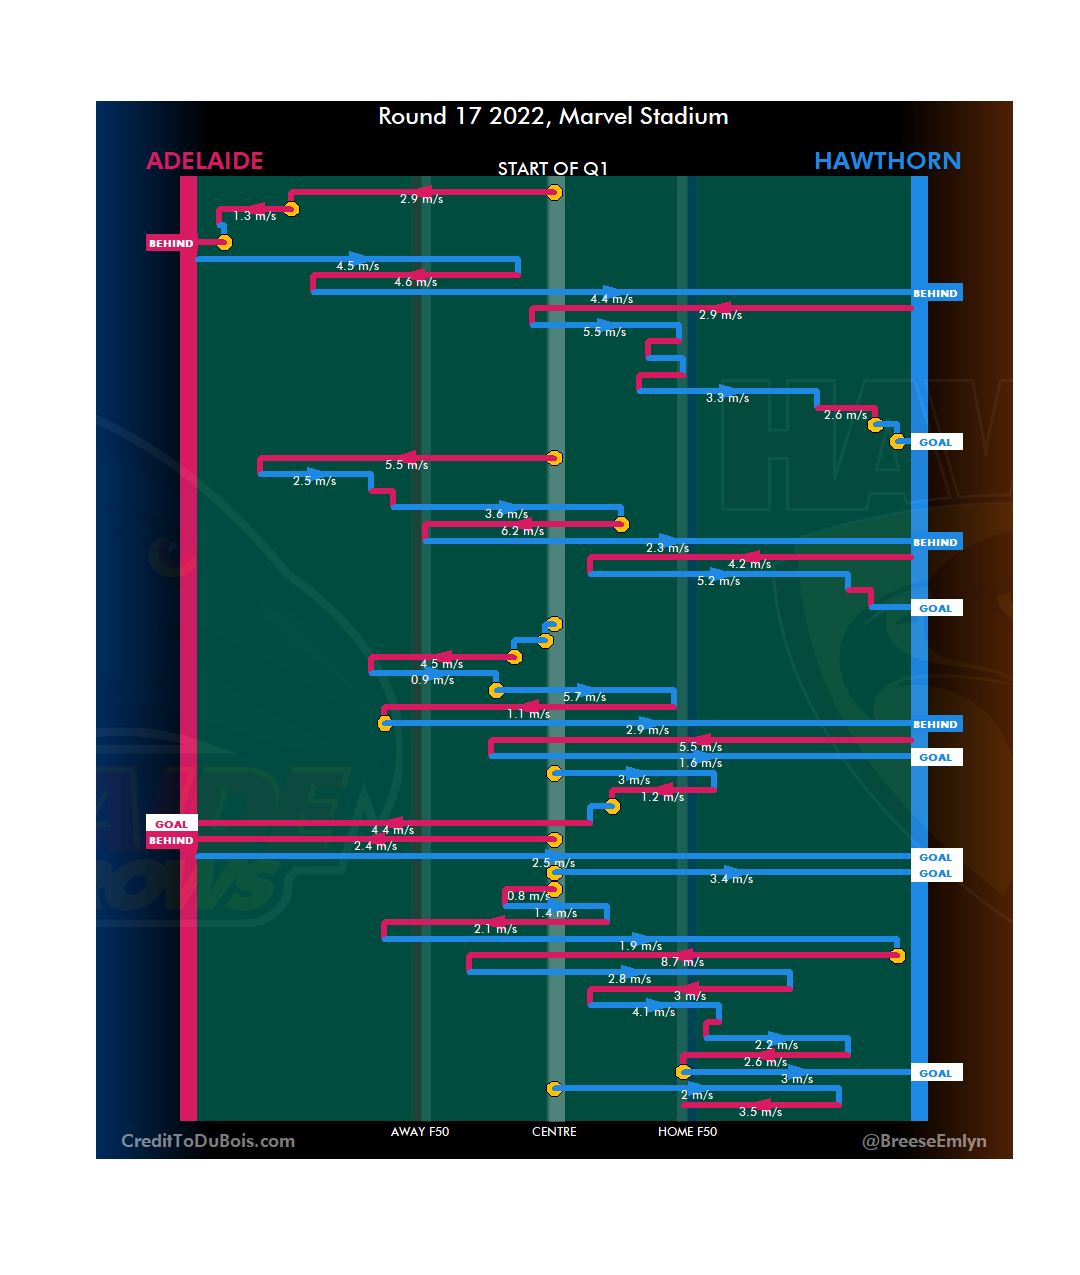
#10 Jeremy Howe v Hawthorn 2022 R12
Not so much a knock on as an unpenalised throw, combined with it being pretty early in the quarter consign this to the bottom of the list.
#9 Ed Allan v Fremantle 2024 R11
I actually rated this one high on technique, it’s the one on the list that really gains some territory which I feel is the more archetypal knock on. It scores lower on context, particularly match context as Collingwood were already three goals up and a long way to play in the quarter.
#8 Callum Wilkie v Gold Coast R13 2024
High on match context (go ahead goal with a few minutes remaining) low on play context due to the goal coming from a long-range down the field free, and the technique not great either as it was a second bite at what should have been a cleaner disposal.
#7 Kyle Langford v North R12 2023
Like Howe’s earlier, this scores a 0 on technique because it’s absolutely a scoop that should have been called as a throw. The context of a F50 recovery and a late go-ahead goal bring the score up though.
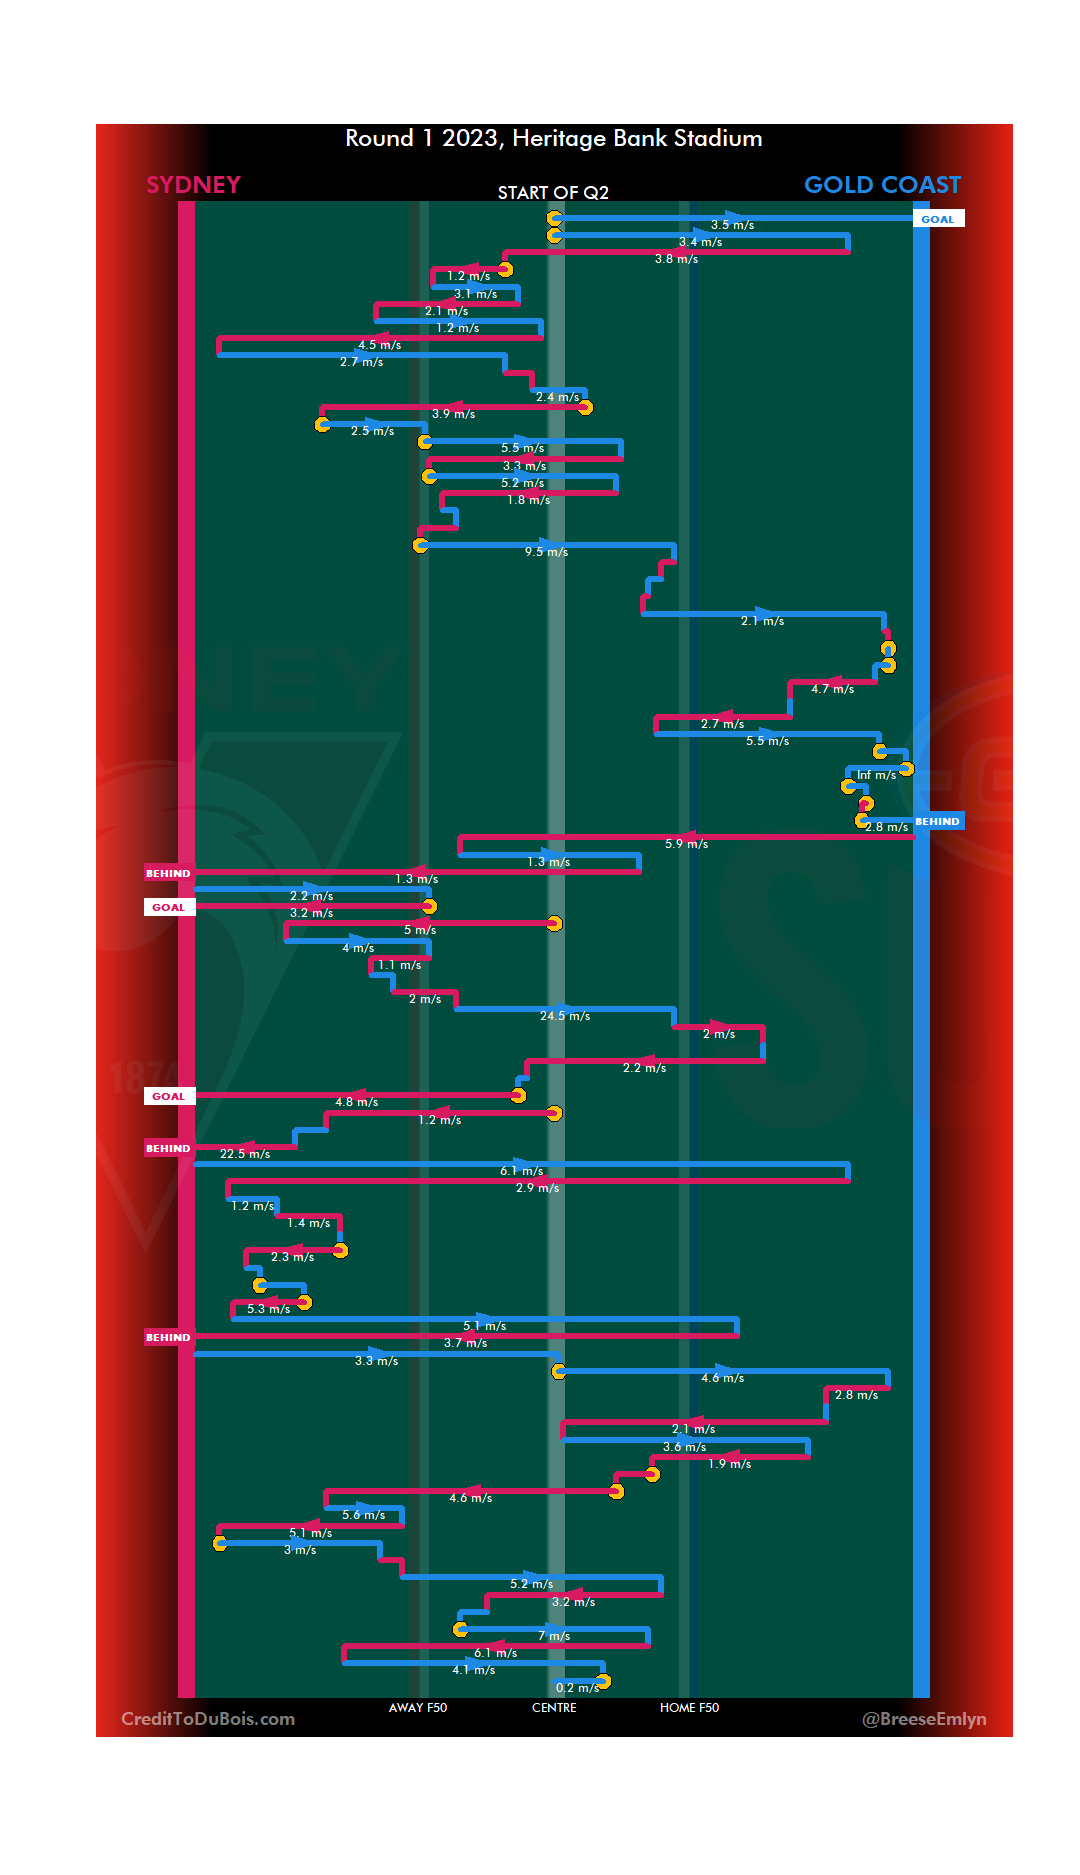
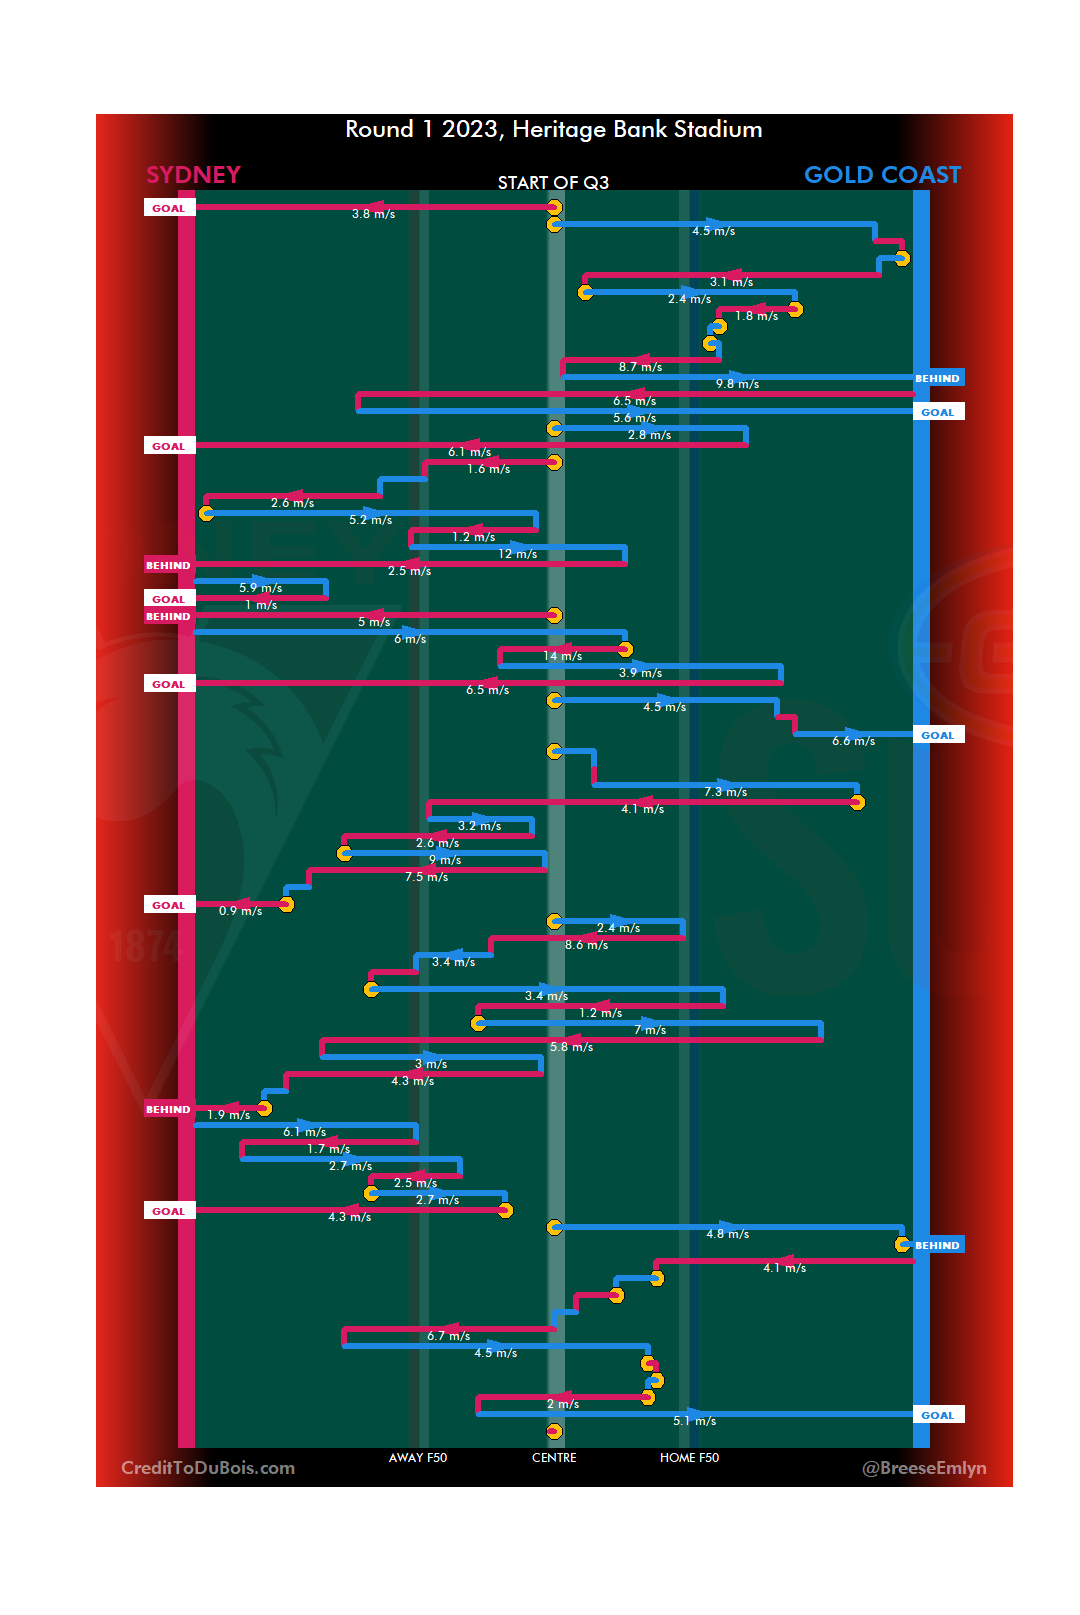
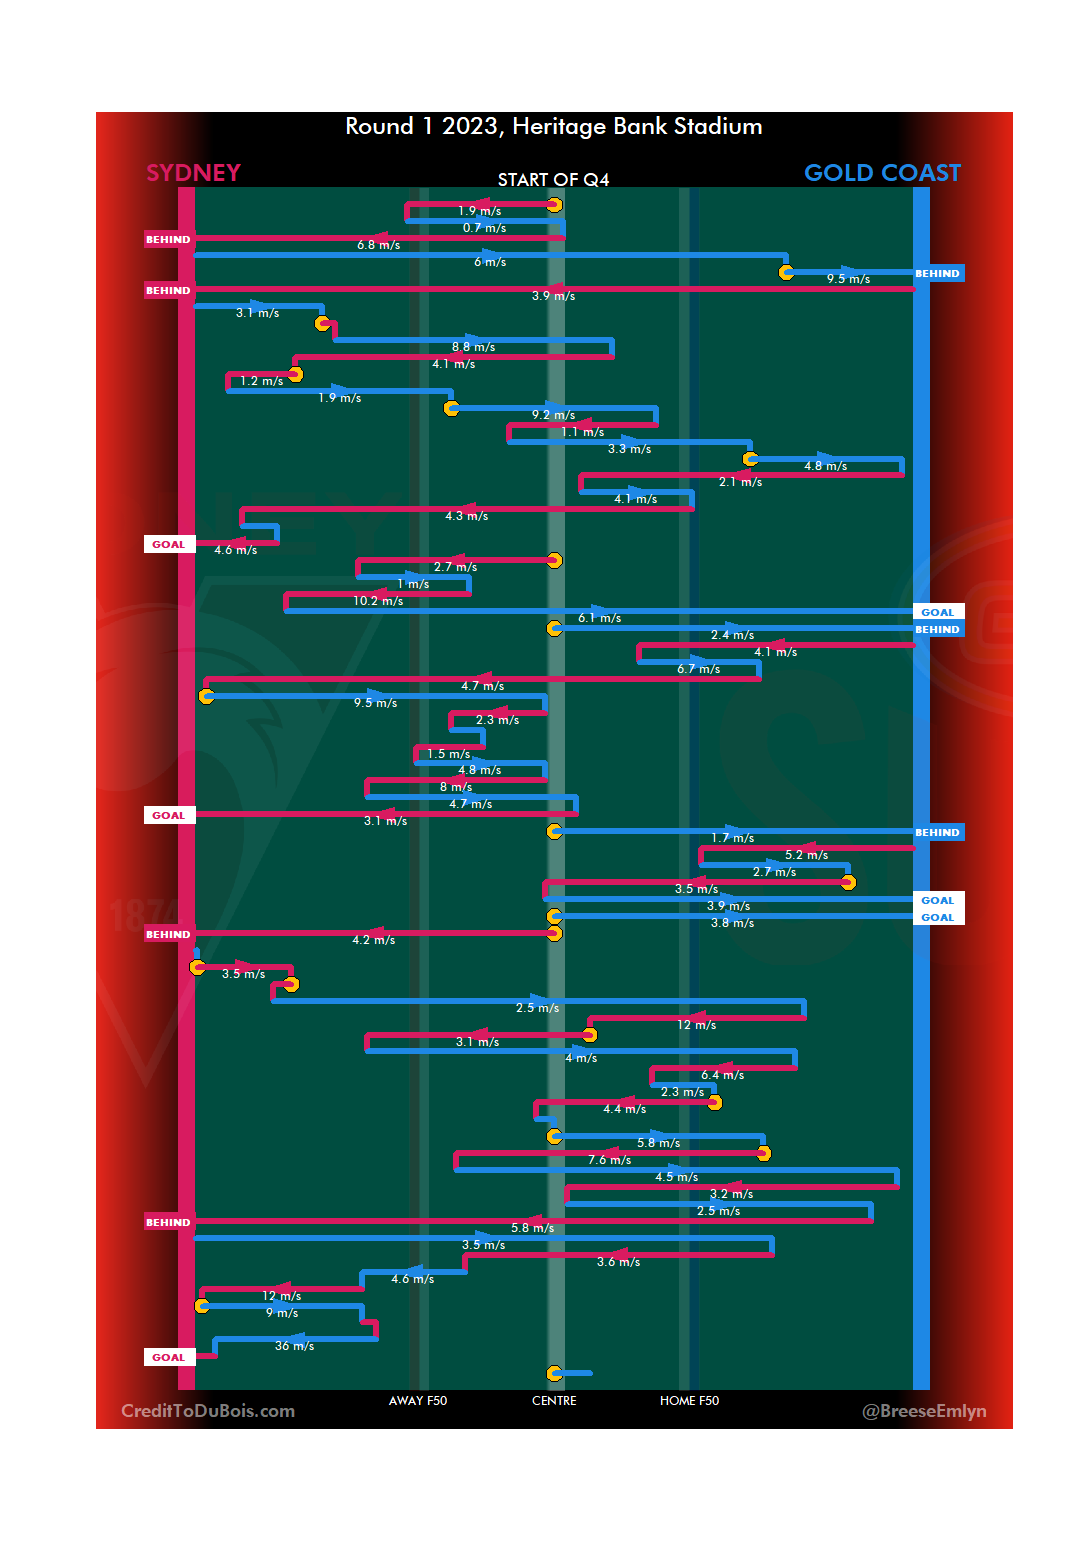
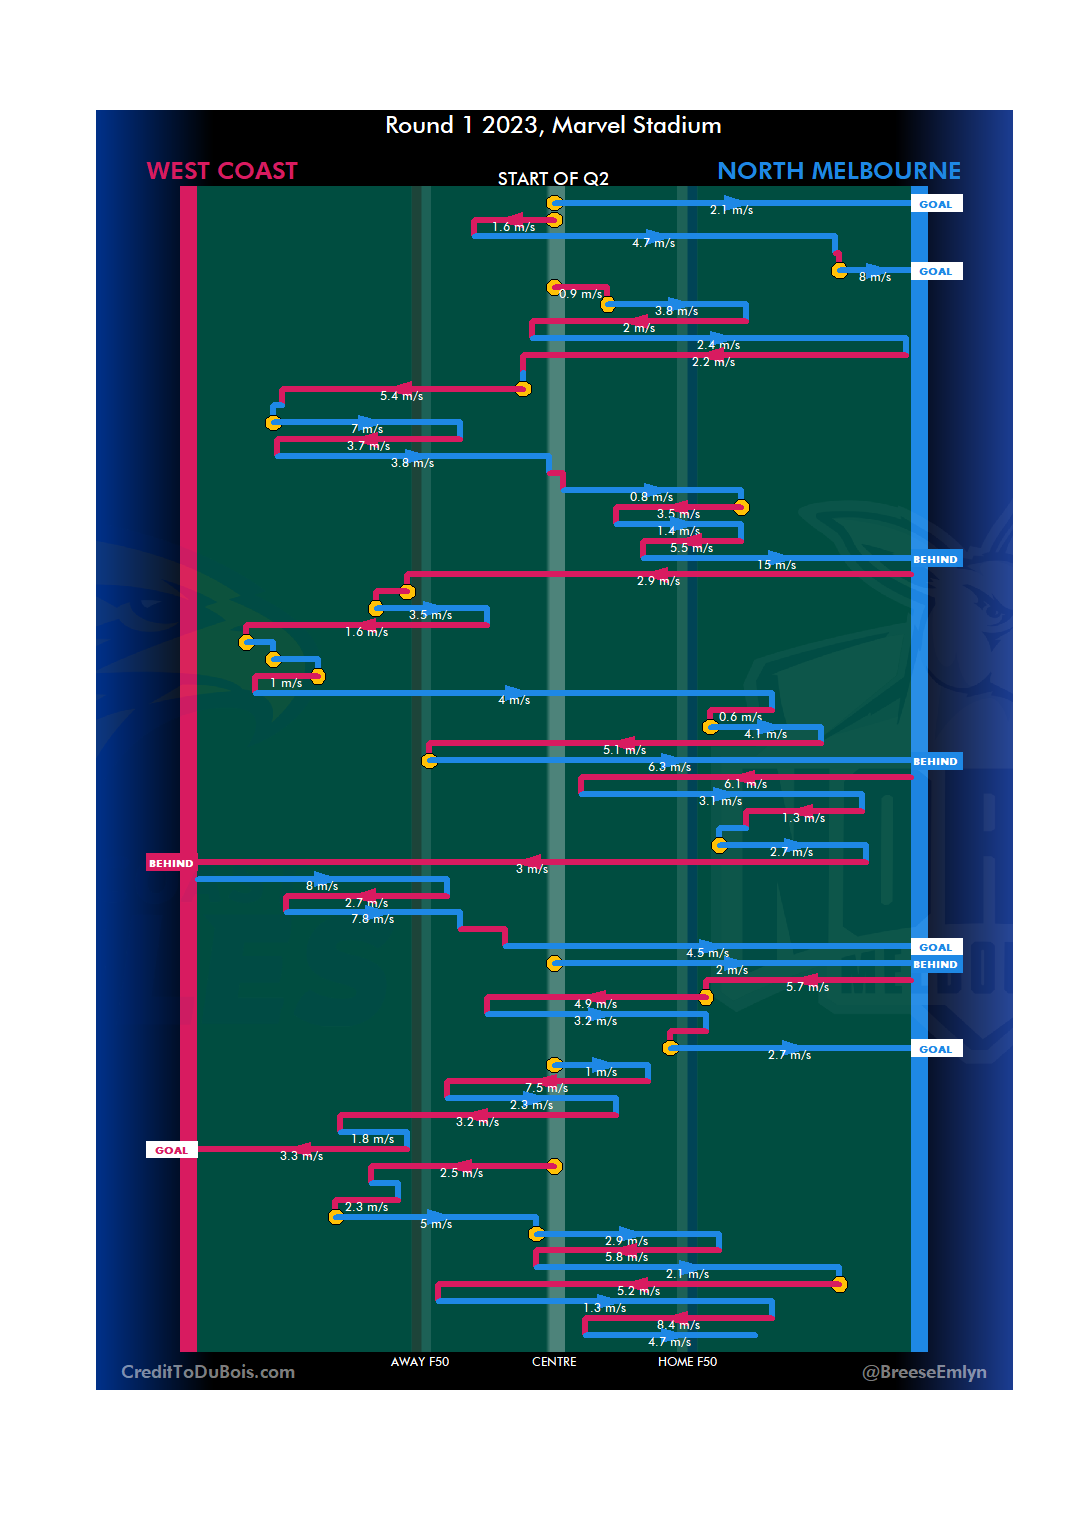
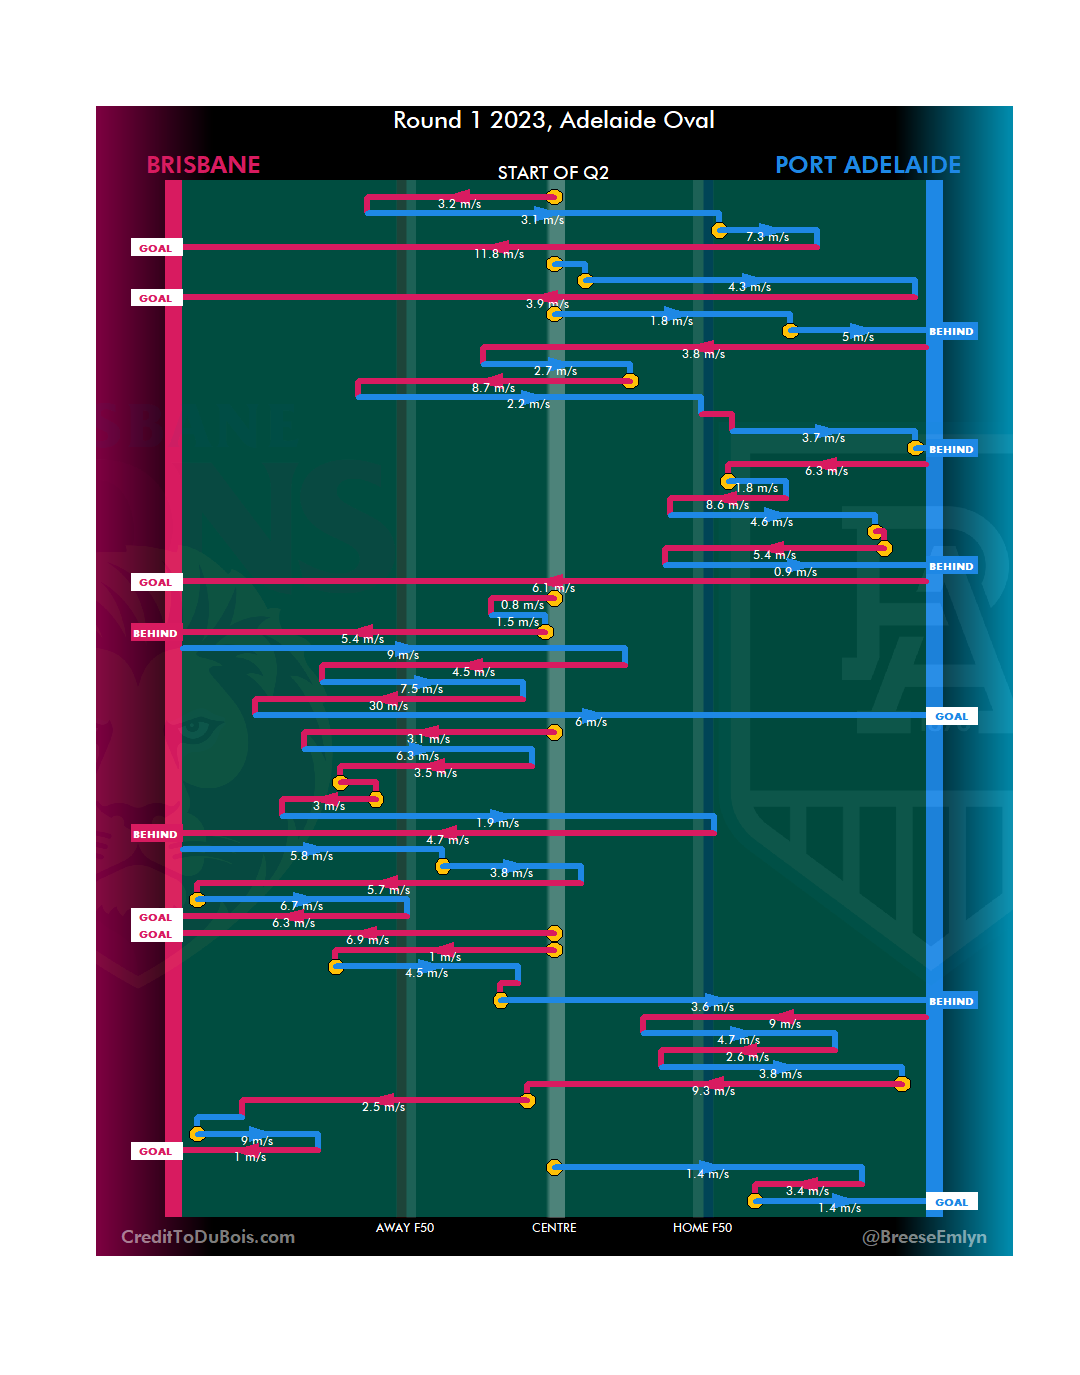
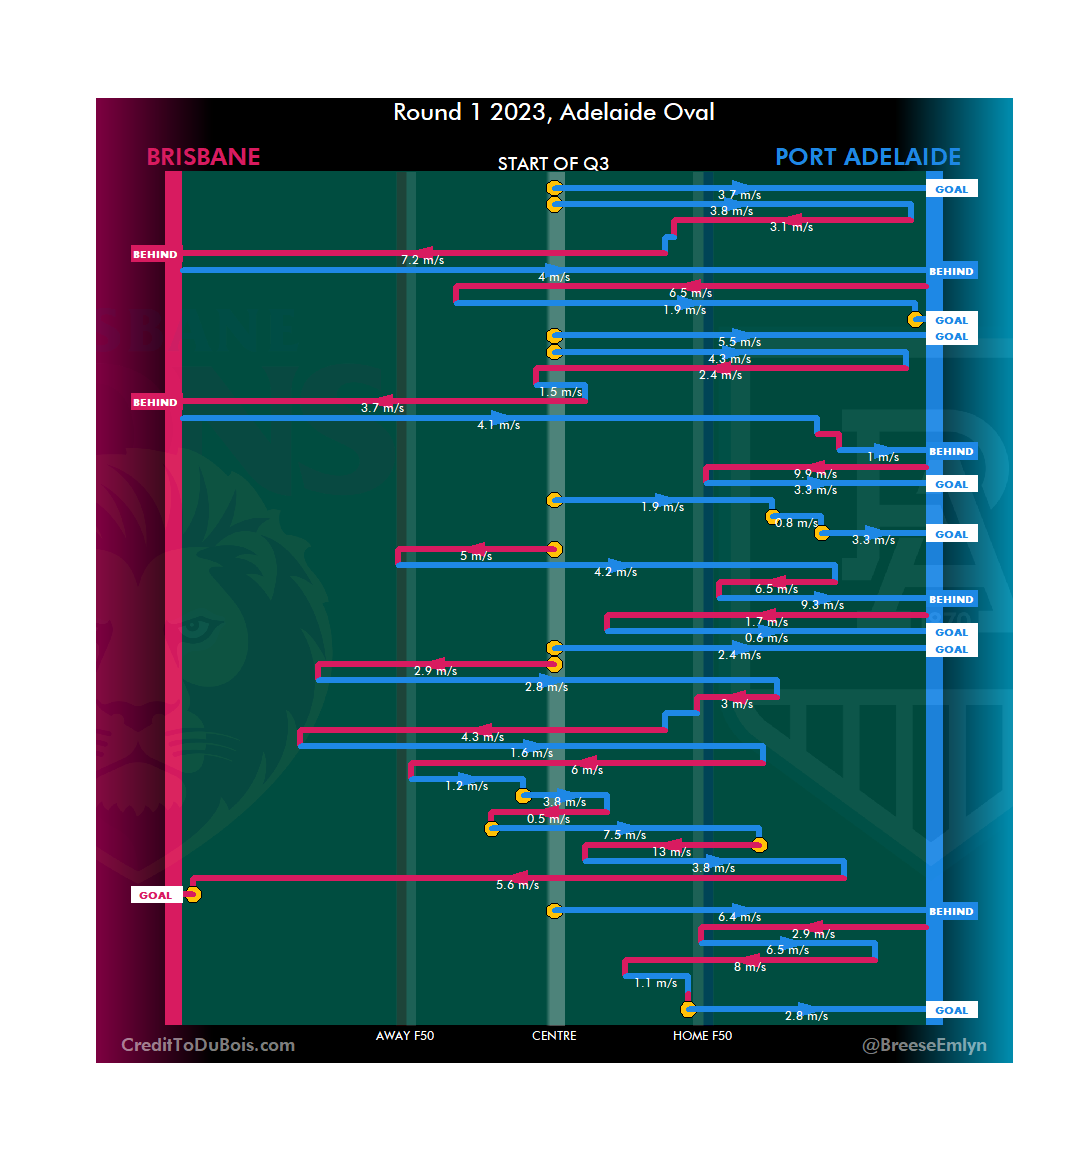
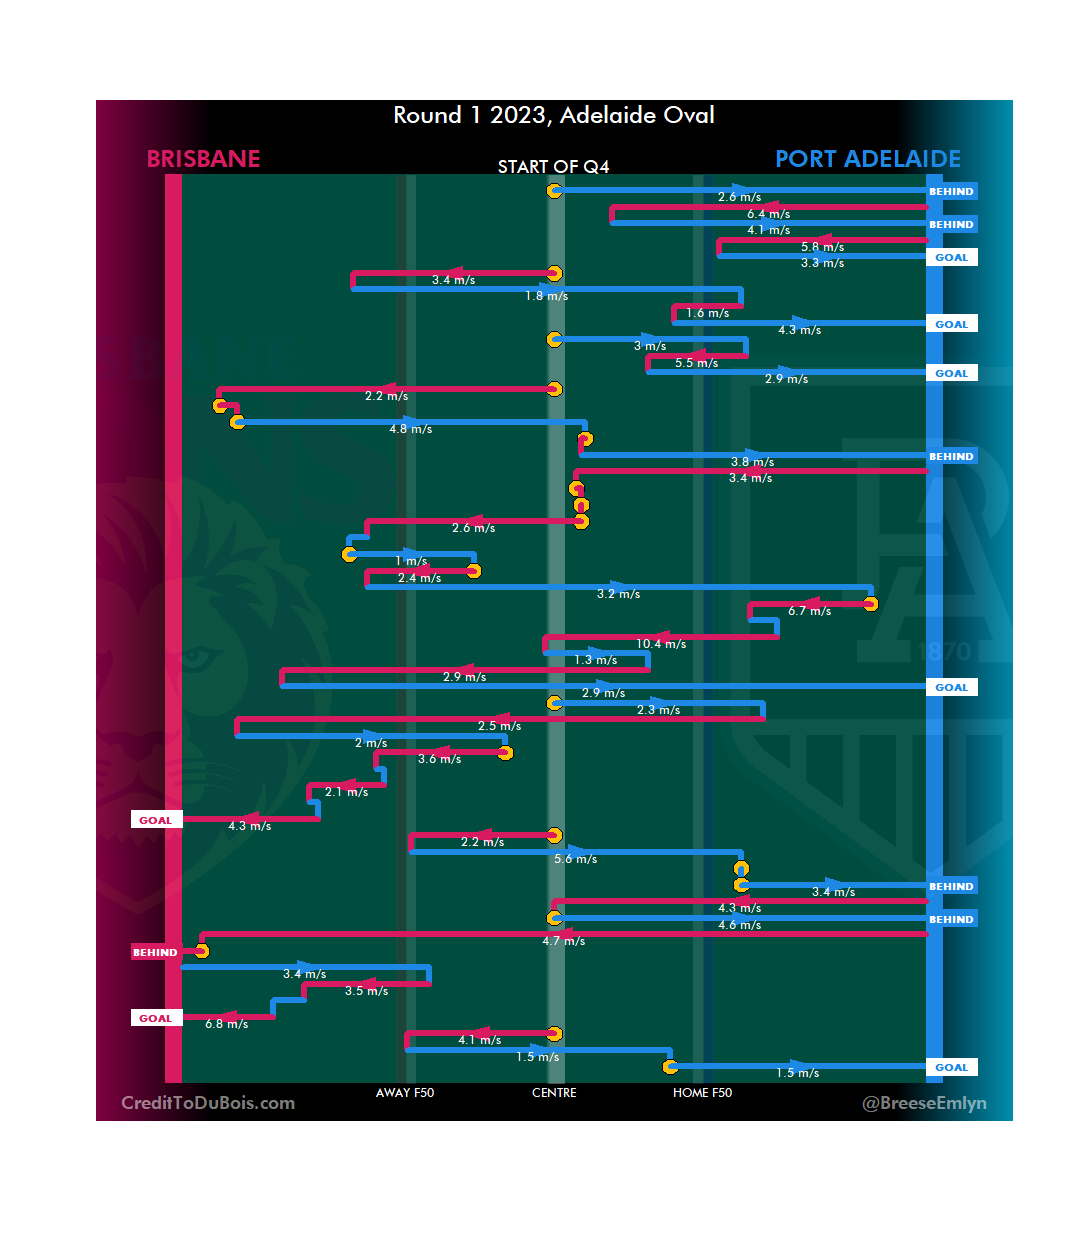
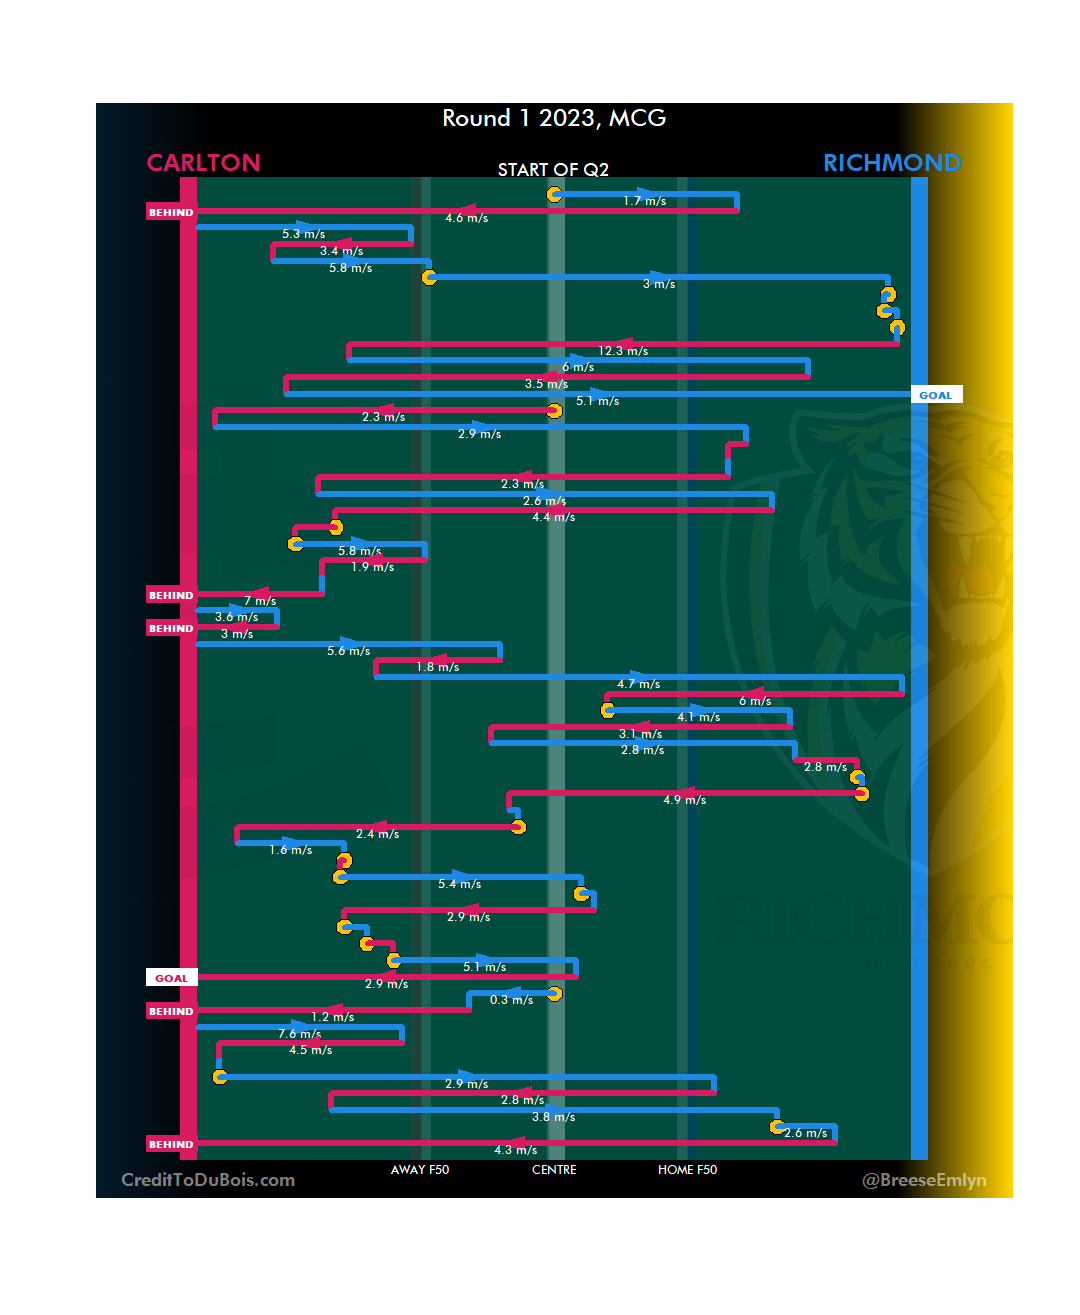
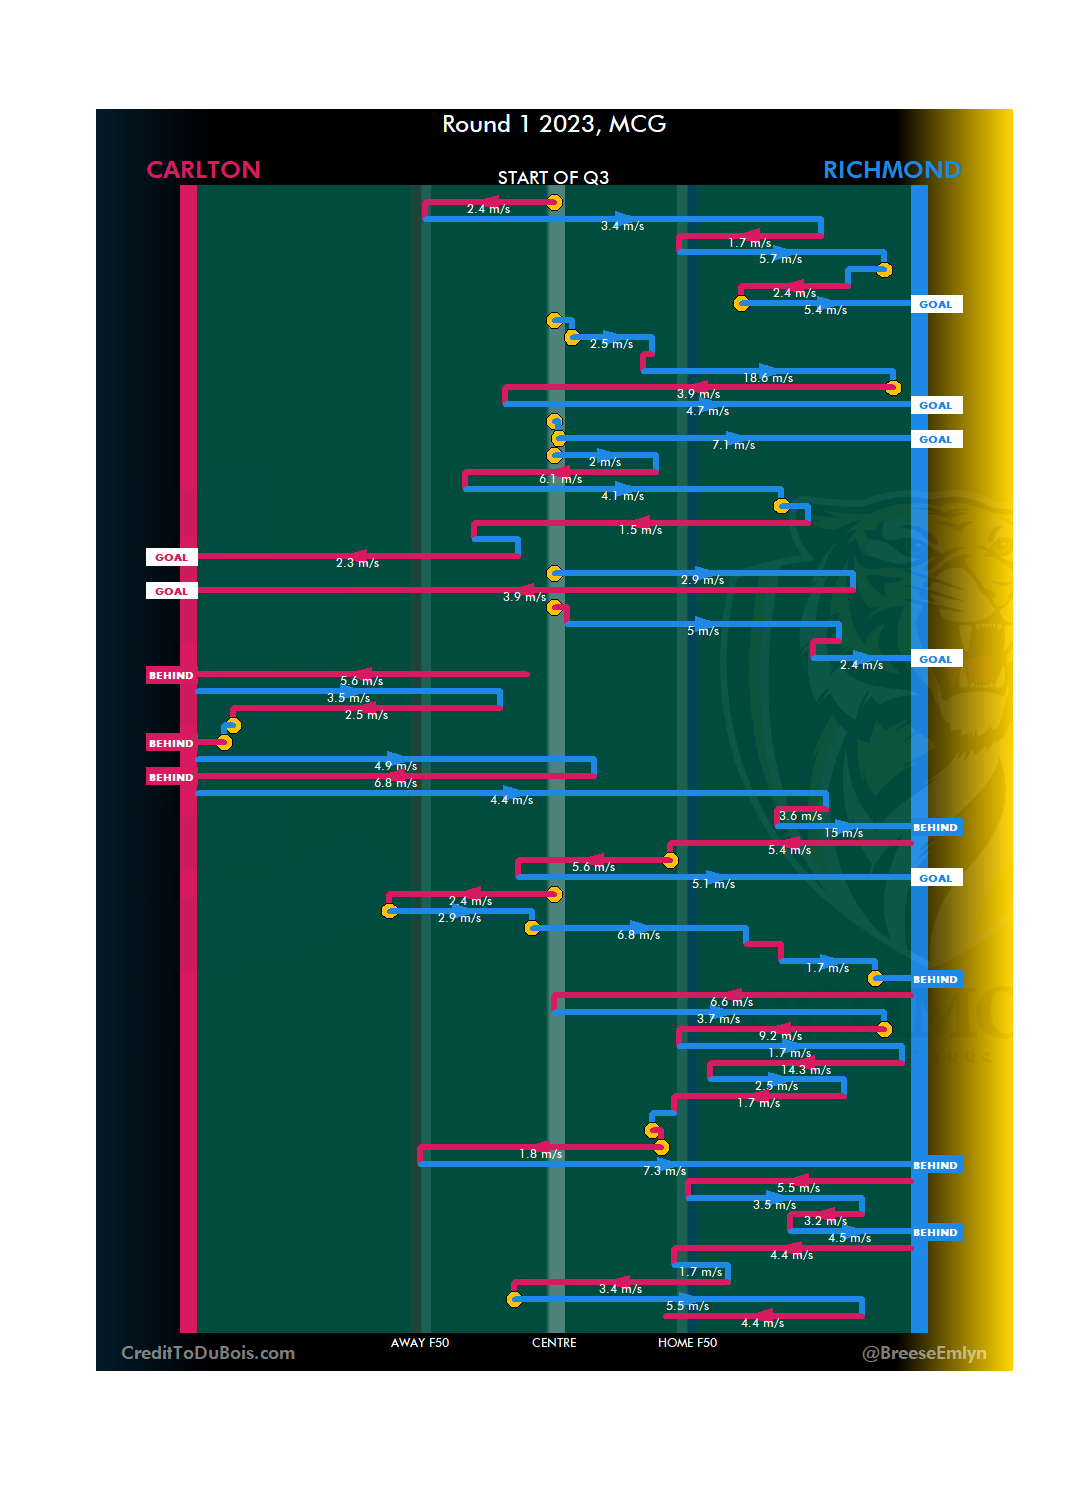
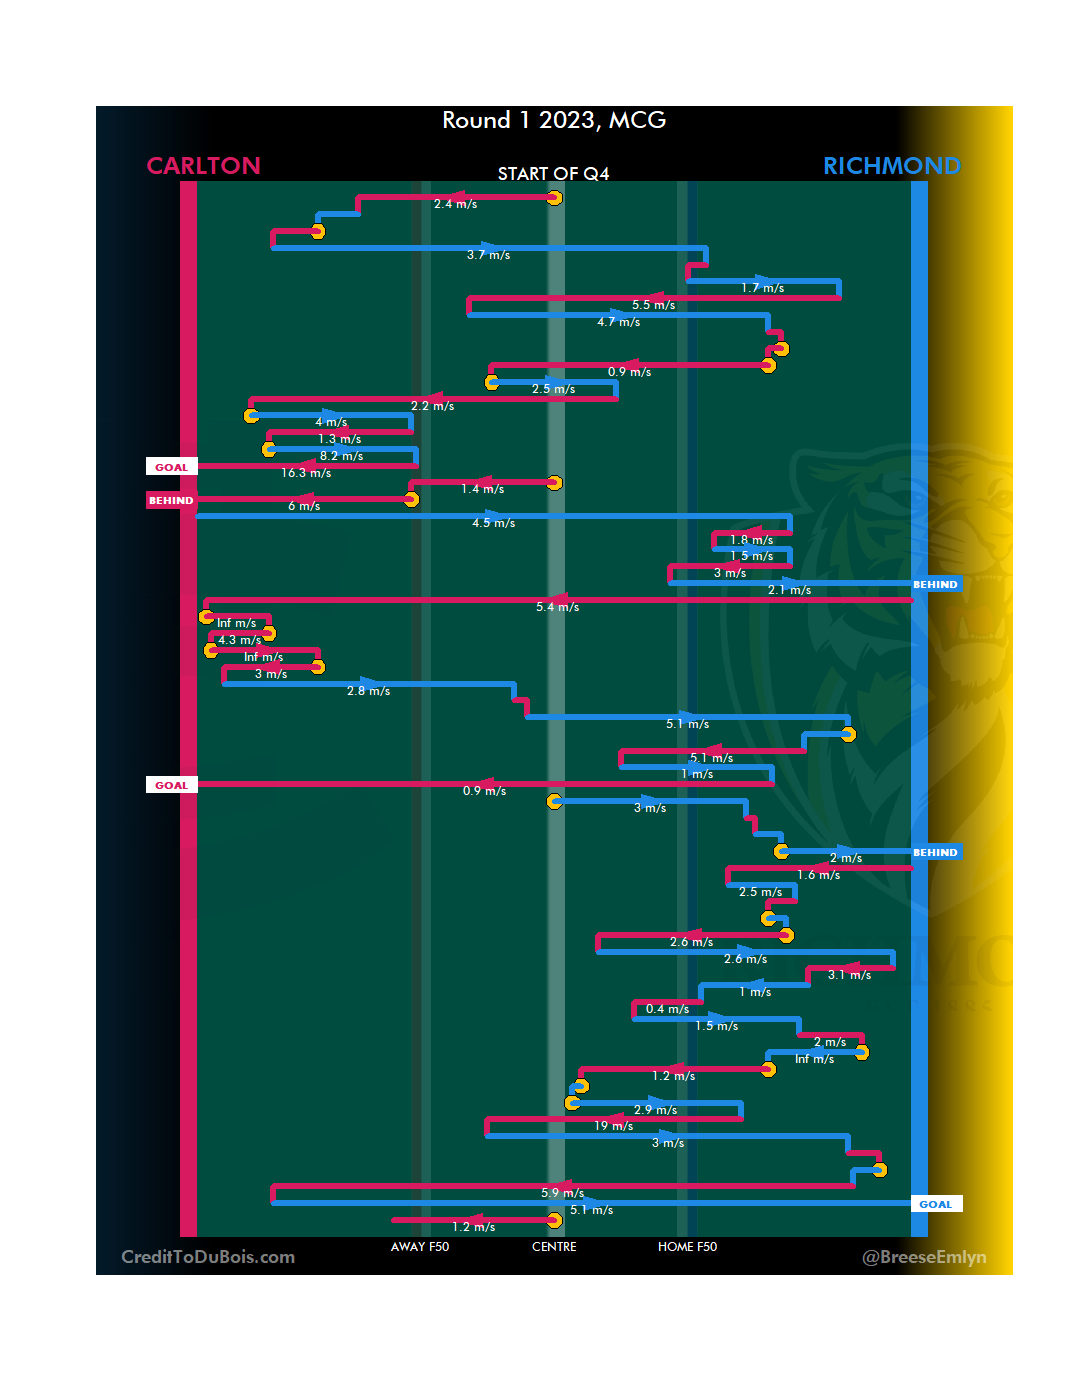
#6 Ben Miller v Carlton R1 2023
Low on technique (three on one with the one opponent on the ground, so really could have been a gather and handball) but the context bring it up significantly.
#5 Dan Houston vs St Kilda R7 2022
Decent technique (under direct physical pressure and in challenging conditions) and a F50 recovery see a solid score.
#4 Ben Miller v Hawthorn R23 2021
Critical point in the game here, but the knock on and the context within the play were average.
#3 Patrick Lipinski v Hawthorn R12 2022
Judged the ball really well and sent it to advantage, does get dinged on technique slightly because he puts it down to chance a bit by grounding the ball rather than delivering straight to his teammate.
For context if he didn’t manage to redirect it there wasn’t really anyone else who could. A go-ahead goal helps too, marked down slightly for how much time was remaining.
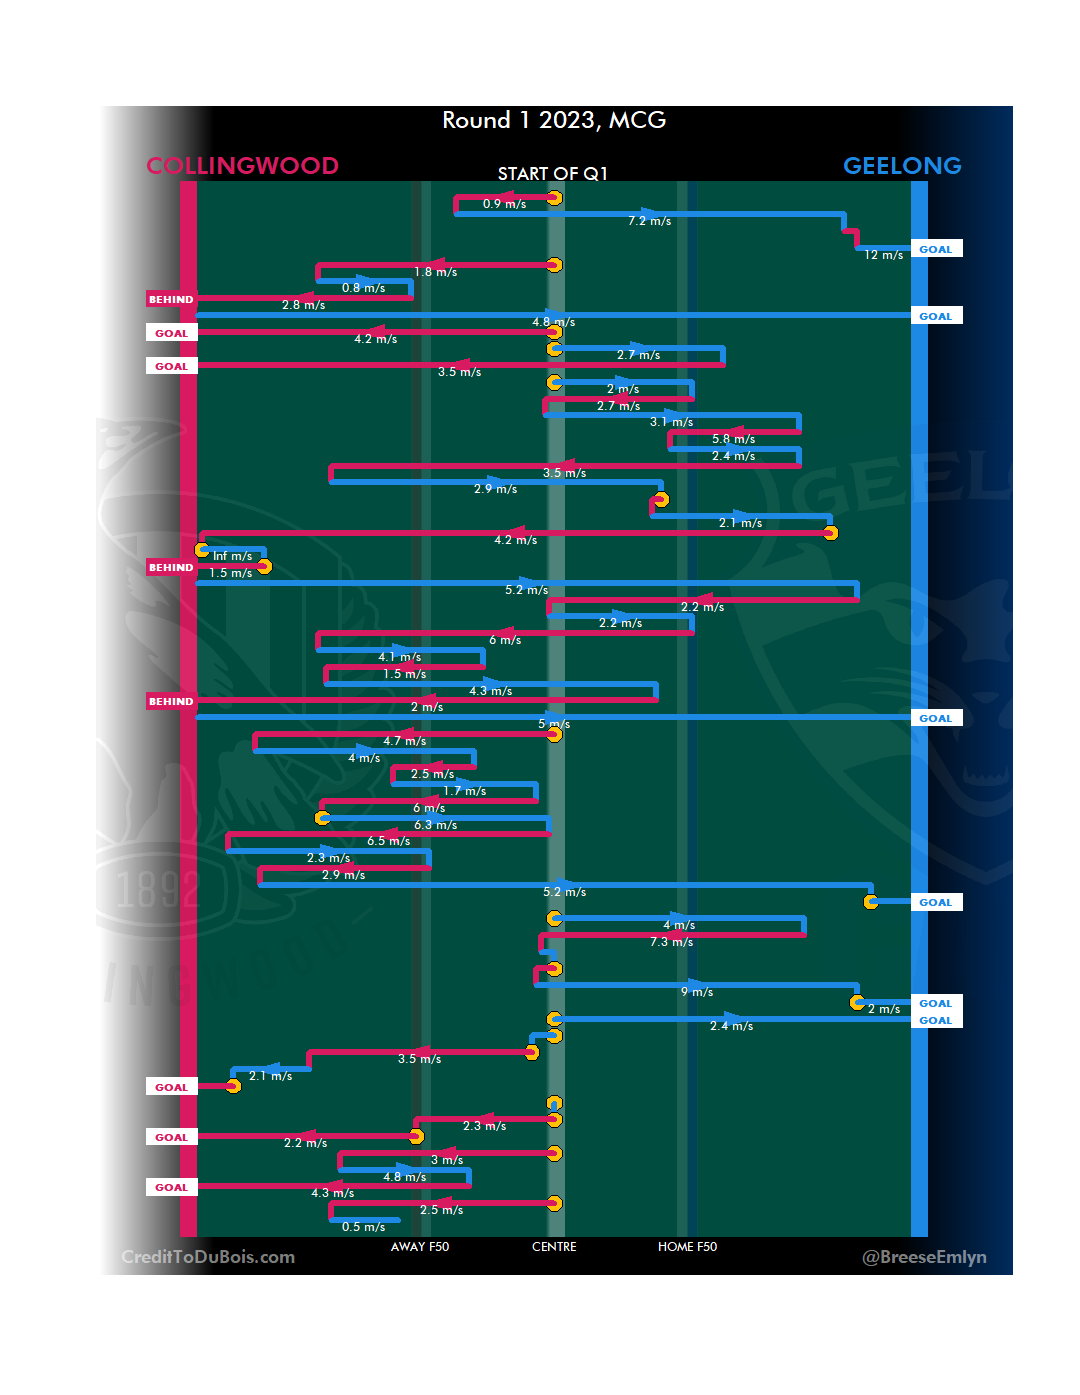
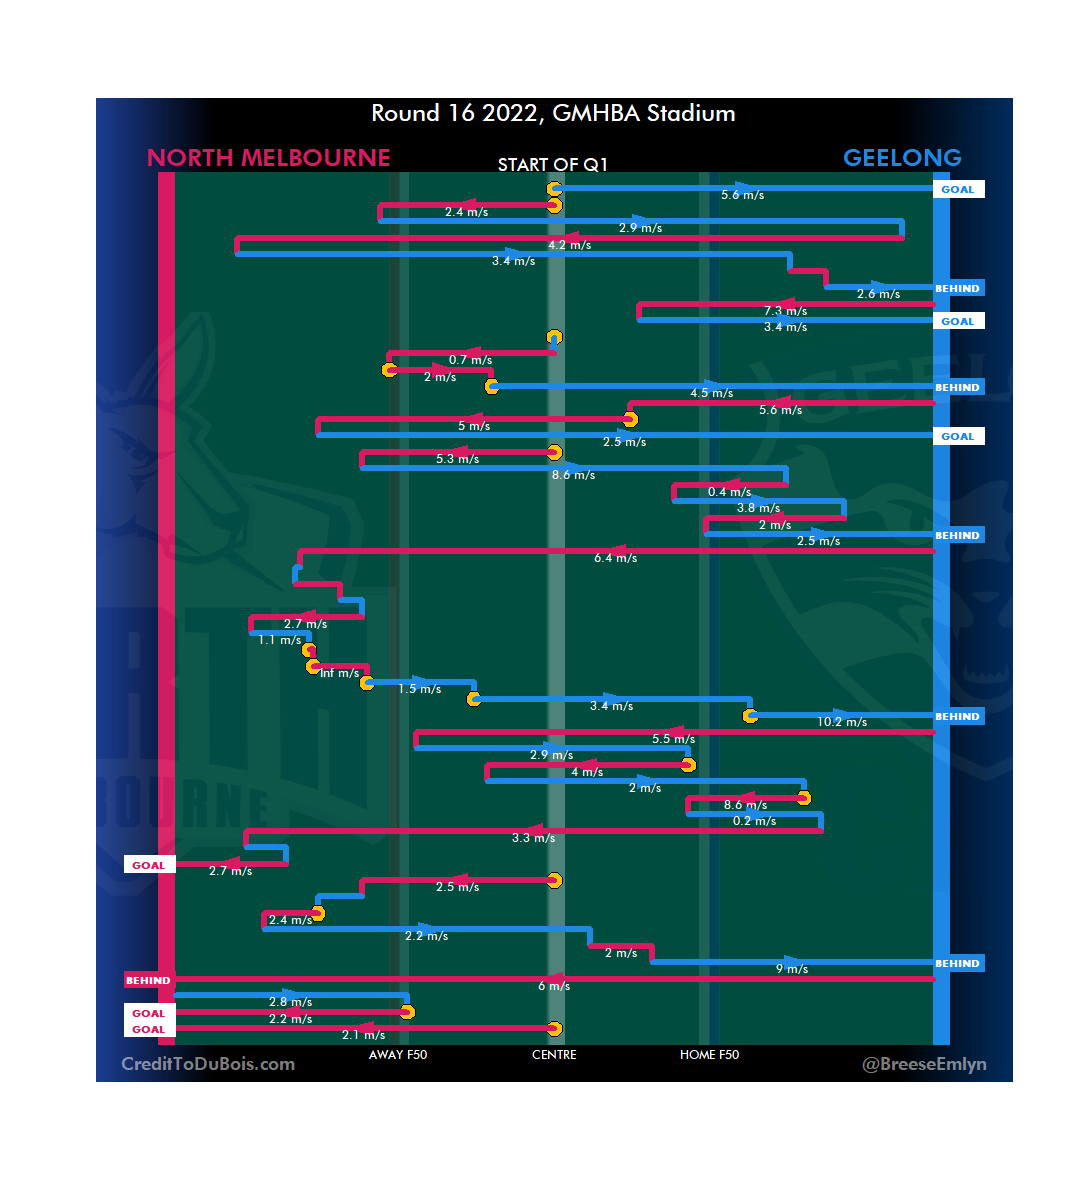
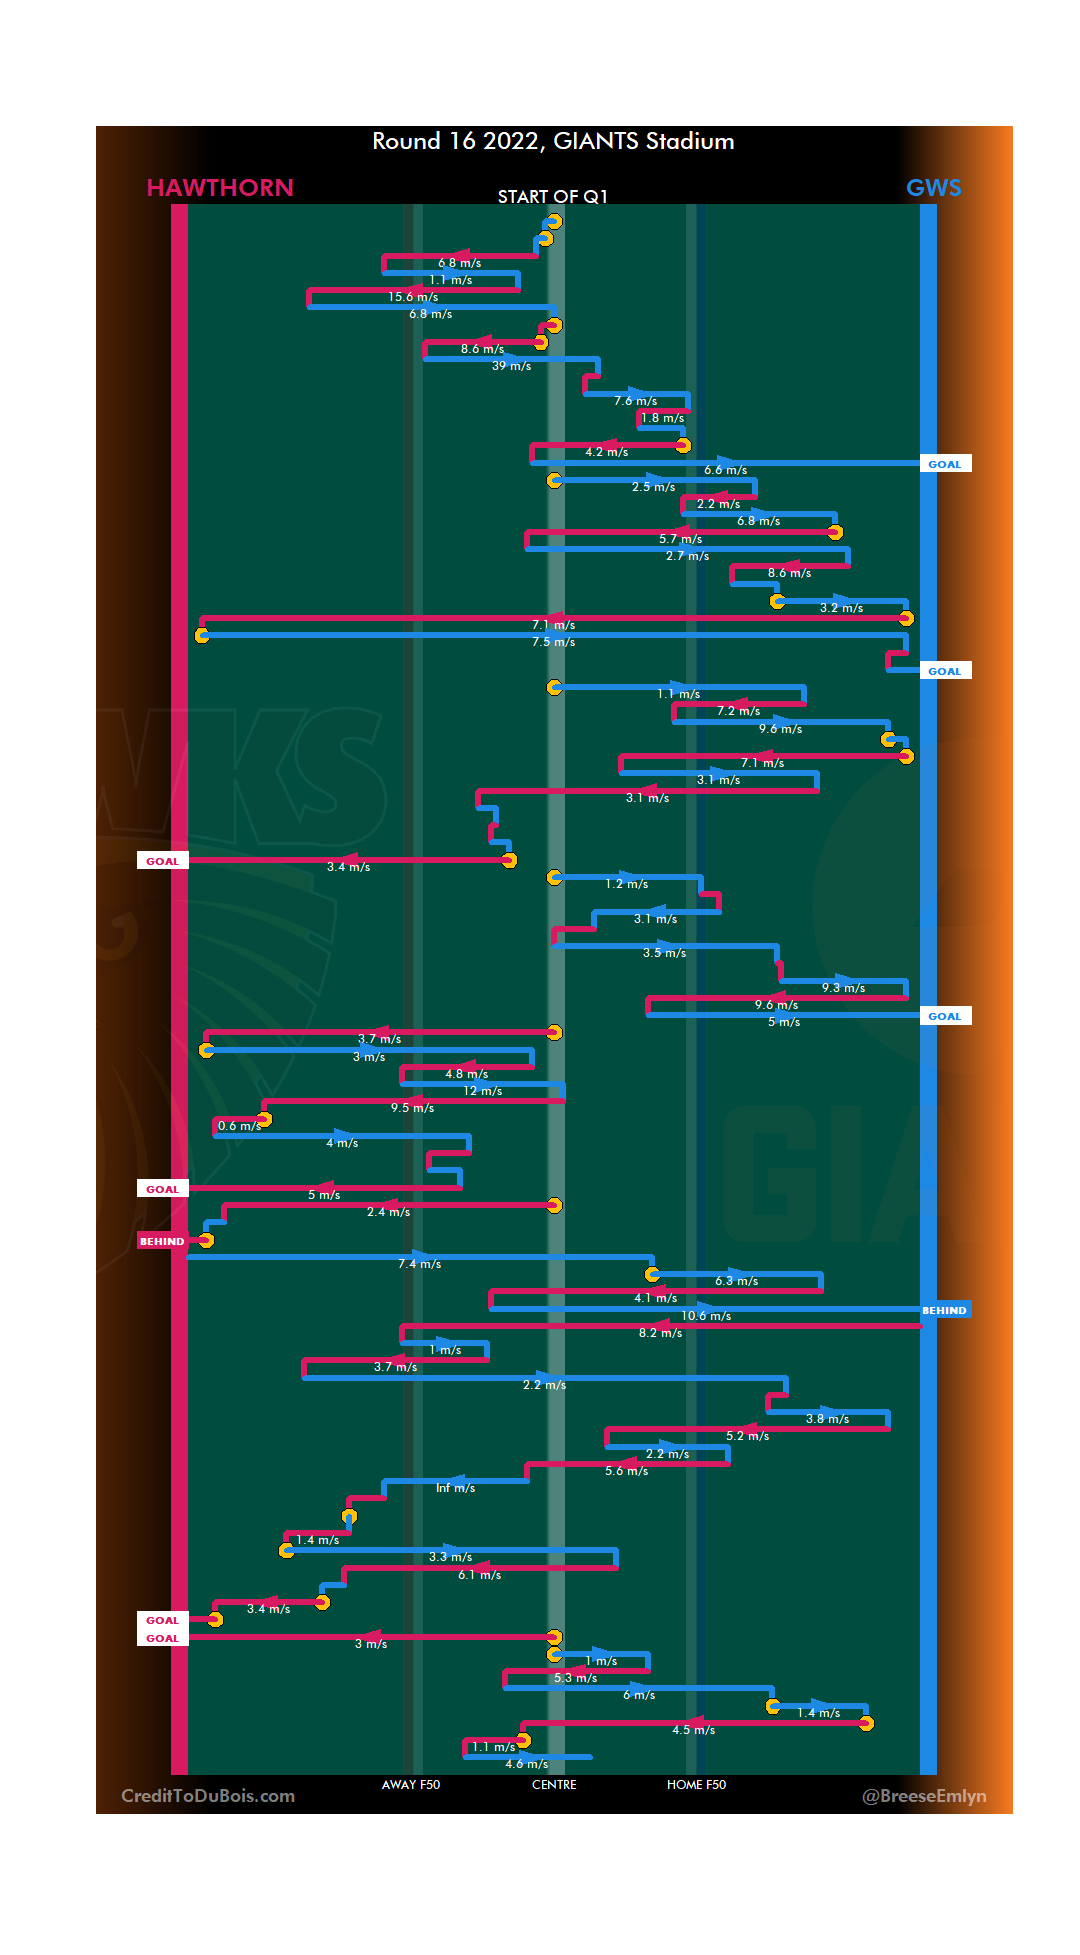
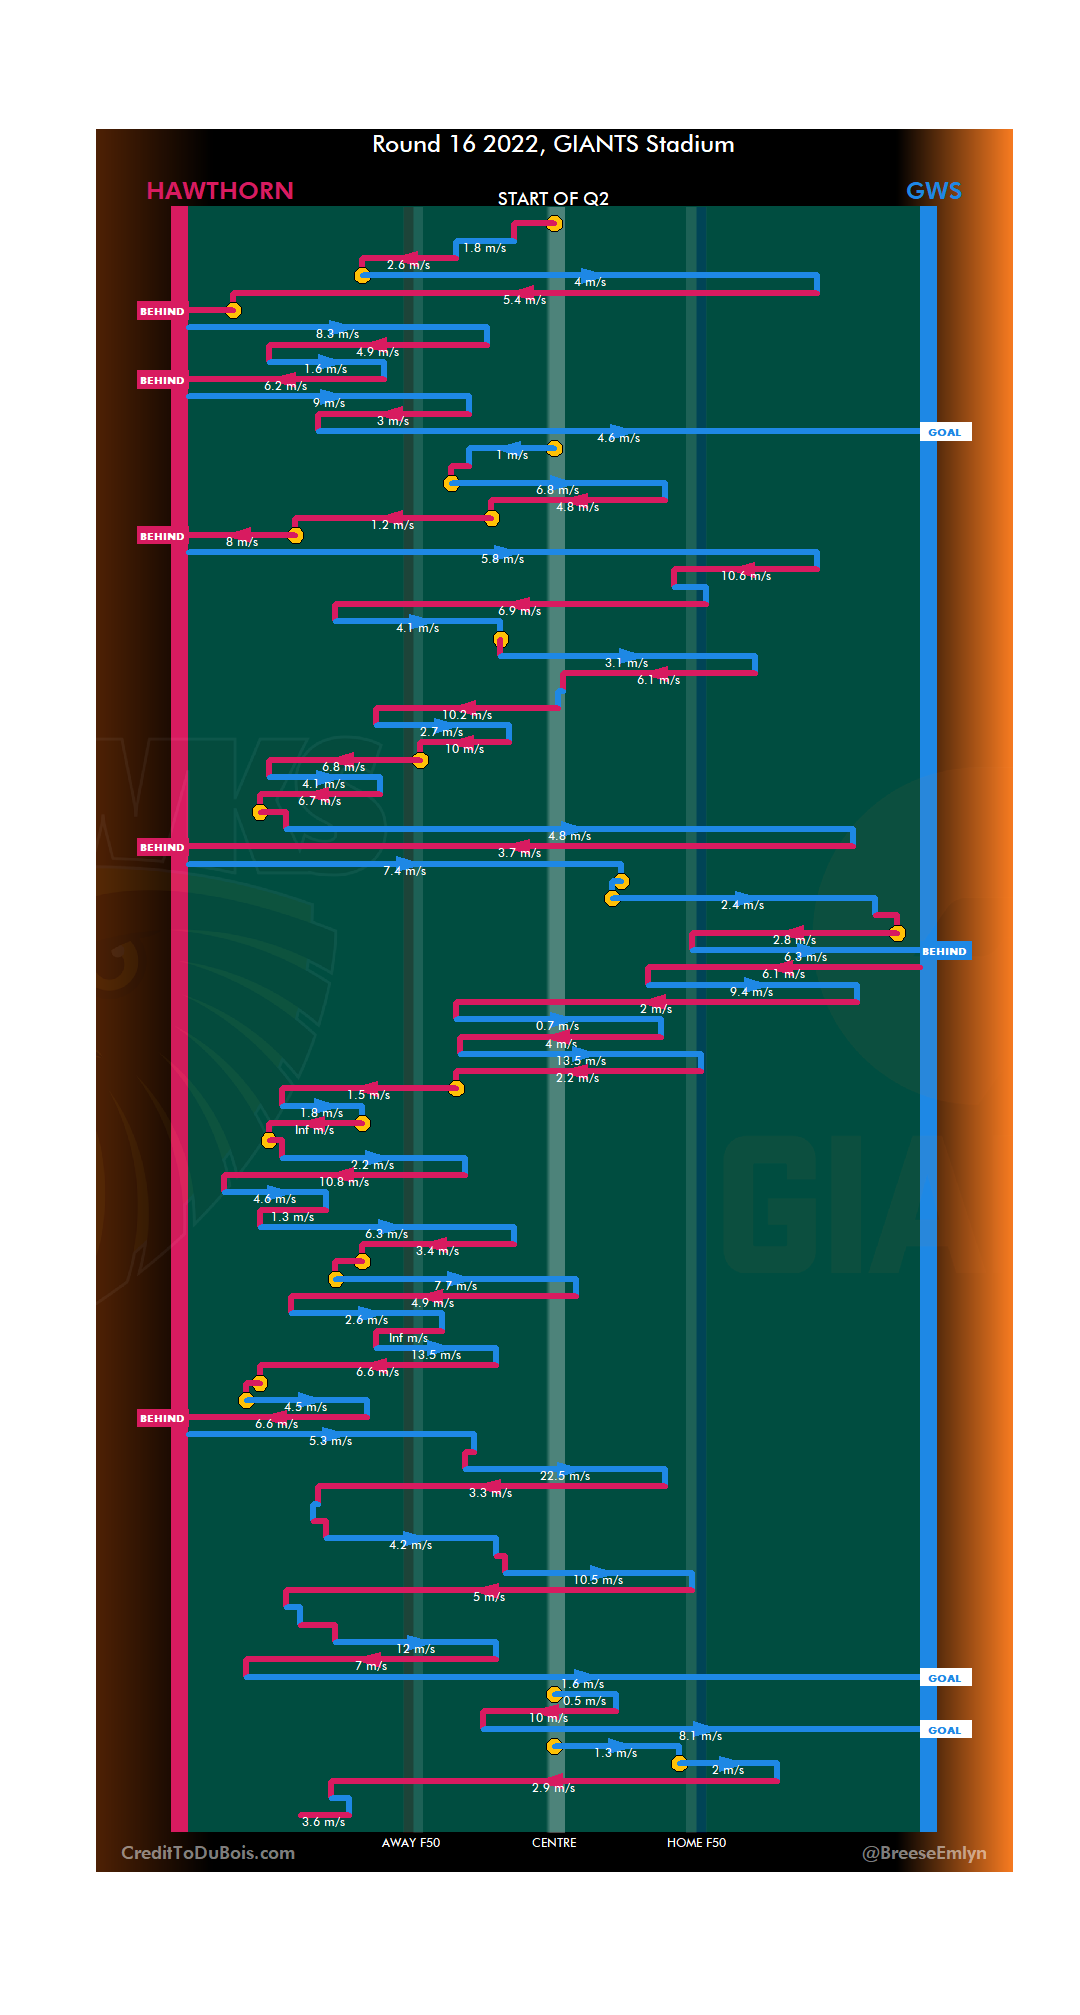
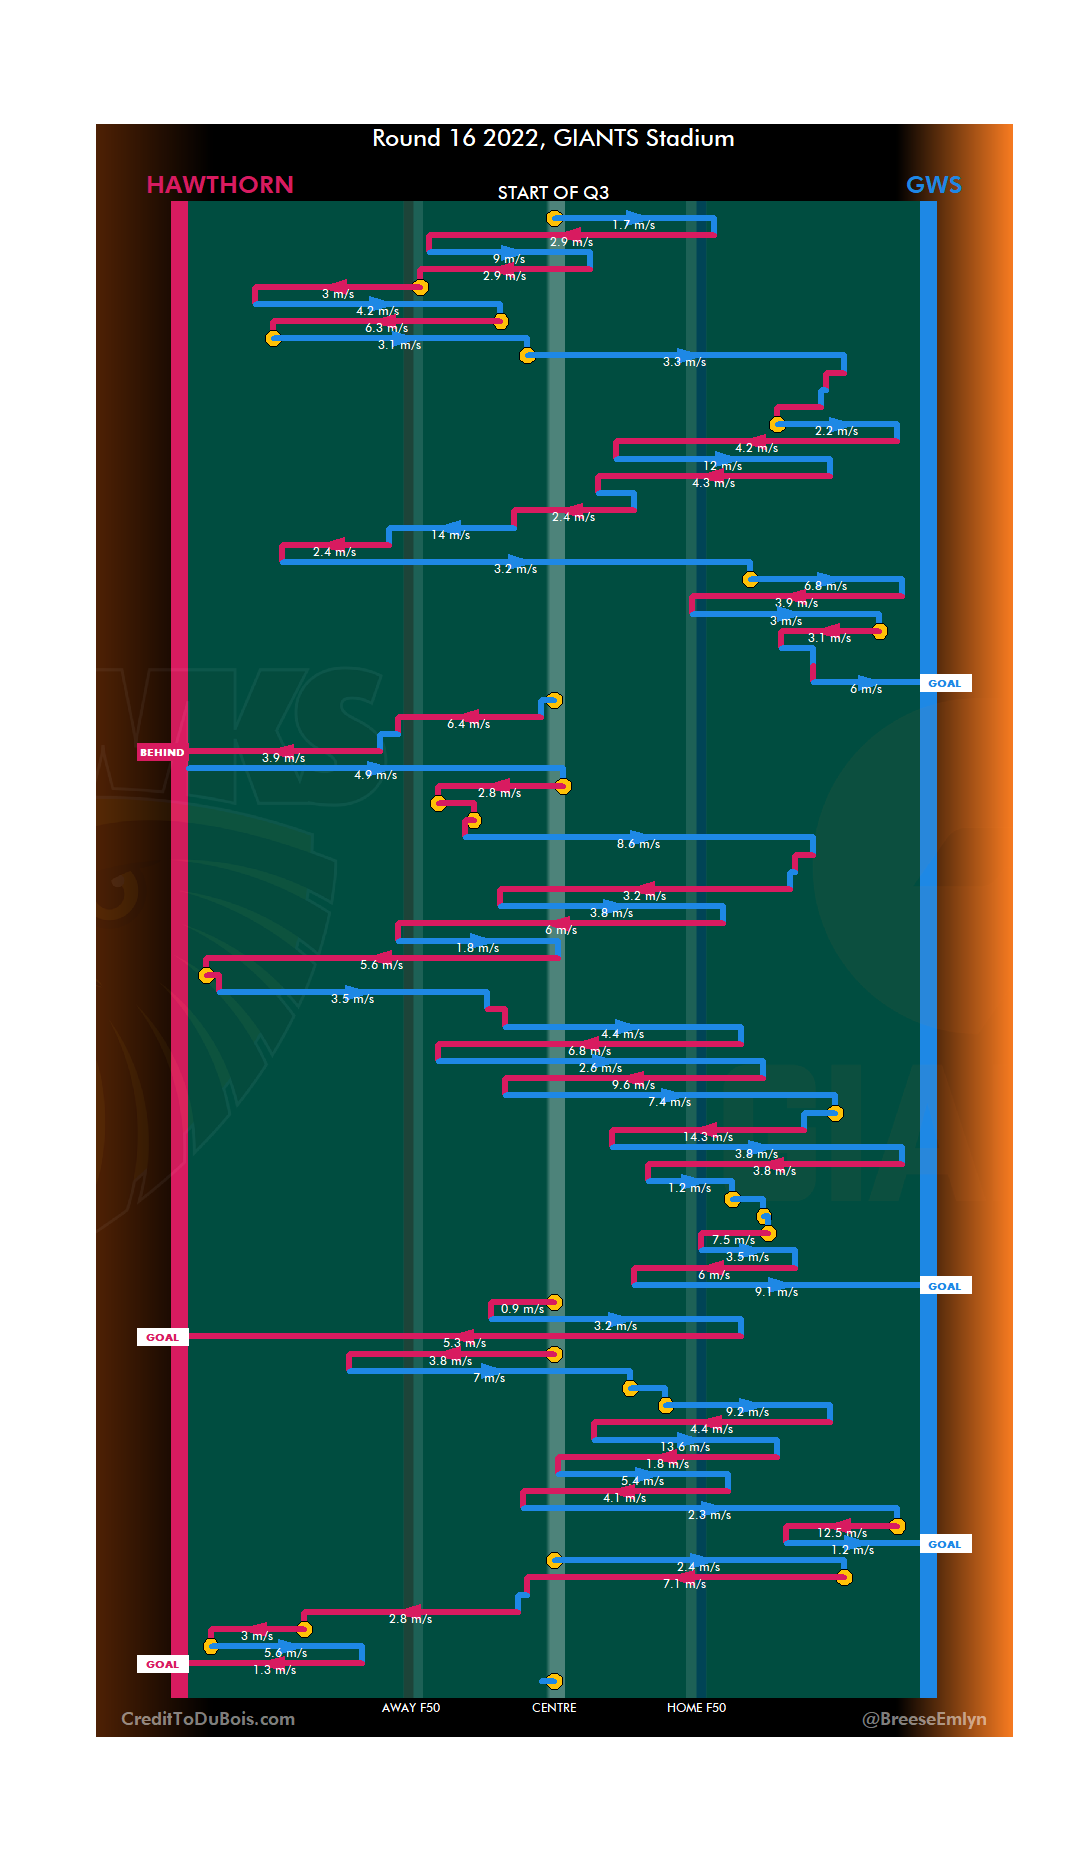
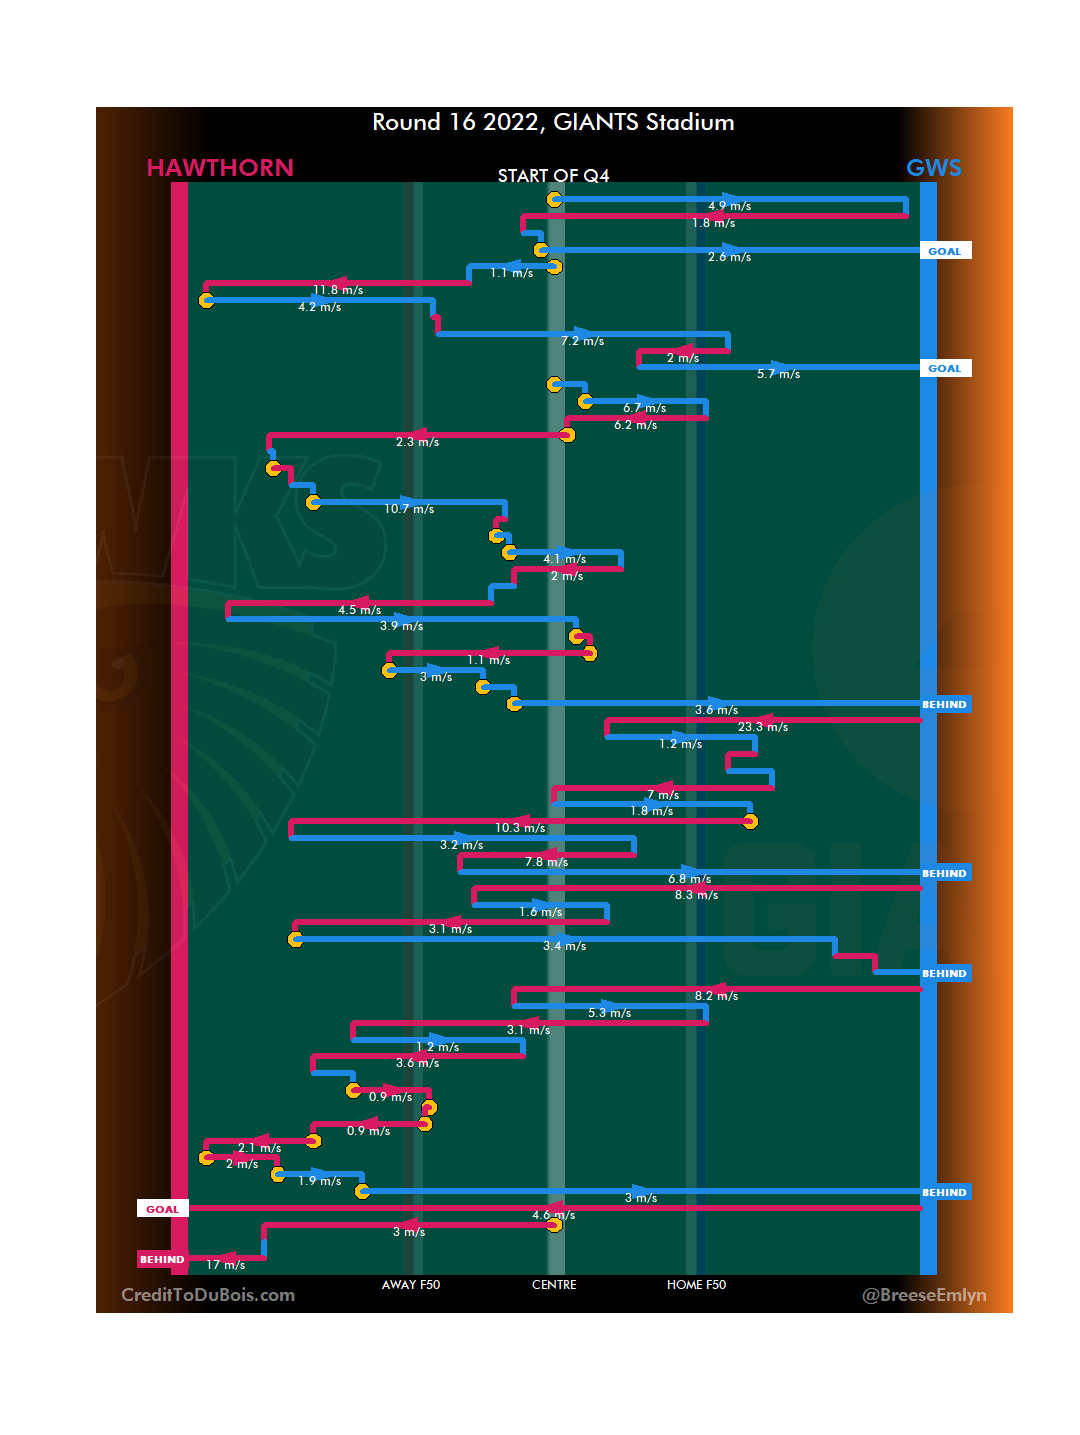
#2 Nick Blakey v Geelong R16 2023
High marks for technique – the ball is speeding away, he’s under direct physical pressure, and he taps it perfectly to a teammate’s advantage.
Some extra points from being the one to deliver a good kick inside 50, as well as the fact that Guthrie would have had a great look forward had Blakey not cut the ball off.
Loses some points because there’s still 7 minutes left to play and honestly because Fox’s shot wasn’t the actual goal. I’ve clipped it for brevity but somehow there’s another two kicks before they score between Fox’s shot dropping short and being marked by McLean, and McLean deciding he doesn’t want to take the shot either.
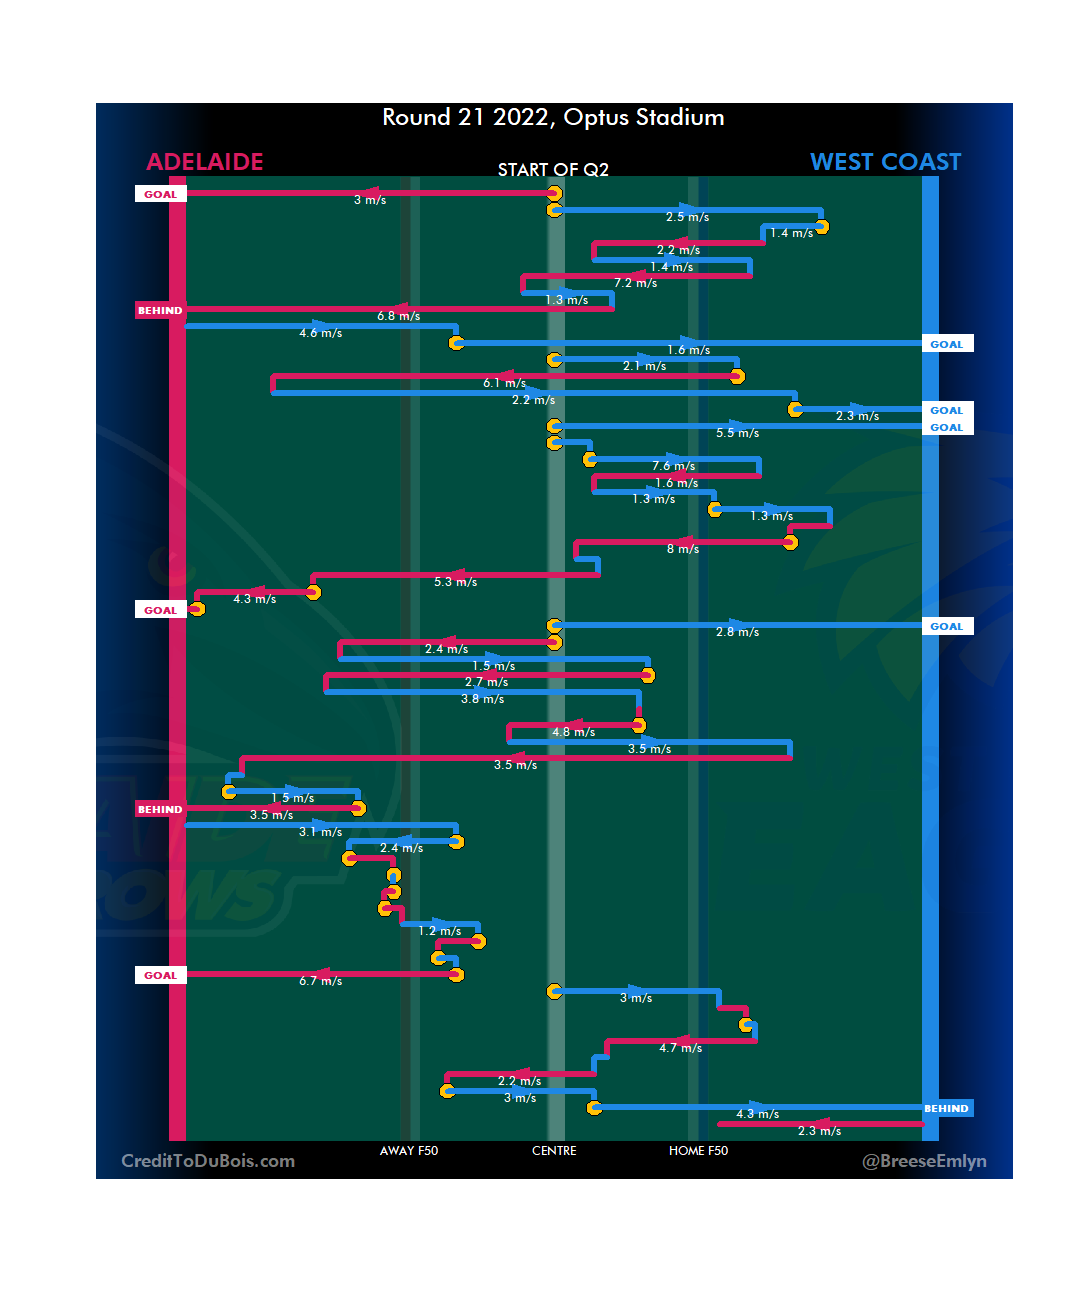
#1 Sam Powell-Pepper v Adelaide R21 2021
I’ve got this as the best technique of any of the ten, sharking an opponent’s handball and putting it right down your teammate’s throat is sublime.
If SPP didn’t intercept, the Crows had a really good path out of defence (despite being two players down with a really nasty collision seconds before).
The only thing I could mark against this was that it happened at the start of the quarter rather than at the end but it is still a very worthy winner.
Not bad for something that purportedly isn’t even a stat.
Having discovered a few new data sources, I’ve been focusing on AFLW data a bit lately. Partly because Melbourne’s performance and overall vibe is far less depressing in the W, partly because many datasets run across the entire 9 seasons of the competition.
This post focuses on a few things I’ve been able to draw out from score progression data in AFLW from the first match up to the end of the 9th Home & Away season in 2024.
Time in front
Time in front is a metric commonly used across sport. Let’s cast our nets broader than a single game. Below I’ve ranked the teams based on how much of their total gametime (in home and away games, not finals) they’ve spent in the lead.
The composition of the top four shouldn’t be much of a surprise to long-term followers of the league although the order might be. Leading up to this post I ran a twitter article asking who people thought would be ranked #1, with Adelaide being the #1 choice. This is understandable given they’re in the lead on premierships, but as we’ll see a bit later they haven’t been without their dips.
Over the course of AFLW seasons 1-10, who do you reckon has spent the highest percentage of their game time in the lead
There’s a clear gap between the top 4 and the rest on this metric. We can see a fairly even tapering off through the remaining teams right down to West Coast.
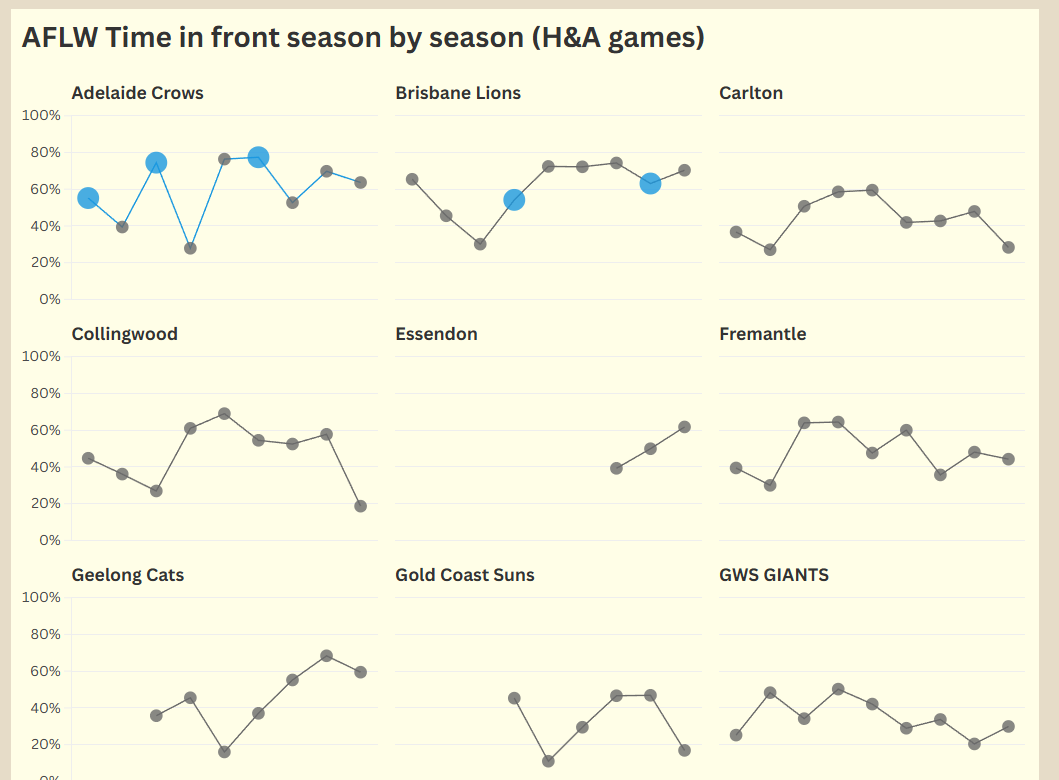
Now let’s look at individual seasons, again only for Home and Away games. In the below graphs we’ve just isolated time in front, and I’ve highlighted the team that would go on to win the premiership in each year (2020 having no premiership awarded after the season was abandoned due to the COVID-19 pandemic.)
As I mentioned, you can see Adelaide has a fair bit of up and down there. Their characteristic more than anything else has been winning when it matters.
As you’d expect there’s a relatively strong link between time in front and ultimate success. The highest time in front of a H&A season predicting four of the seven premiers so far and a runner-up.
The single most dominant performance by this metric was Melbourne’s 2022 (s7) effort, leading from the first score to the final siren in 7 of their 10 matches.
On the flip side the worst performance is clearly Richmond’s maiden campaign. In their winless 2020 they held the lead for 9m 4s in the first quarter against the Suns in Round 2, and two periods of 1m19s and 1m27s against Geelong in Round 4.
We can also look at changes from season to season.
The biggest season-on-season drop comes from the Bulldogs from their premiership in 2018 to 2019, and it’s one they’ve never fully recovered from. This is no real surprise, as they lost Emma Kearney (Club B&F winner 2017+18, Coaches Association MVP 2018, League B&F 2018) after the 2018 season, and this was compounded with the loss of captain and leading goalkicker Katie Brennan after the 2019 season.
Adelaide provides both a dip and a bounce, with a poor 2020 season sandwiched between strong showings. Adelaide was perhaps uniquely impacted by COVID-19 public health restrictions, as portions of the list were Northern Territory based and the bulk South Australia based. This was compounded by Erin Phillips, clearly the dominant player of the game at the time, playing only two of a possible six matches as she returned from an ACL injury.
Other than Adelaide’s rebound, the next best season-on-season improvement is the current McLelland Trophy winning Hawthorn squad. A lot of reasons have been ascribed to their rise but I’m firmly of the belief it rests largely on taking Eliza West and Casey Sherriff away from us at Casey Fields.
Game by game
Let’s zoom in now to looking at individual games. Tony Corke over on MatterOfStats has done some super interesting work in trying to categorise archetypes of games in AFLM based on how the margin progresses over time (here and here for some examples).
I’m not going to do anything as complicated as Tony has done (maybe at a later date, no promises though). Instead I’m going to try to identify close or interesting games by a couple of parameters.
First, and simplest, most lead changes.
The most lead changes in an AFLW game to date has been in Round 7 this year, Richmond vs Geelong with 11.
On the flip side, of the 582 AFLW games played to date just under a third have seen the loser never in front on the scoreboard.
If we look at individual quarters there have been two occasions where the lead has changed 5 times in a quarter. Q1 of Fremantle v GWS (R2 2022 (s6)) and the 4th quarter of the aforementioned Richmond v Geelong game.
Another thing to look for would be particularly intense passages of play. Where have the most lead changes occurred in the shortest period of time?
The shortest time between two lead changes is 42 seconds in Round 6 2023. Jasmine Garner gave the Roos the first behind of the game at 0:39 before Aine Tighe put the Dockers in front with a goal at 1:21.
That same section of play also gives us the quickest three lead changes, when Tahlia Randall returns the Roos to the lead another 97 seconds later.
Jacqueline Parry goals for a 1 point Geelong lead @ 13:04
Orla O’Dwyer restores a 5 point Brisbane lead @ 14:39
Chloe Scheer puts Geelong back in front @ 15:56
Dakota Davidson goals for Brisbane @ 17:54
Let’s also have a look at where a team has snatched an unlikely win – represented by the least time spent in front by the eventual winner.
There’s a clear winner here – it’s Fremantle vs Melbourne in Round 4 2024 in which Aisling McCarthy kicked a goal after the siren with the dockers never having led during the match.
The dataset I go off has this recorded as holding the lead for three seconds of game time – I think representing the gap for the umpire to signal the goal, but common sense dictates us to record this as a flat 0% time in front for the win.
The next closest also came this year in Round 10 with Gemma Houghton snatching victory for the Power at the absolute death. While Freo had tied the scores up against Melbourne for a bit, the Power had trailed ever since 2:21 into the first quarter.
Player by Player
That brings us nicely to our final section on player by player breakdowns.
Let’s start off with which players have kicked their teams into the lead most frequently.
With that kick last week Gemma Houghton (17 times with a goal and 5 times with a behind) tied Caitlin Greisier (16 x goal, 6 x behind) – leading the competition in having put their team into the lead on 22 occasions.
Within the one game, on 5 occasions a player has taken the lead three times in a single game:
Three of Sarah Perkins four goals resulted in a lead change for the Crows in Round 7 2017.
Each of Richelle Cranston’s goals put Melbourne in front in Round 1 2018.
Teagan Cunningham was responsible for all three times Melbourne took the lead in Round 3 2019.
Jacqueline Parry put the Cats in front three times in Round 7 2024.
Katie Brennan put Richmond ahead of the Bombers three times in their draw in Round 9 2024.
The last thing I want to look at today is career goals progression.
Eight players have held (individually or tied) the record for most career goals in AFLW at some point during the competition.
Jasmine Garner, Darcy Vescio, and Lauren Arnell were the first three goal scorers in the competition in Round 1 2017.
Darcy Vescio kicked another three that day taking the outright lead, leaving Garner (8 minutes 53 seconds) and Arnell (1 minute and 22 seconds) with modest reigns.
The most recent change is Kate Hore reclaiming the title from Danielle Ponter at 2:02 last Saturday.
And below you can find the progression over time. I tried for a long time to get it reflecting changes within matches, but Flourish was having absolutely none of that (ended up being too many individual points in time I think).
That feels like about enough for now. Hopefully this serves as a fun distraction in some quite shitty times. If you’ve got suggestions for things you’d like me to look at in future the best place to hit me up are socials on the top banner.
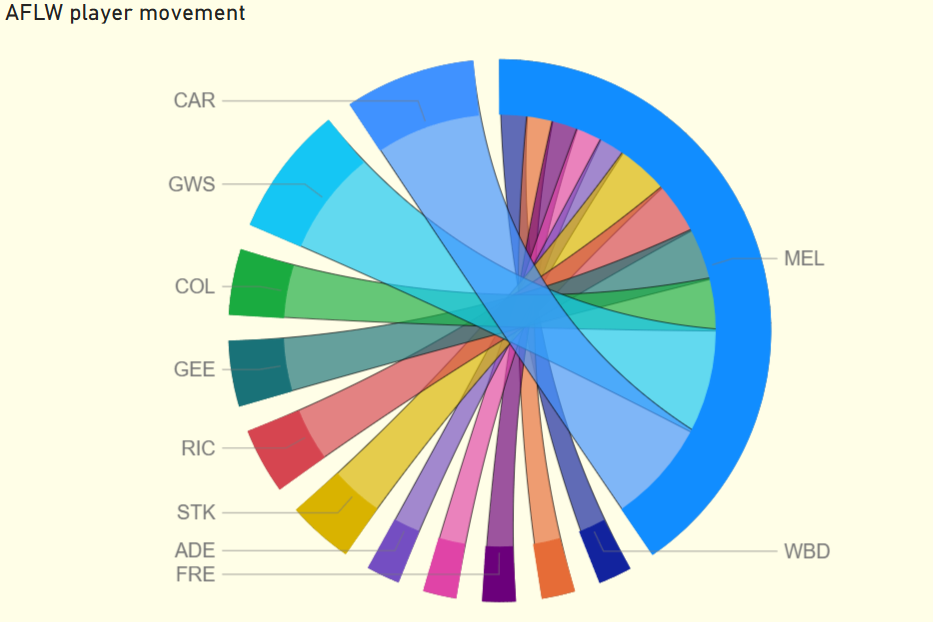
I’d previously done a post on charting AFLW player movement. Since then I’ve learned some new techniques and tools so thought it was time for an update.
In the below PowerBI dashboard you can filter by which teams players have left or joined, seasons, and whether you want to look at movements that happened from one season to the next or where there was a gap (still only reflecting one team to the next, so Tayla Harris would appear as Brisbane to Carlton and Carlton to Melbourne, but not Brisbane to Melbourne.)
The visualisation will adapt to whatever filters you select, and there’s a list down the bottom of all the player movements meeting those criteria.
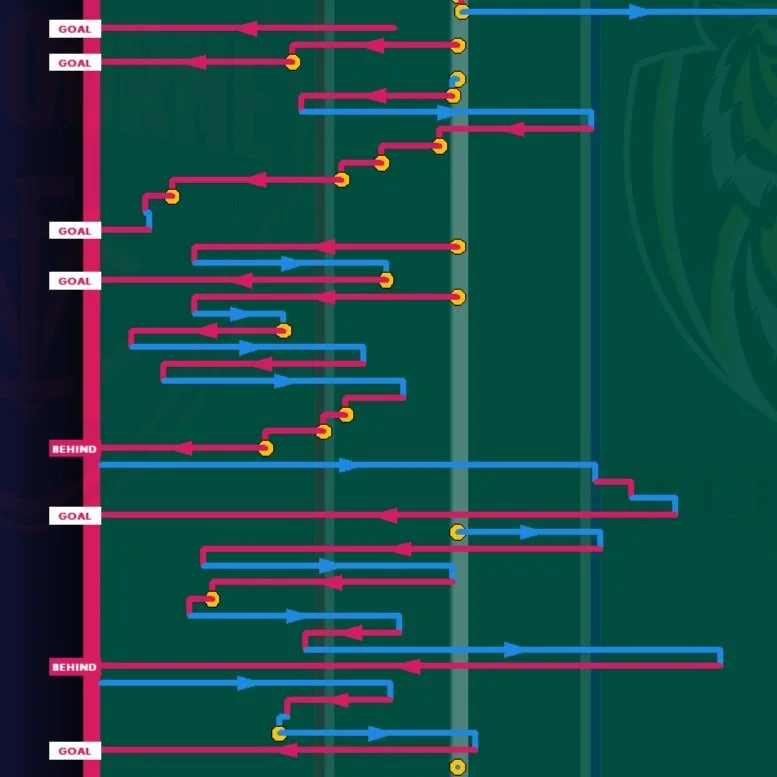
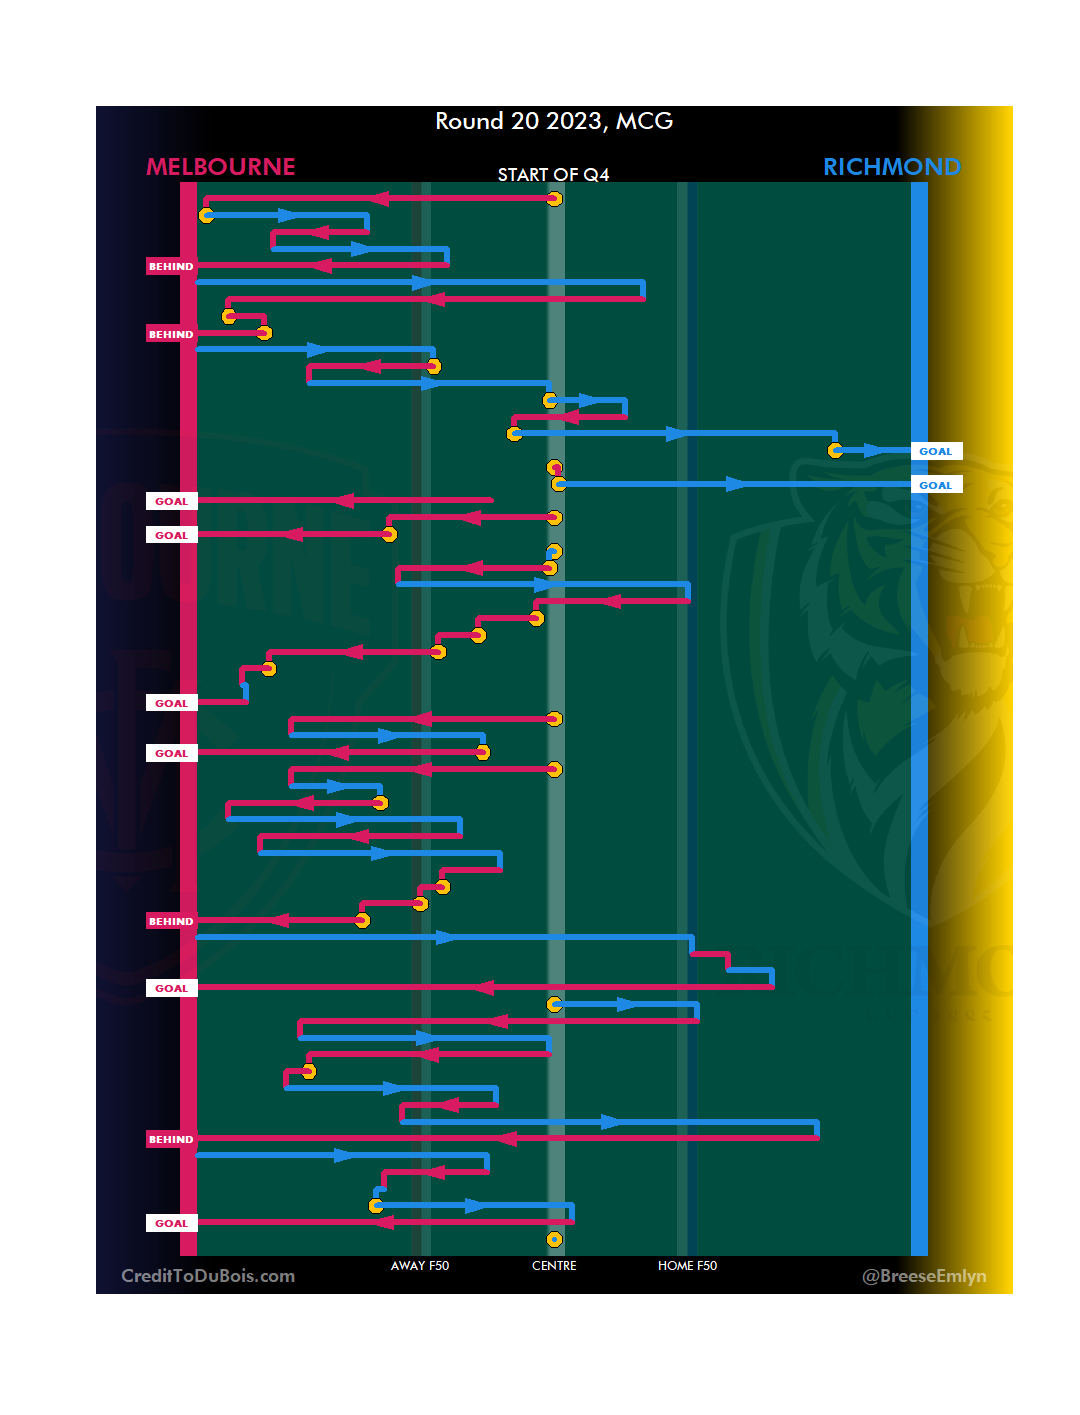
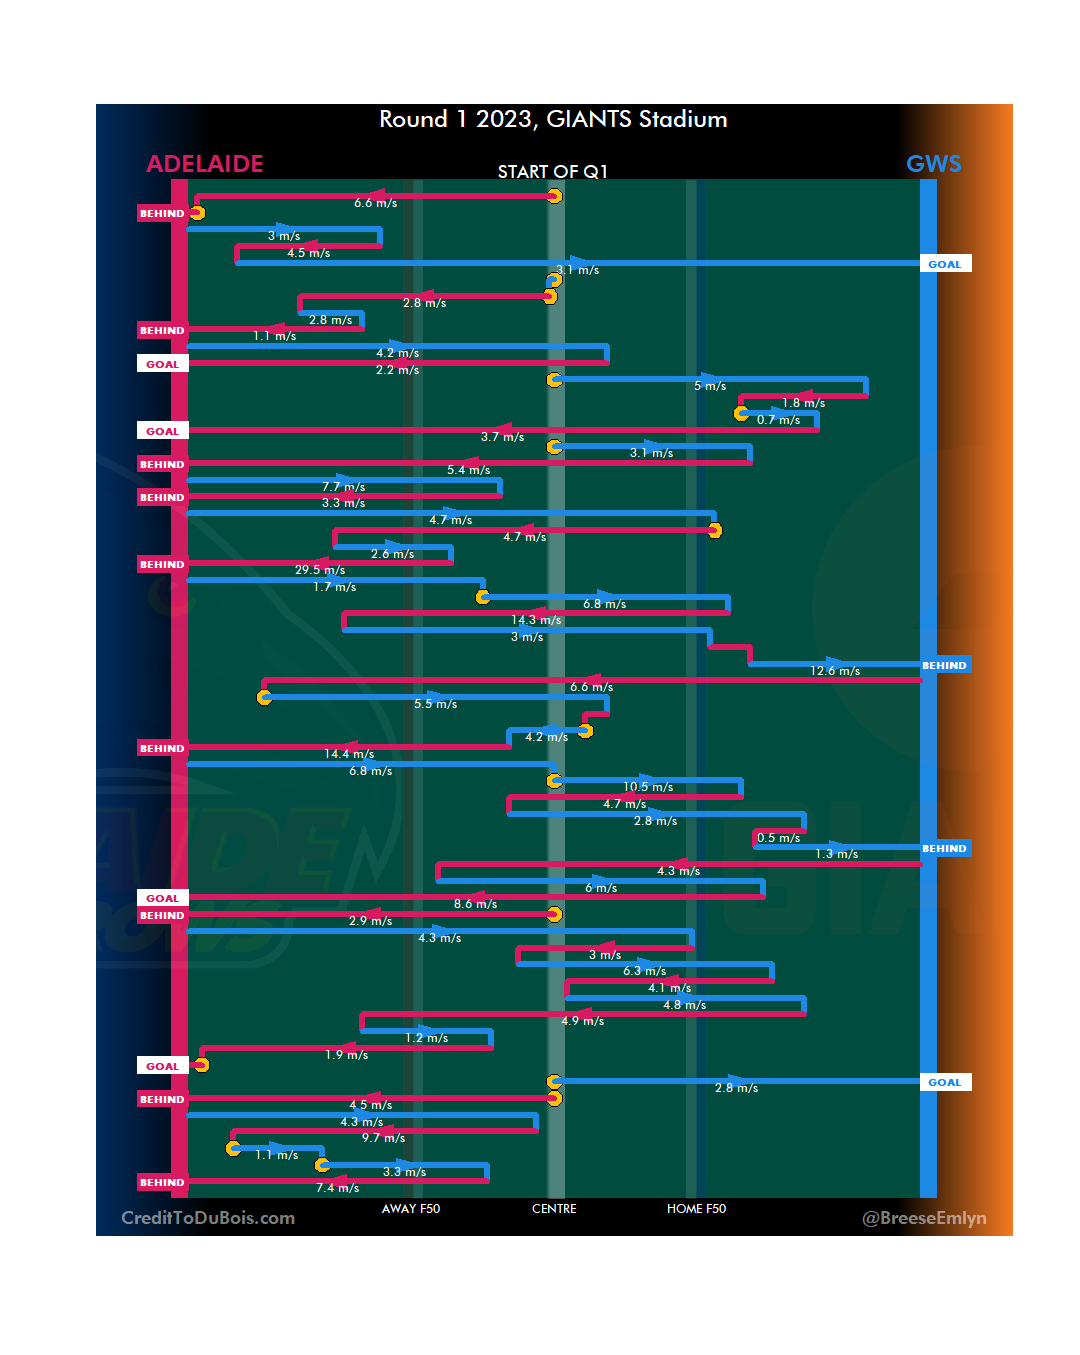
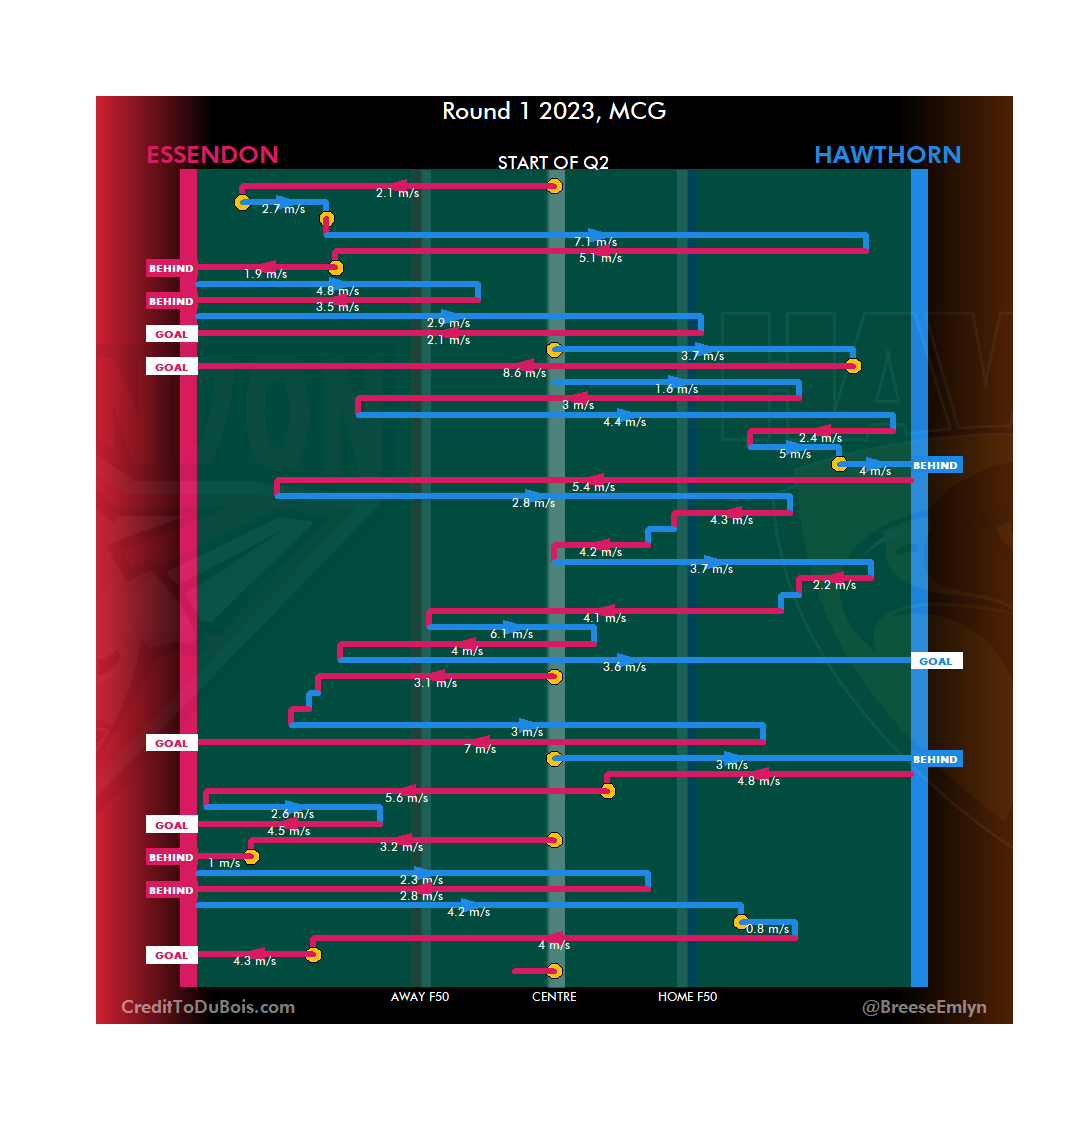
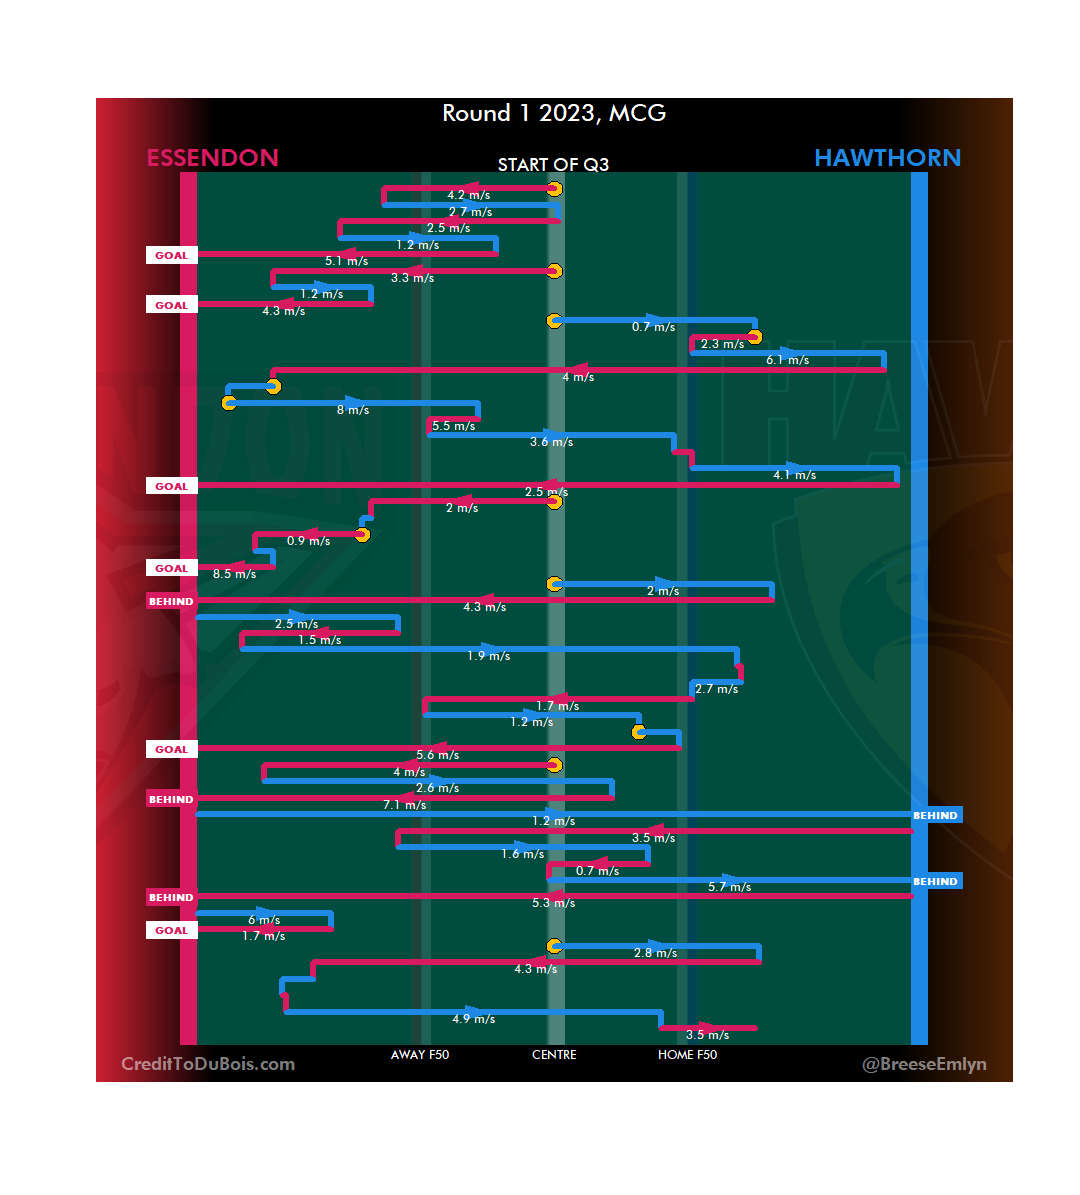
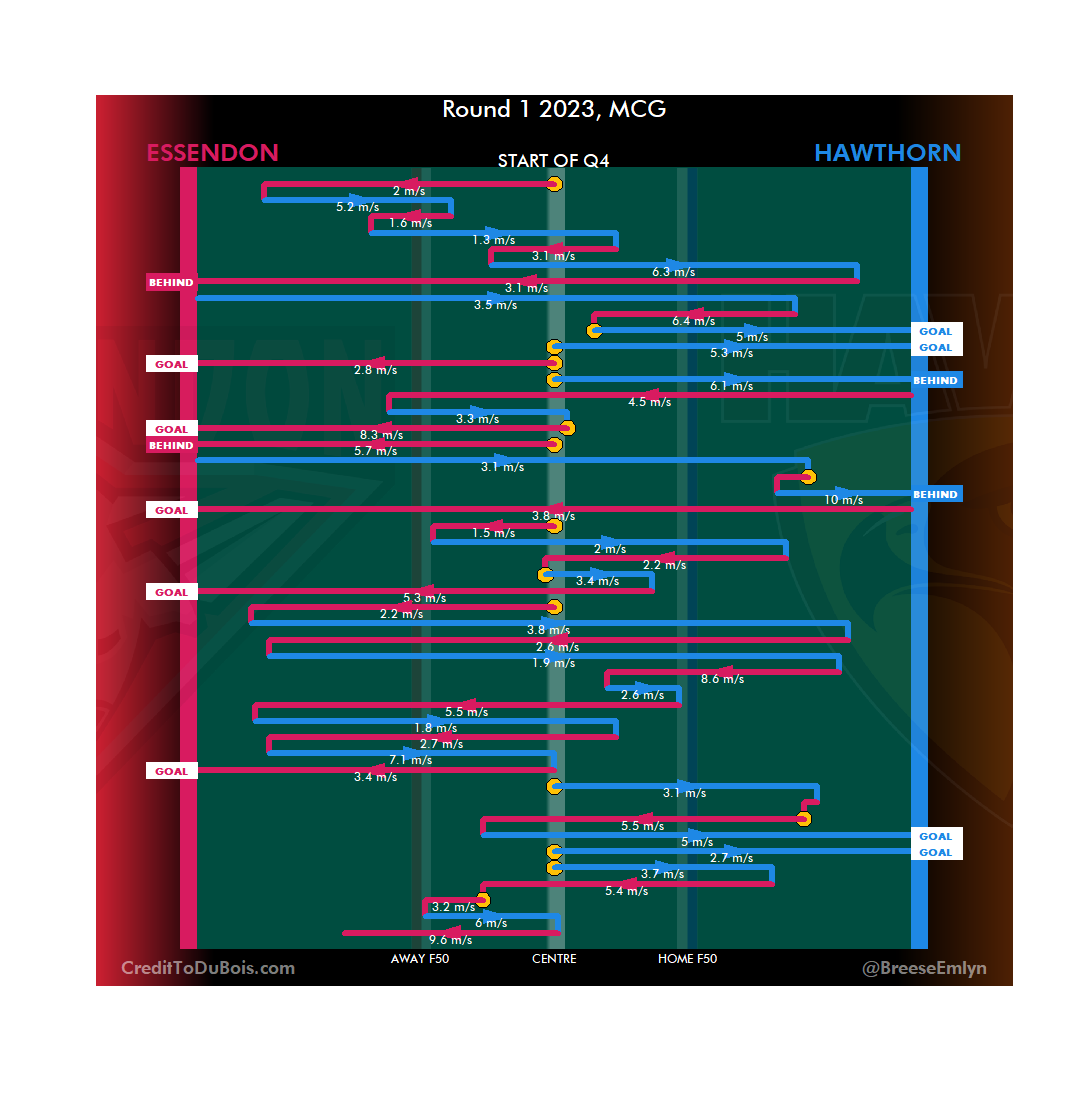
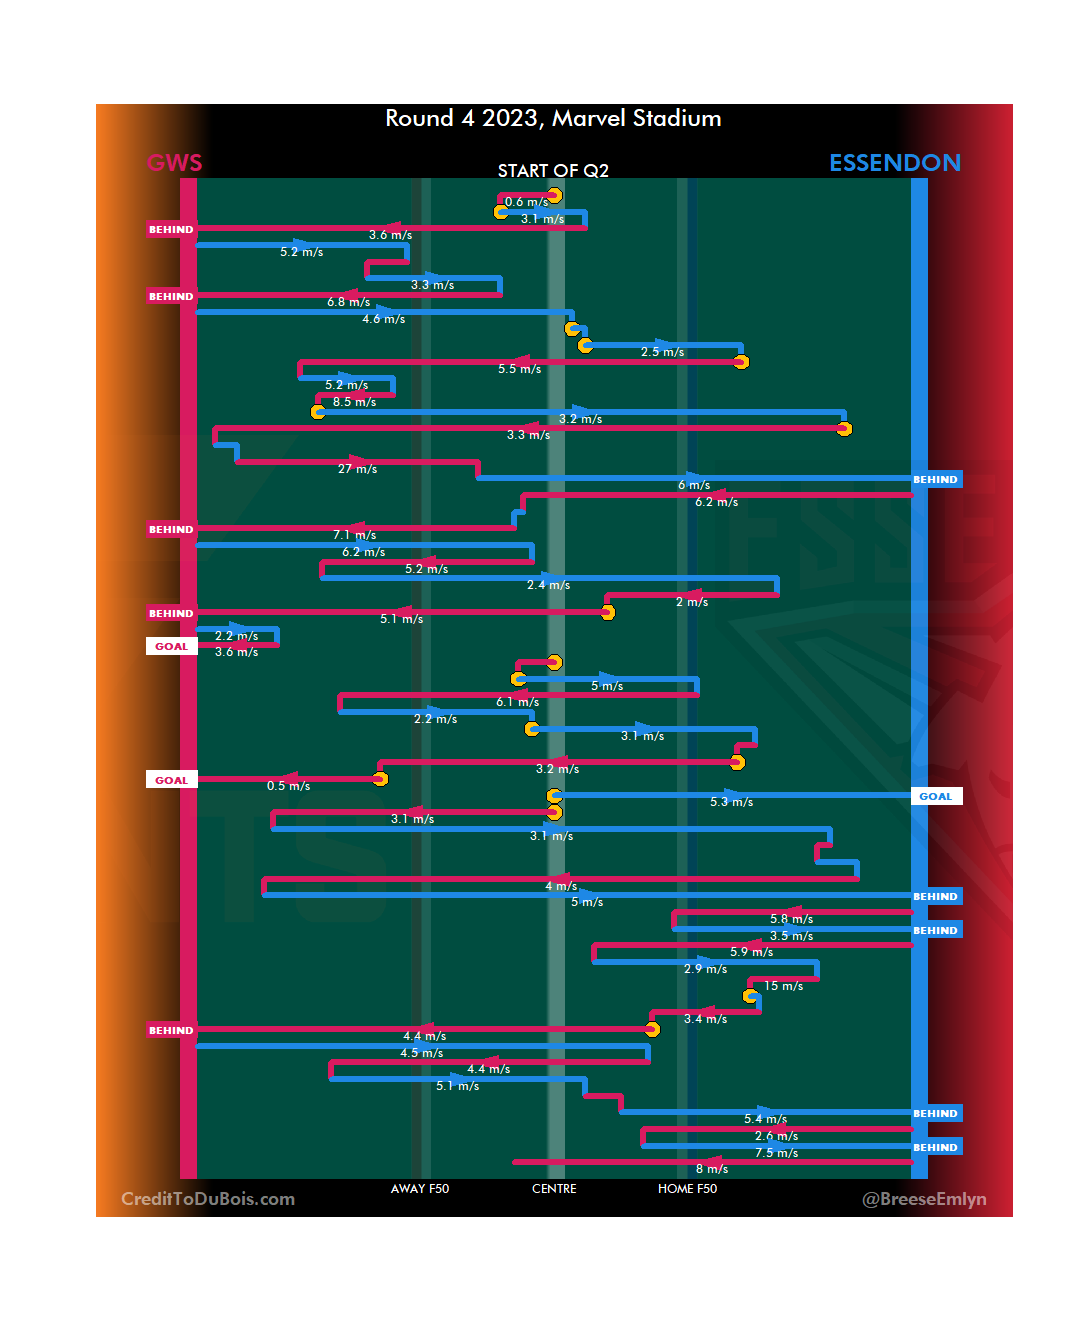
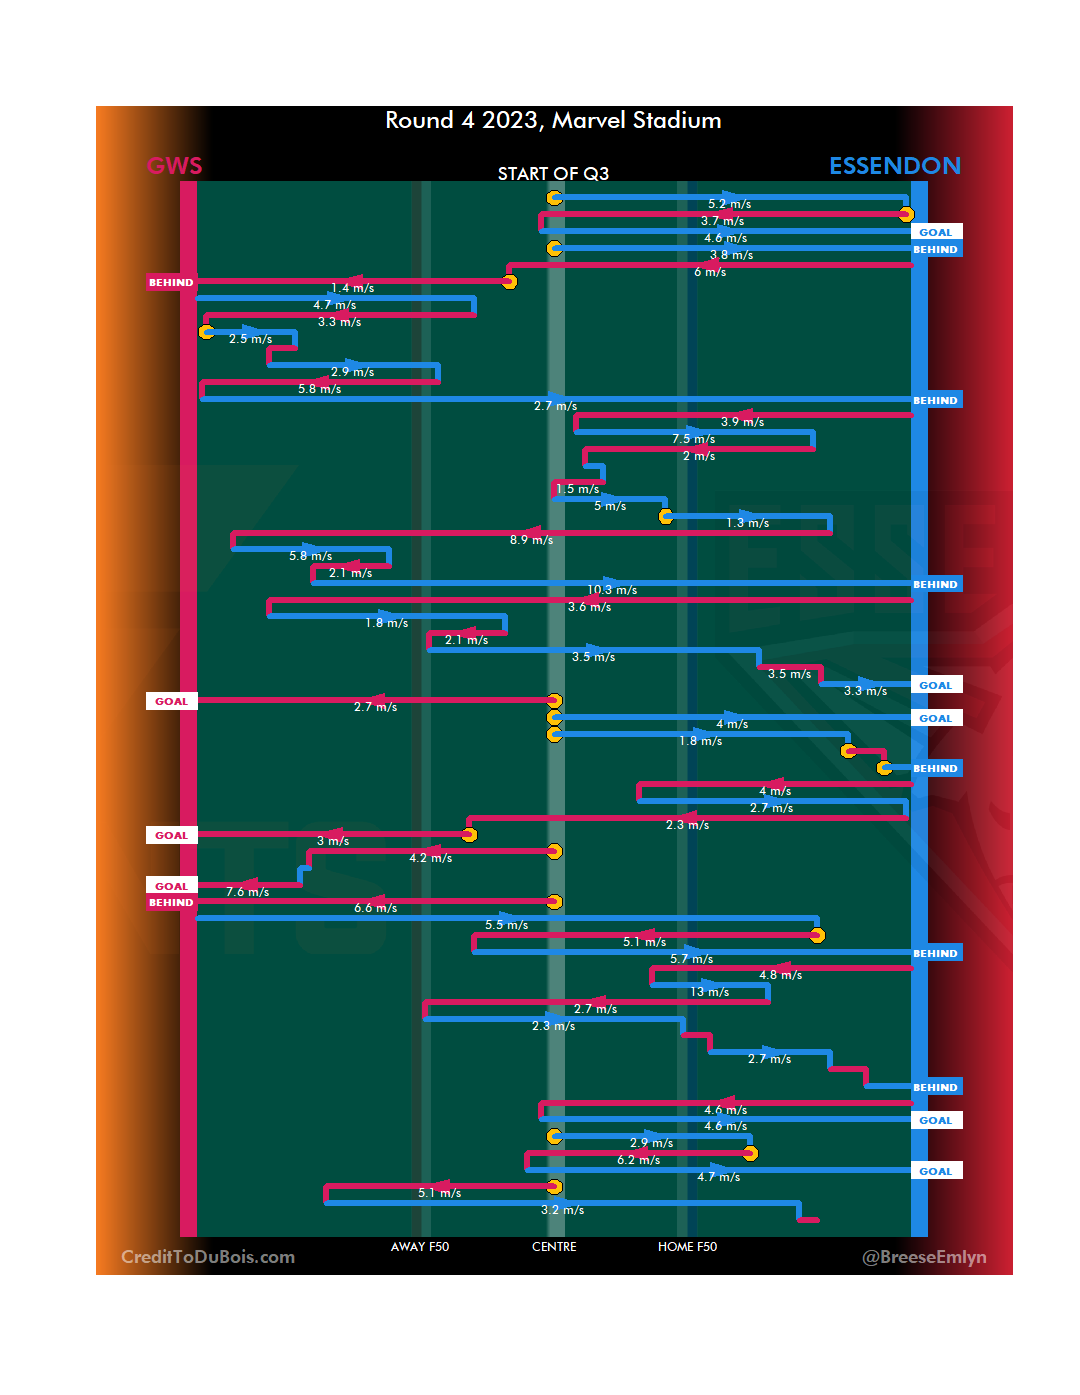
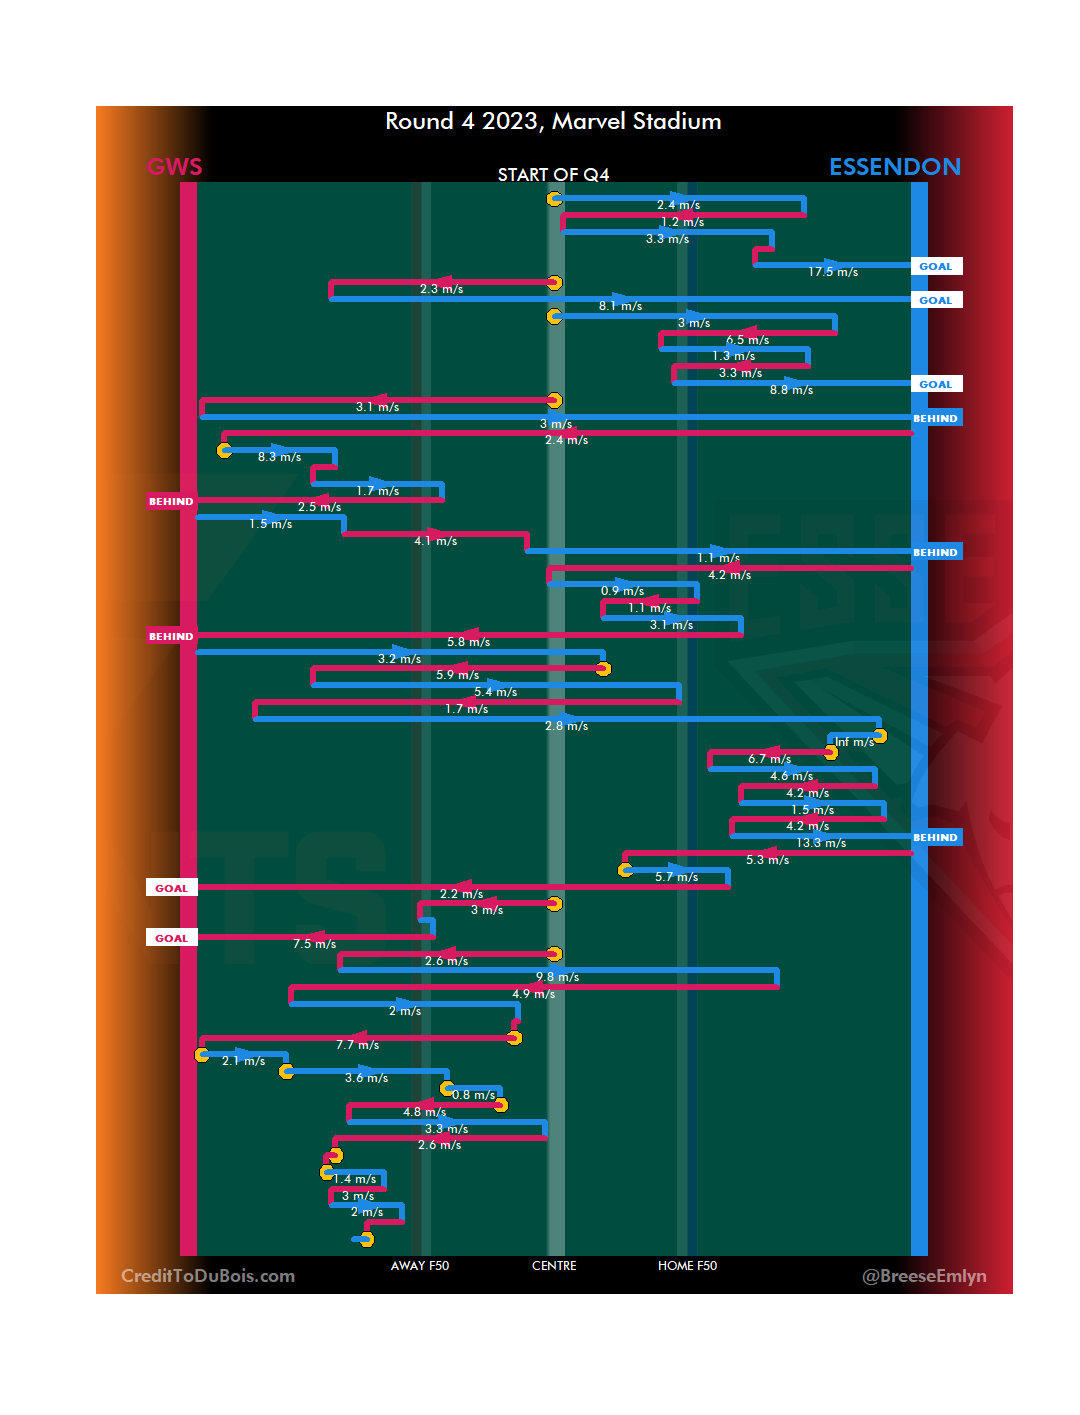
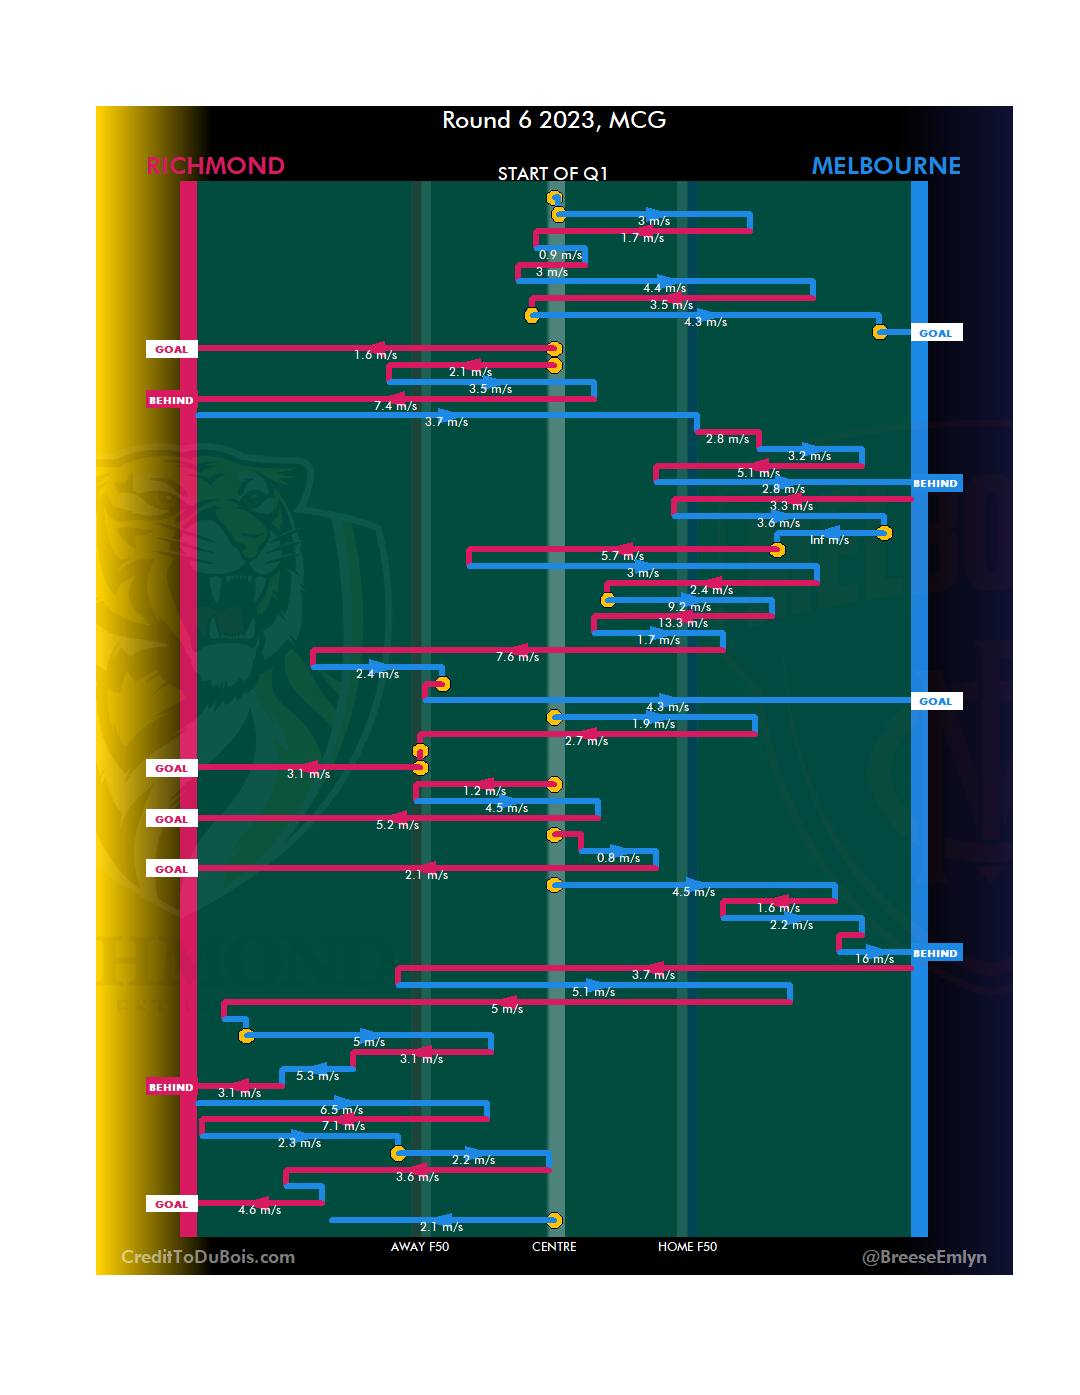
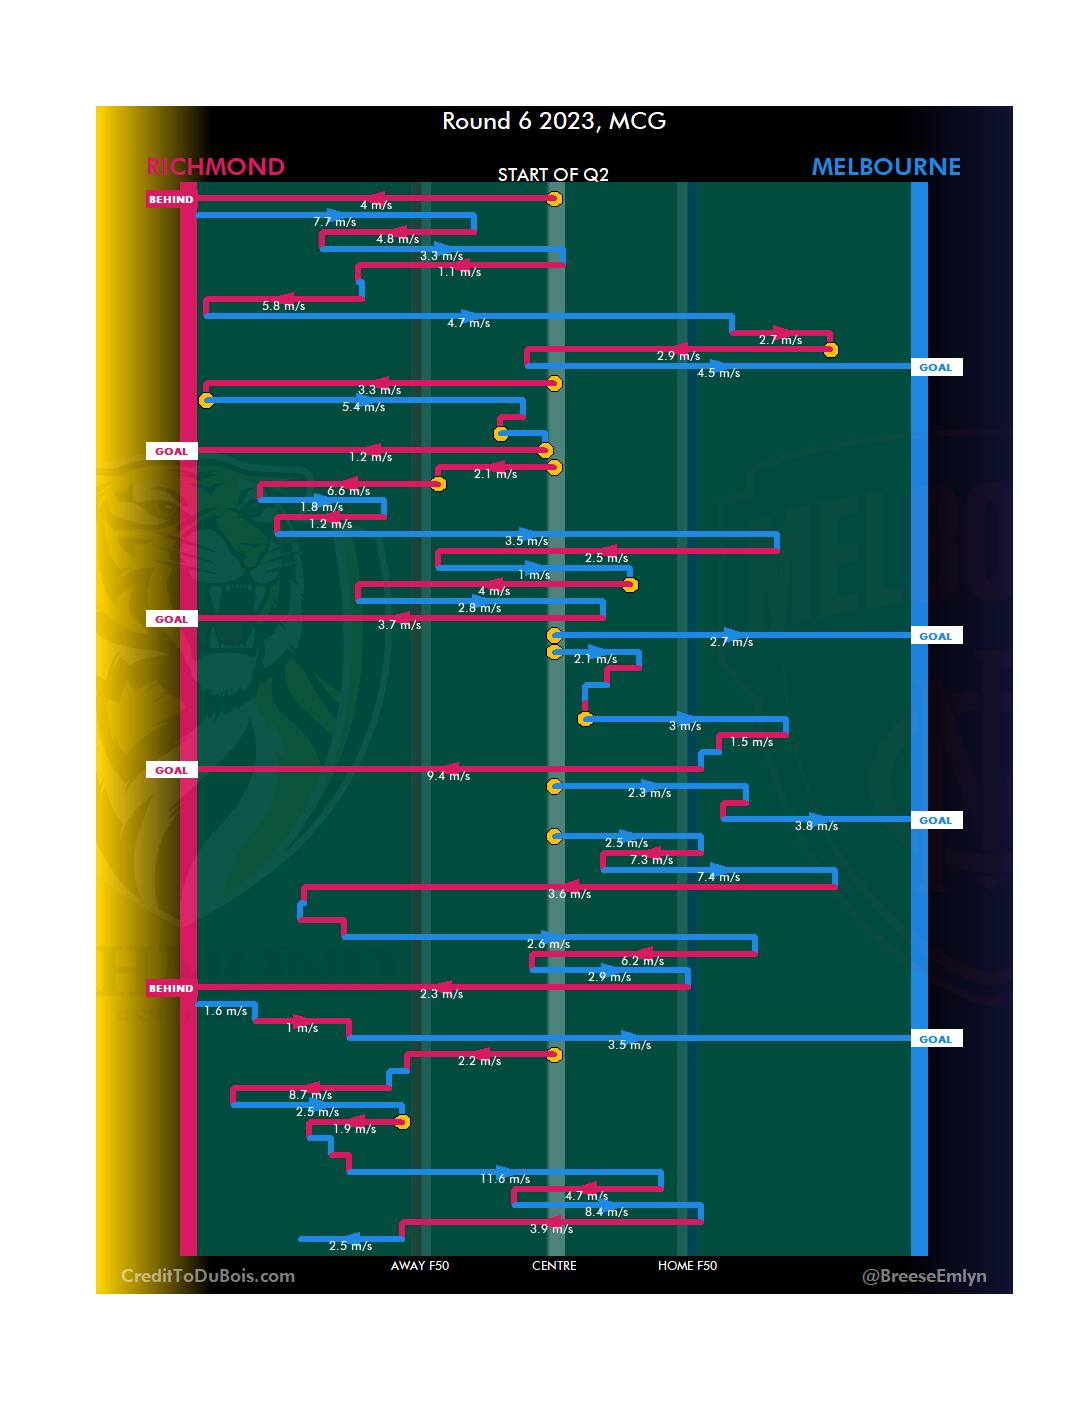
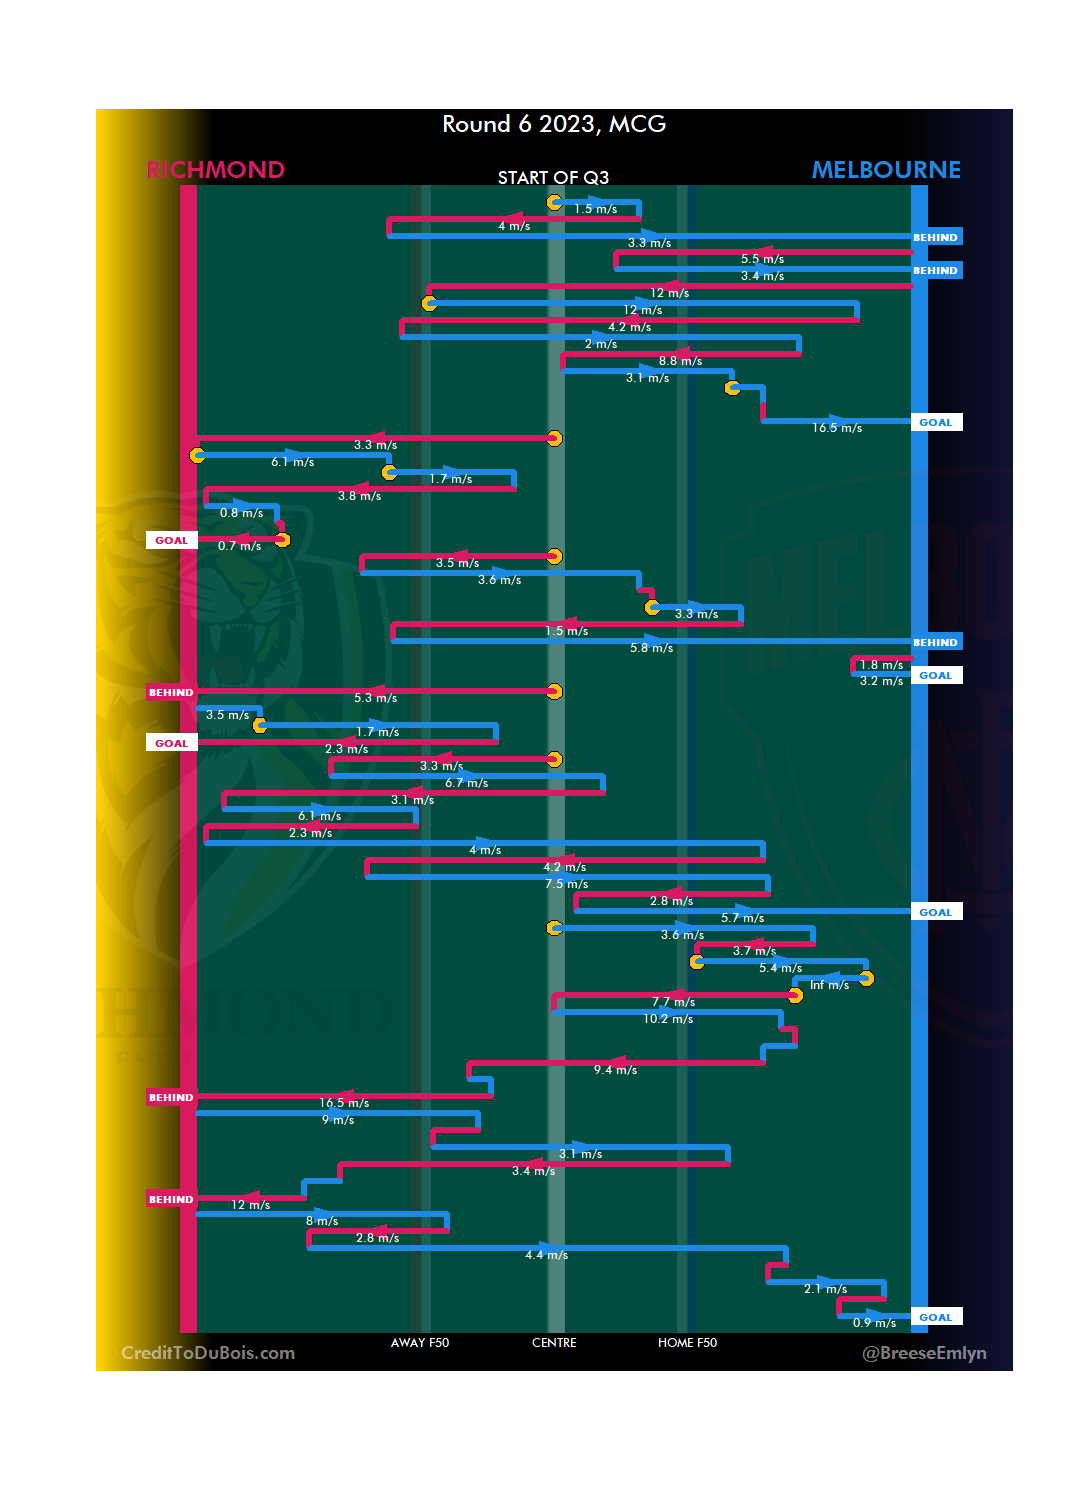
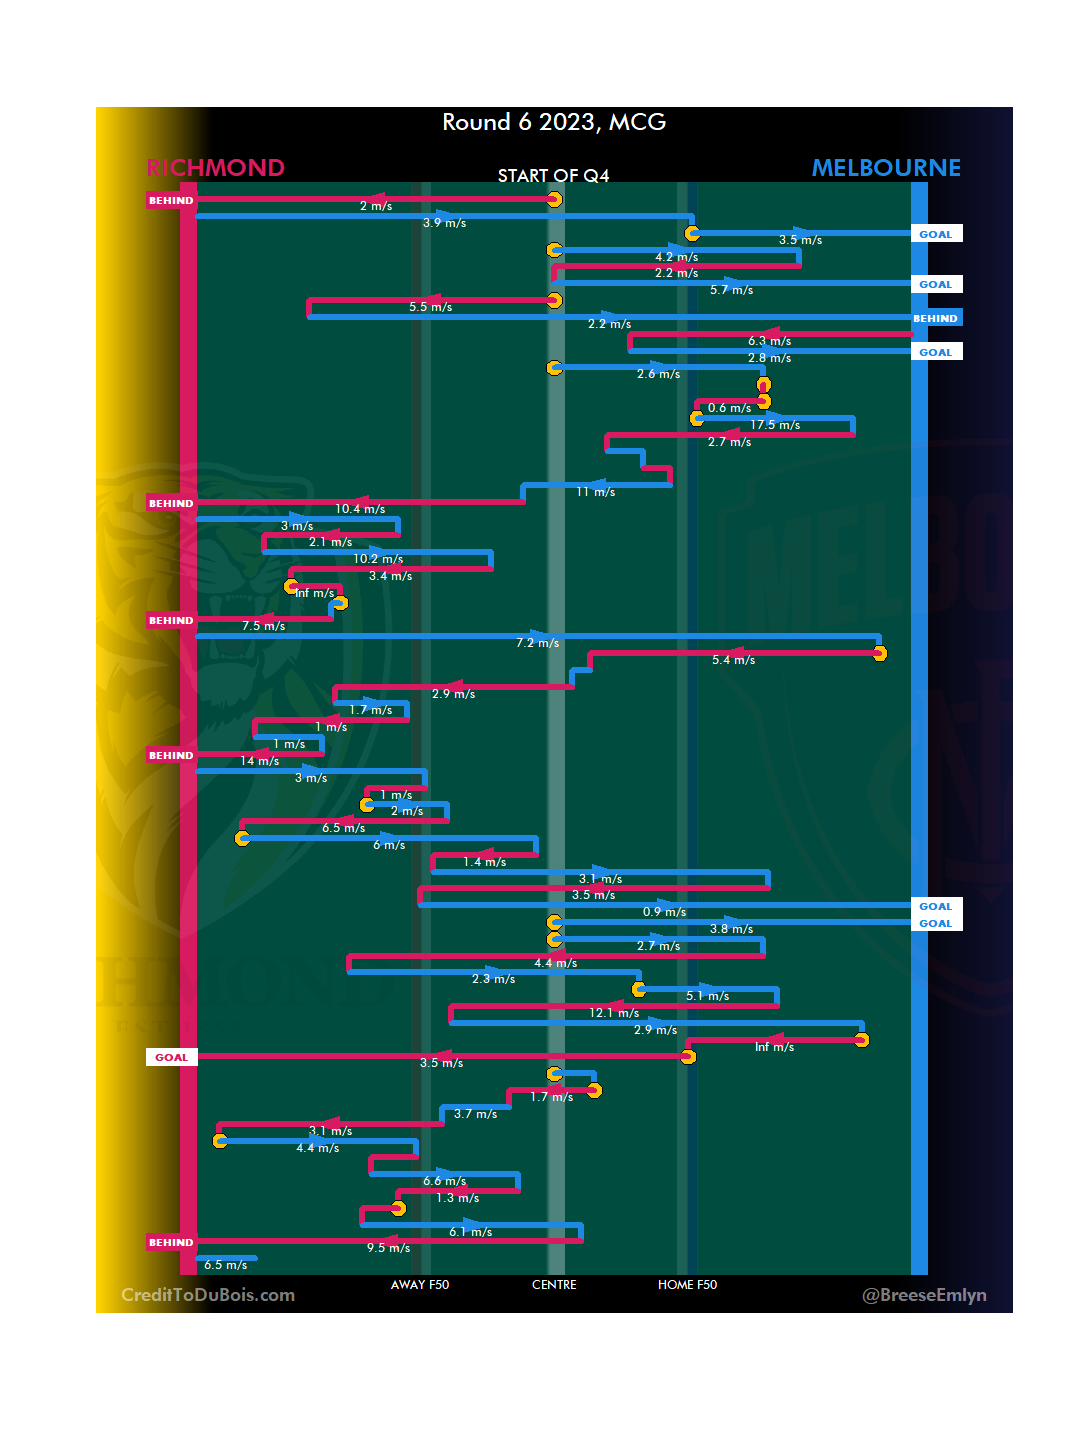
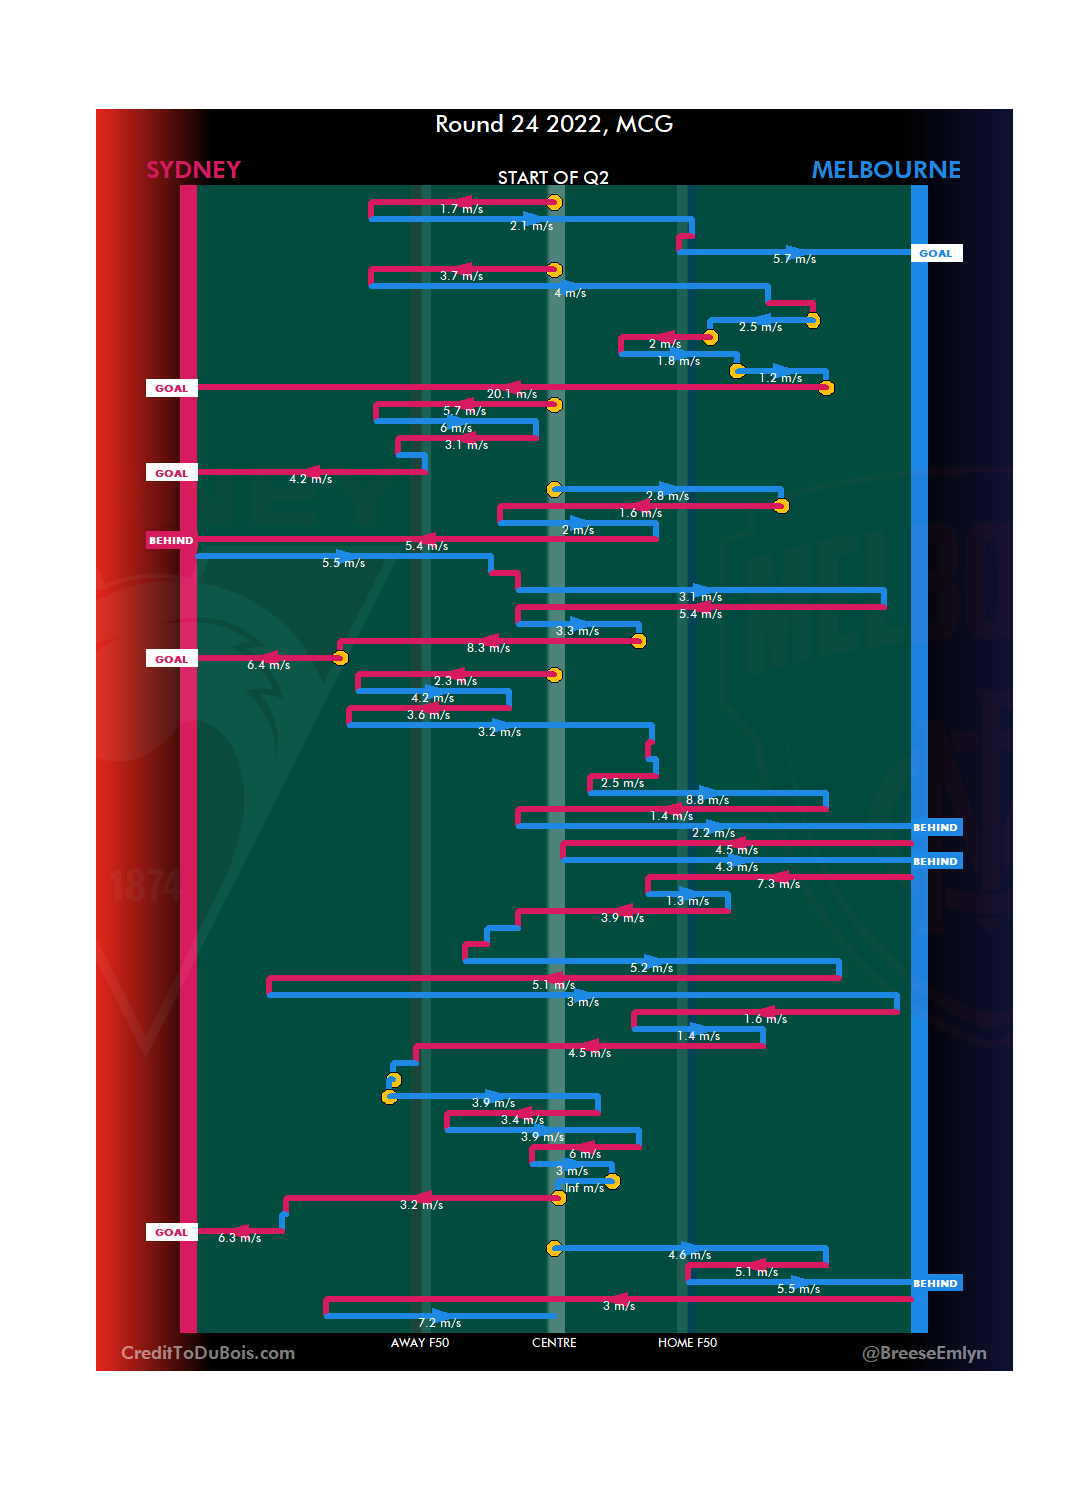
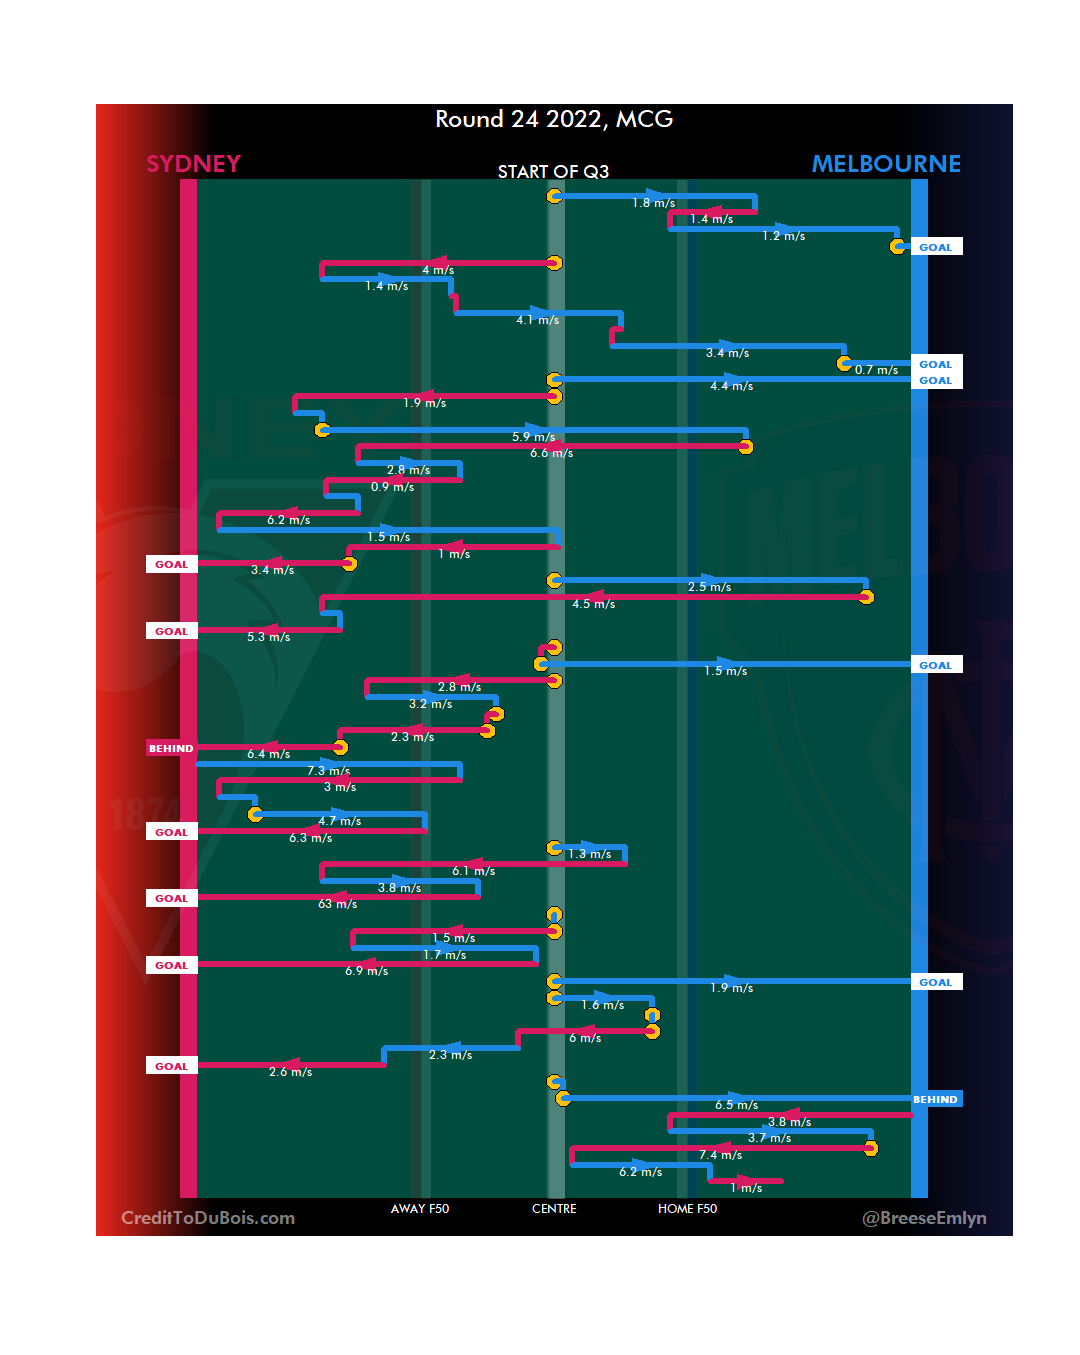
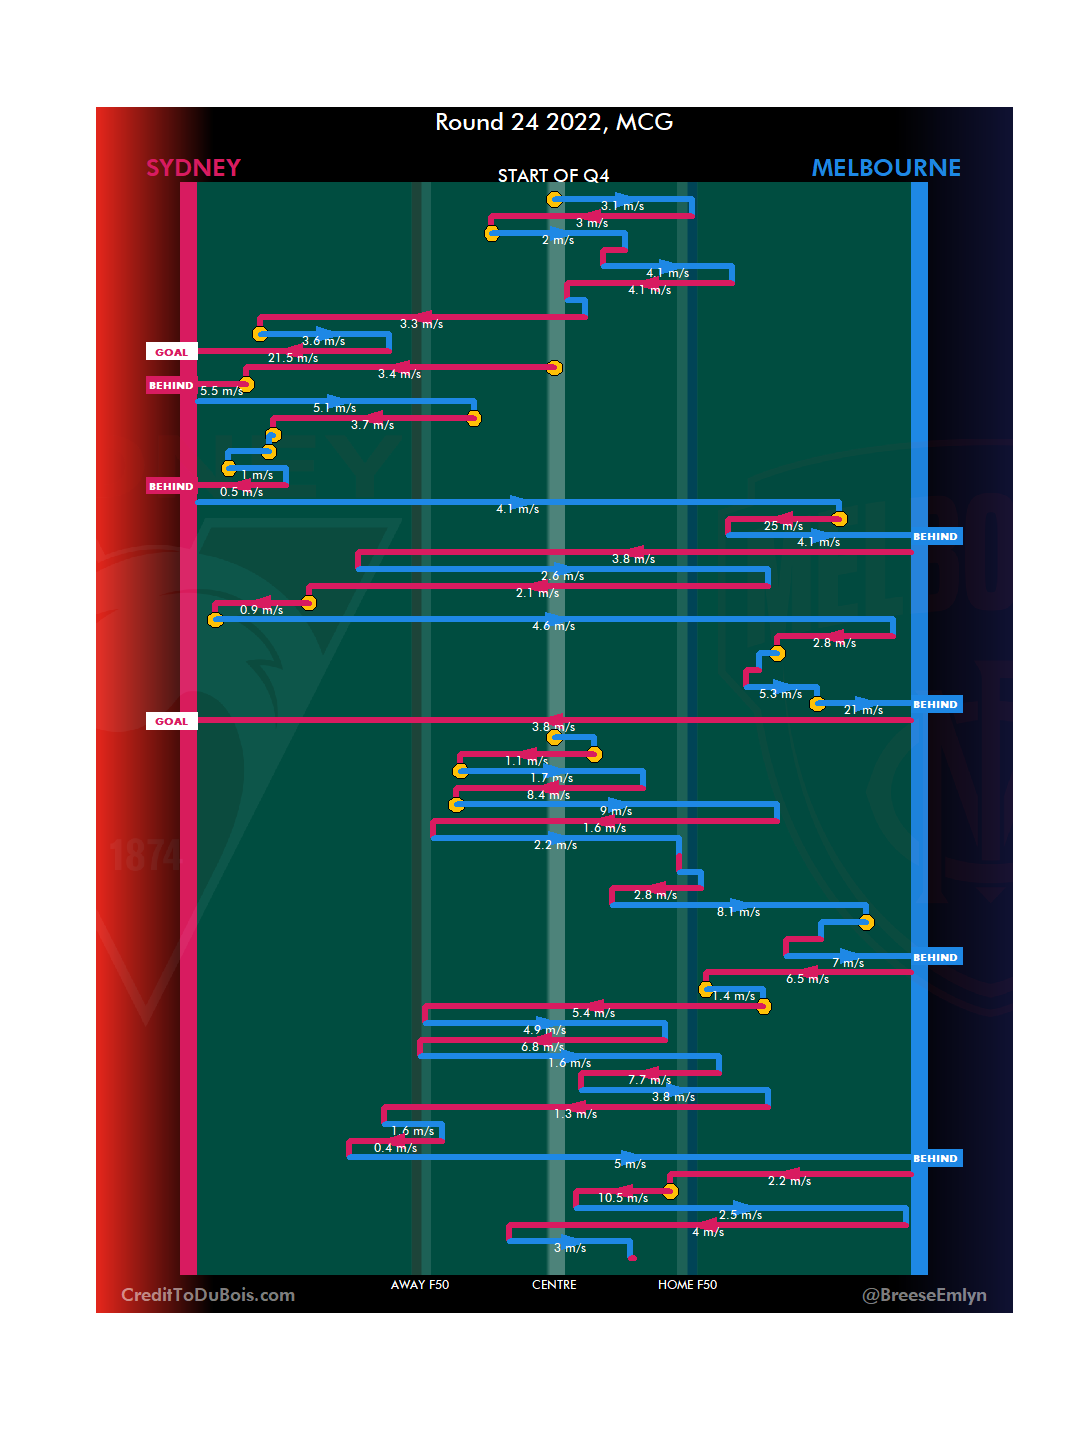
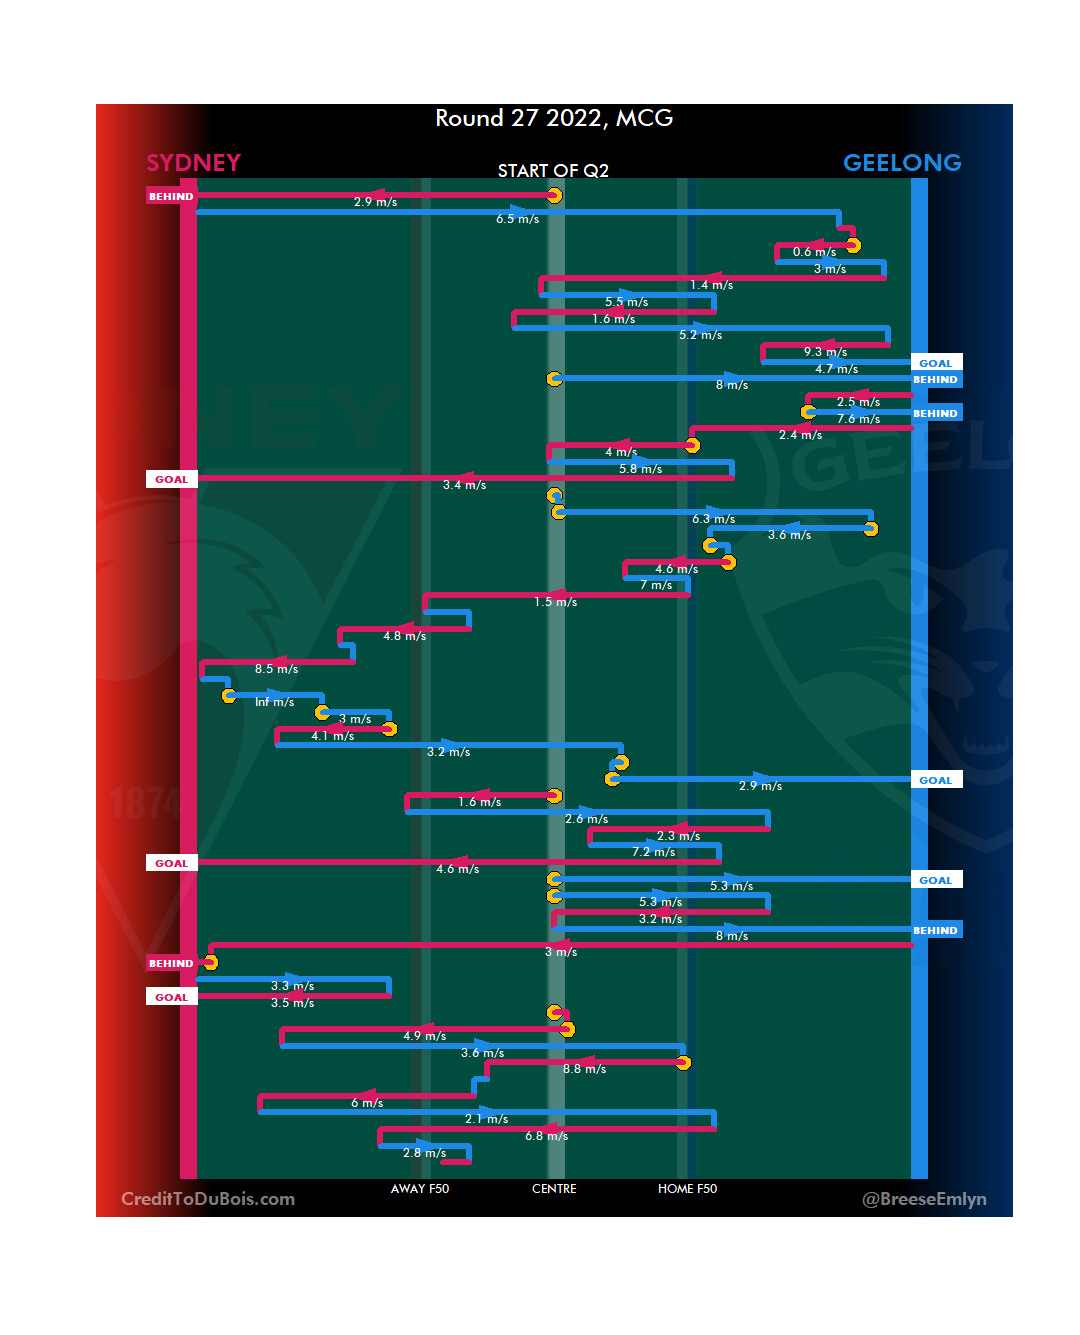
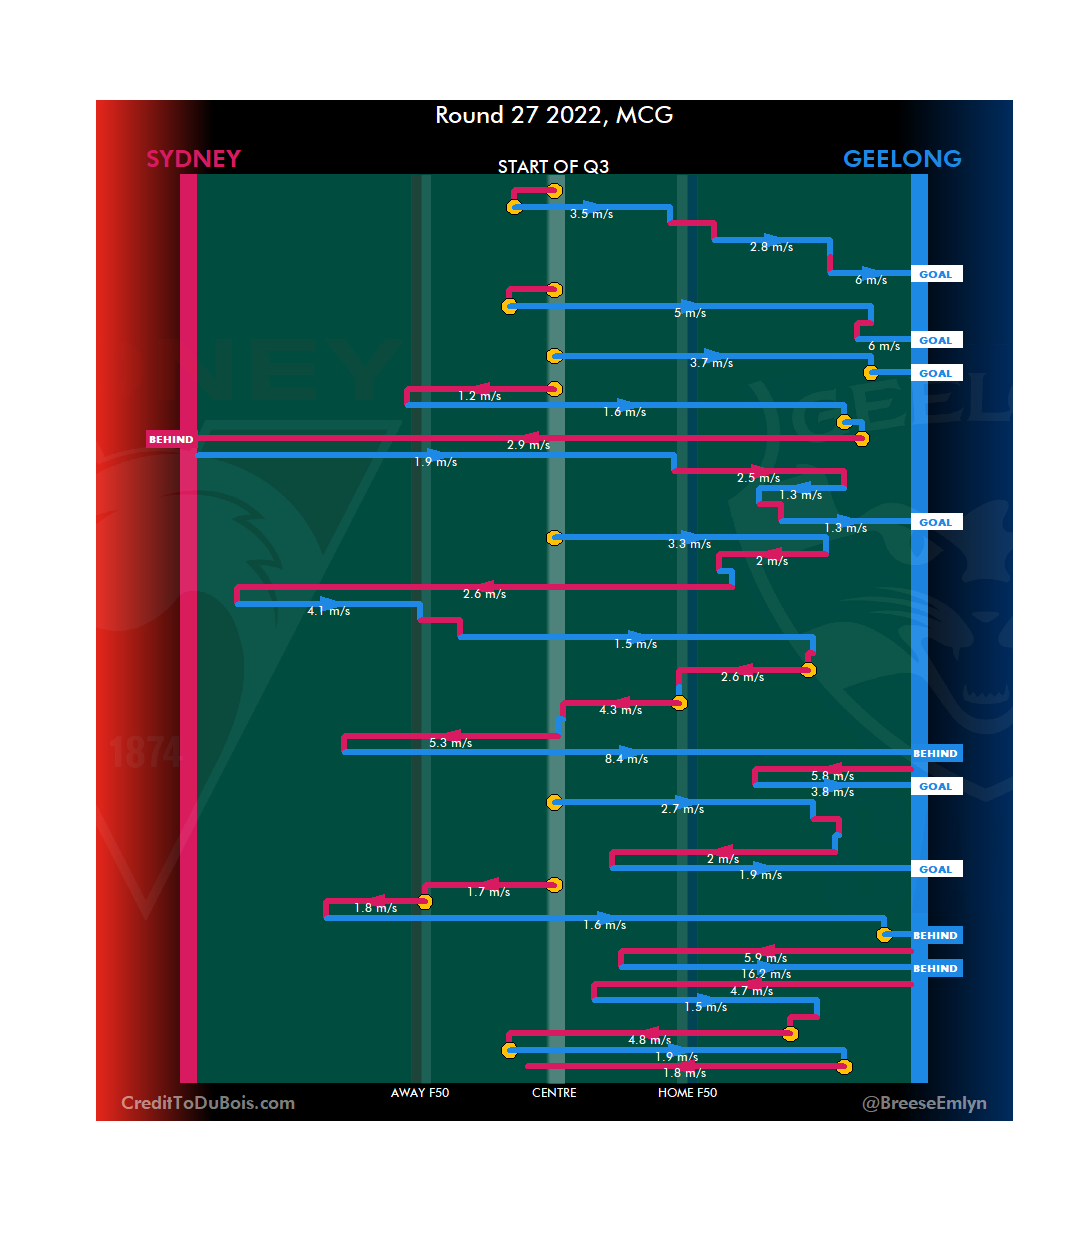
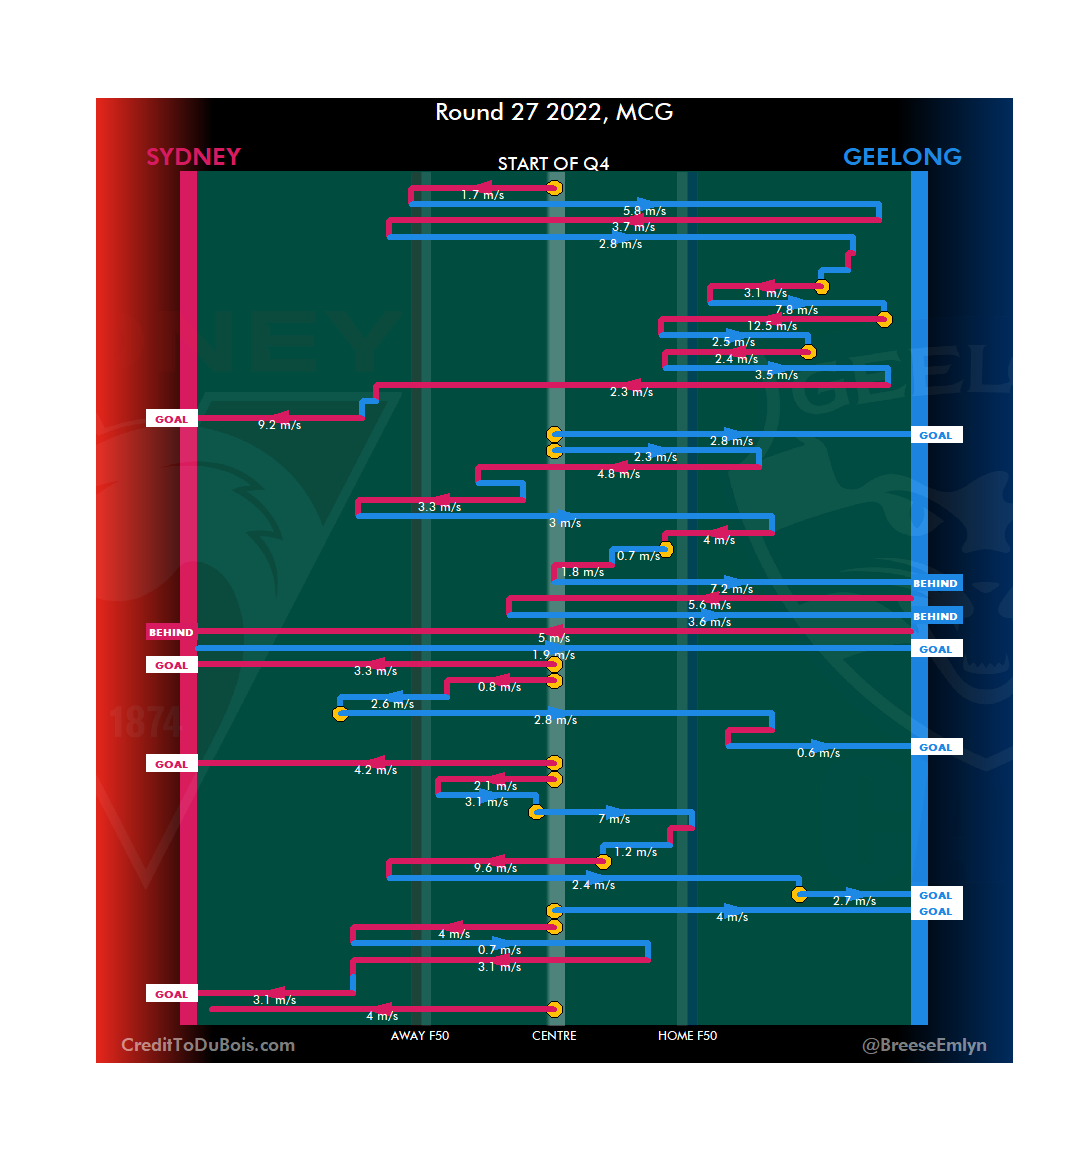
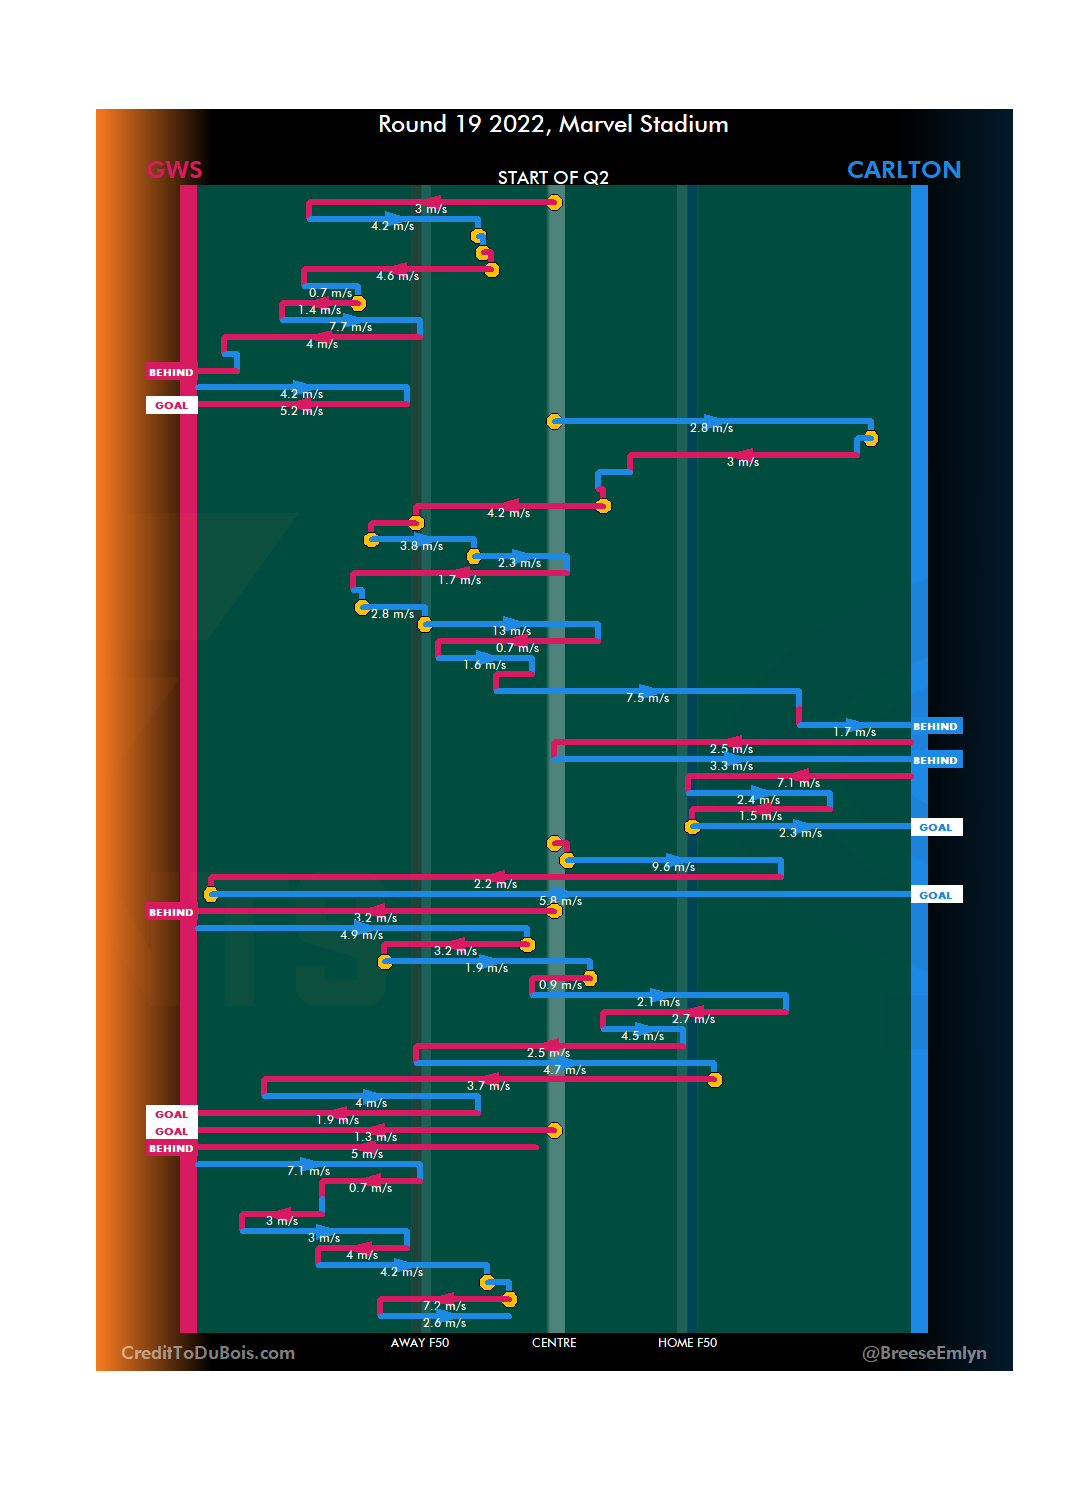
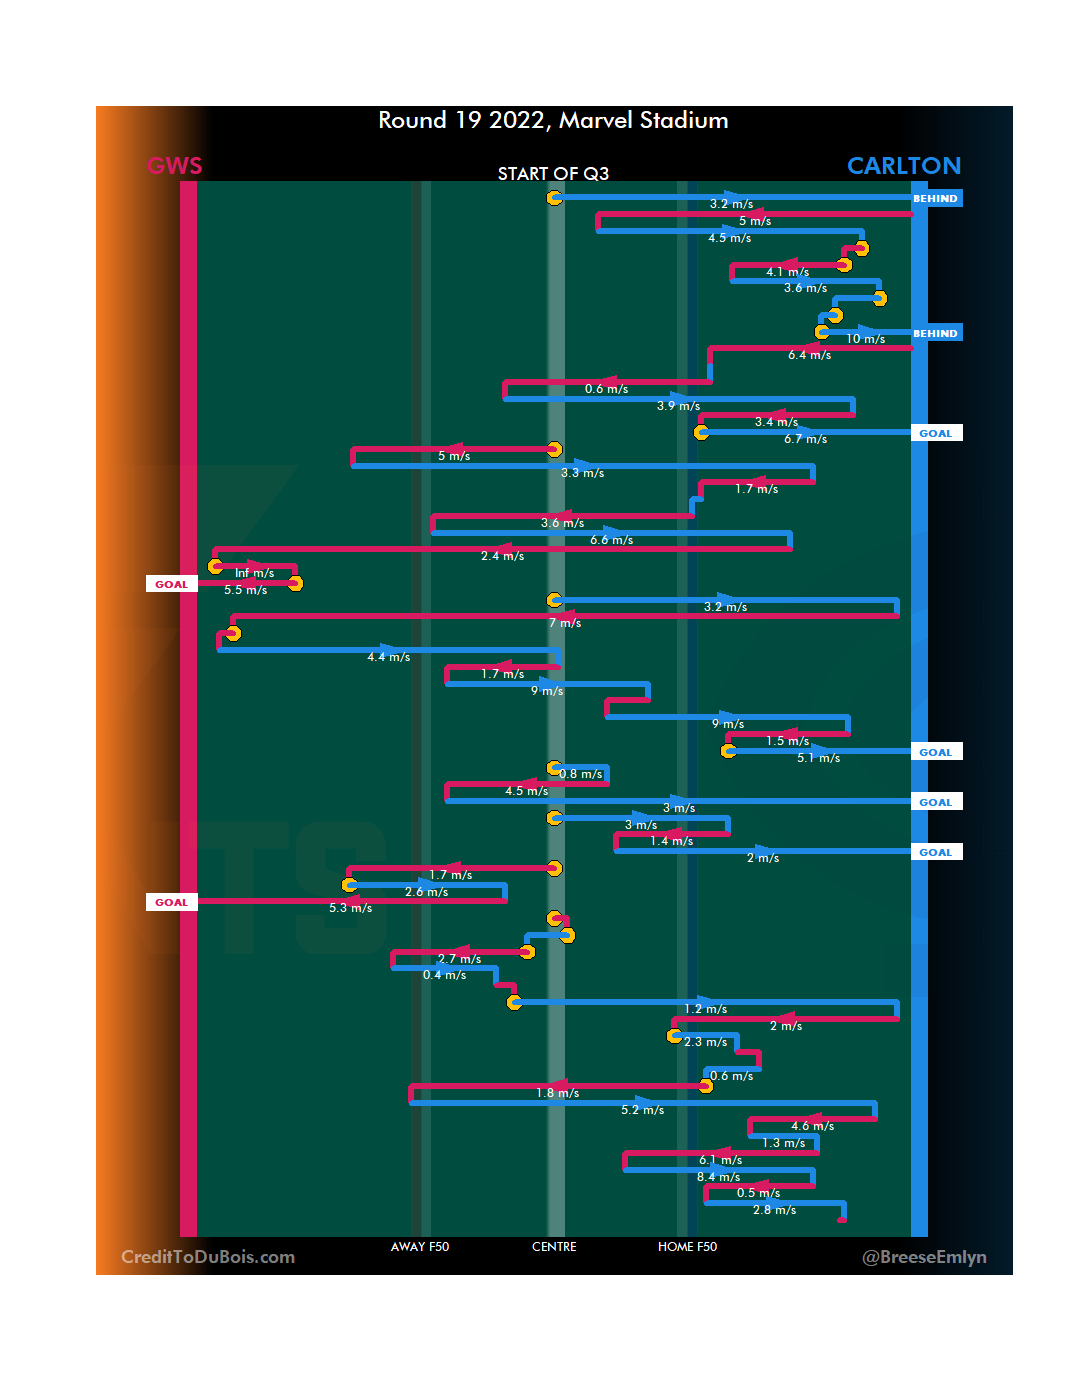
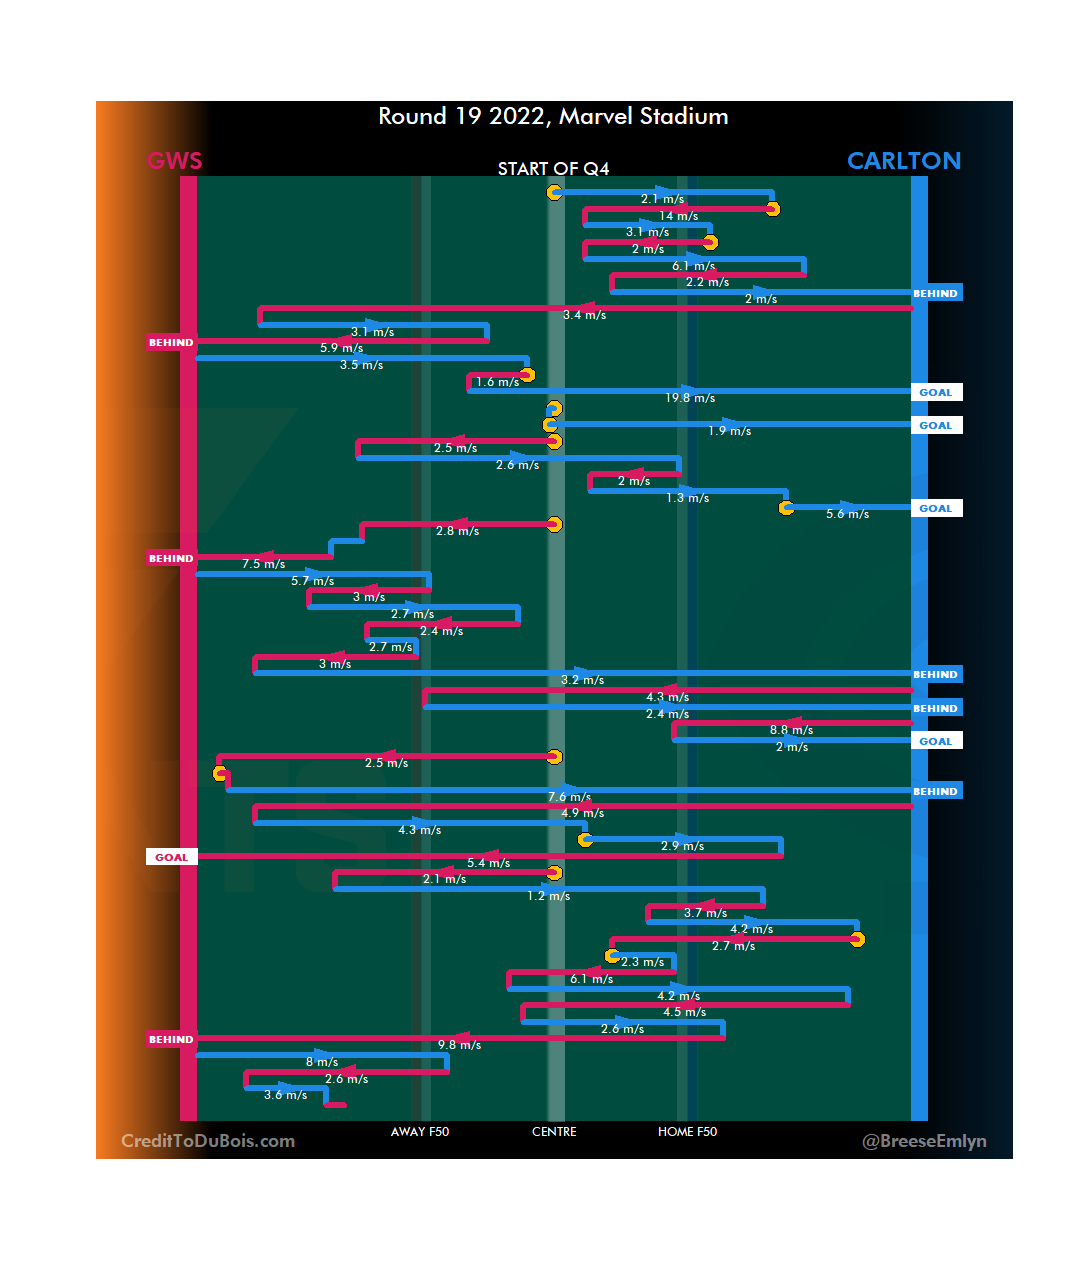
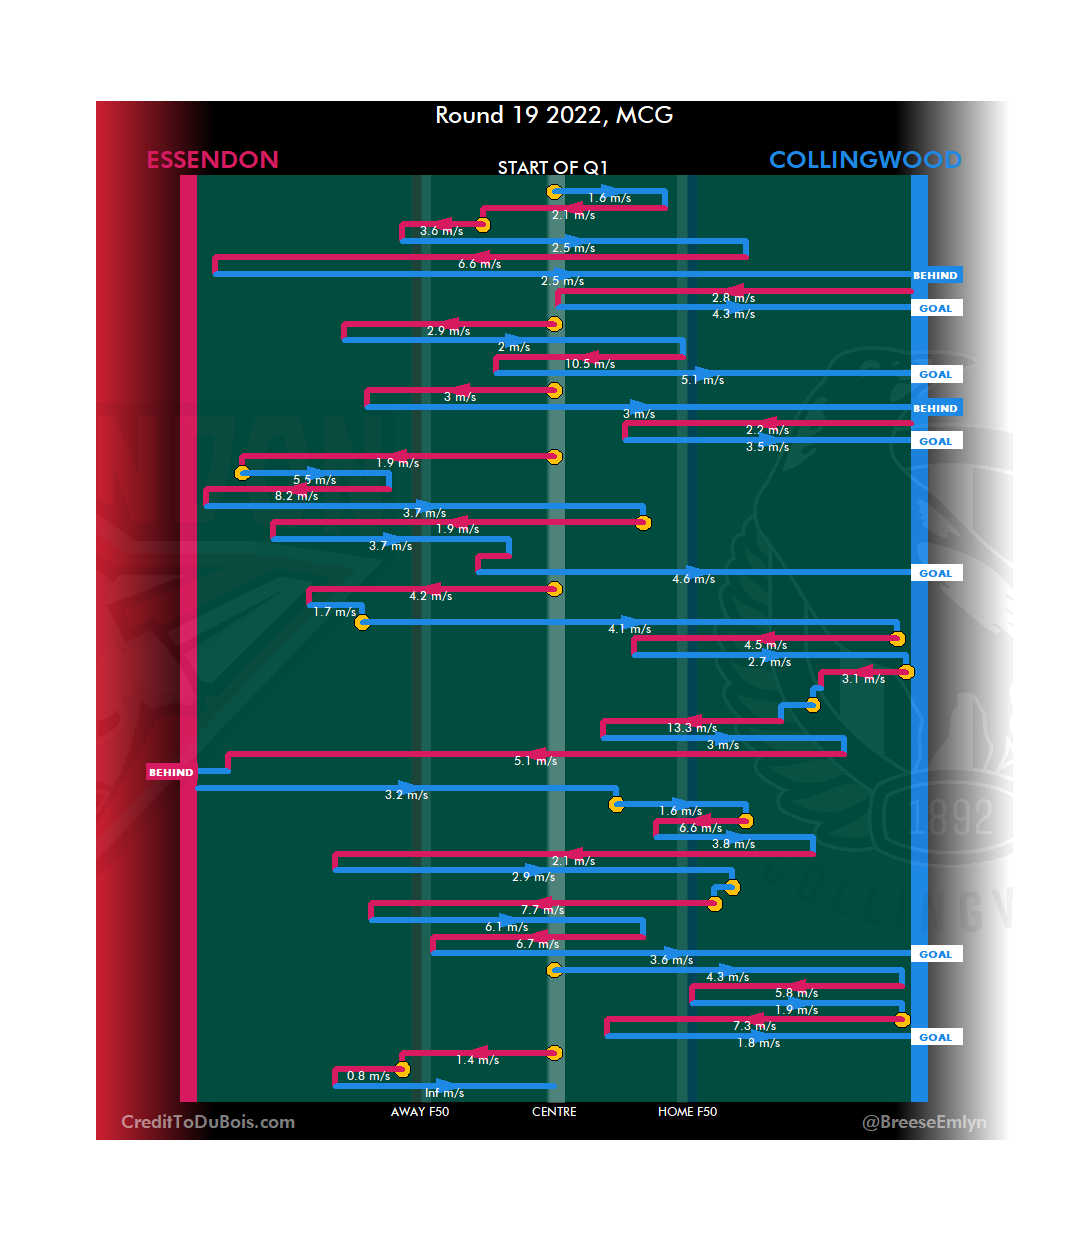
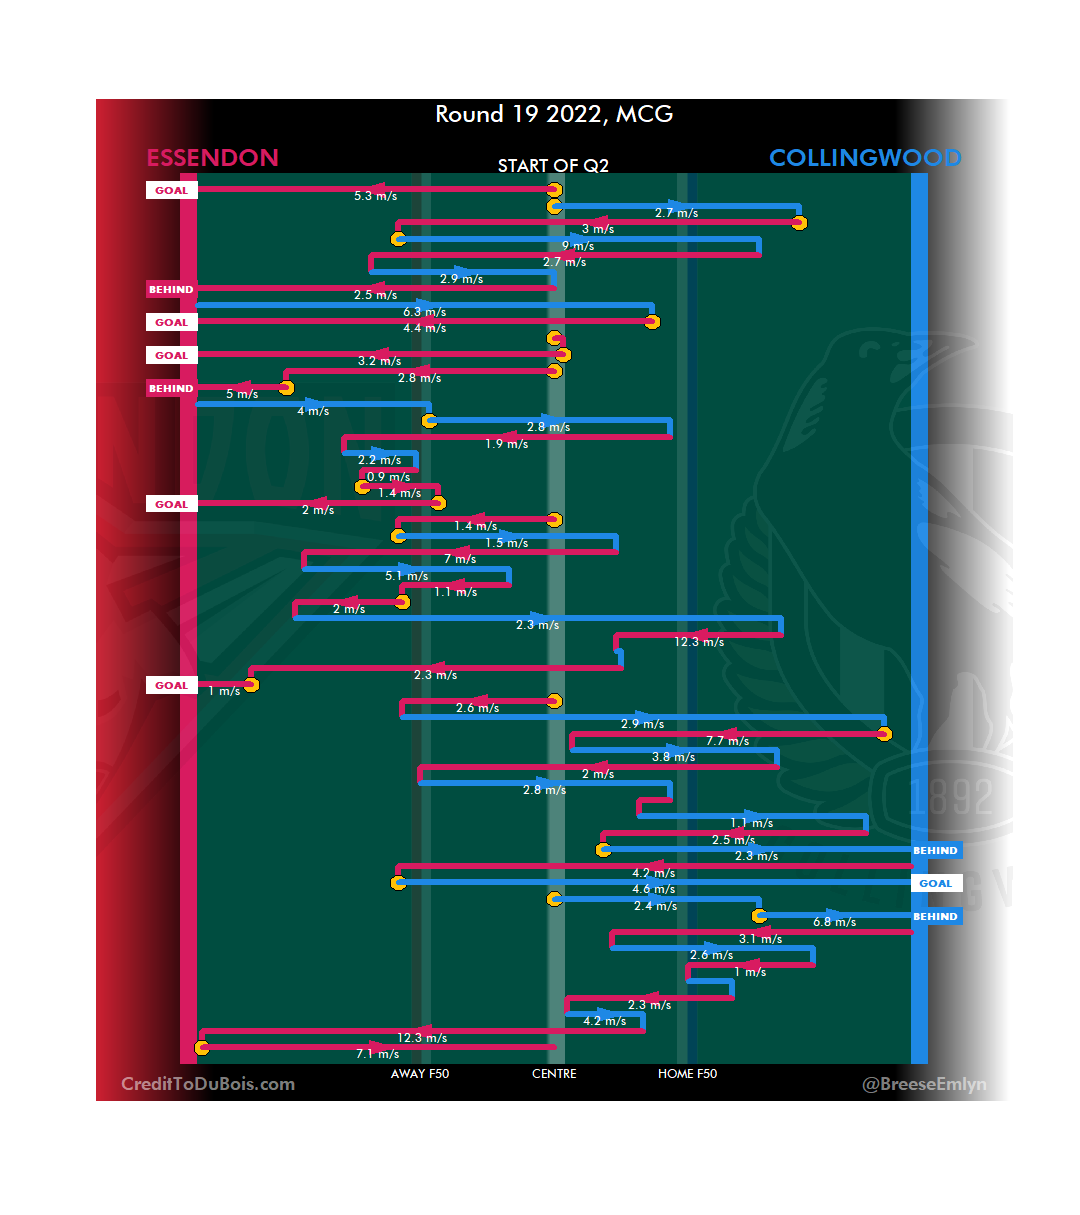
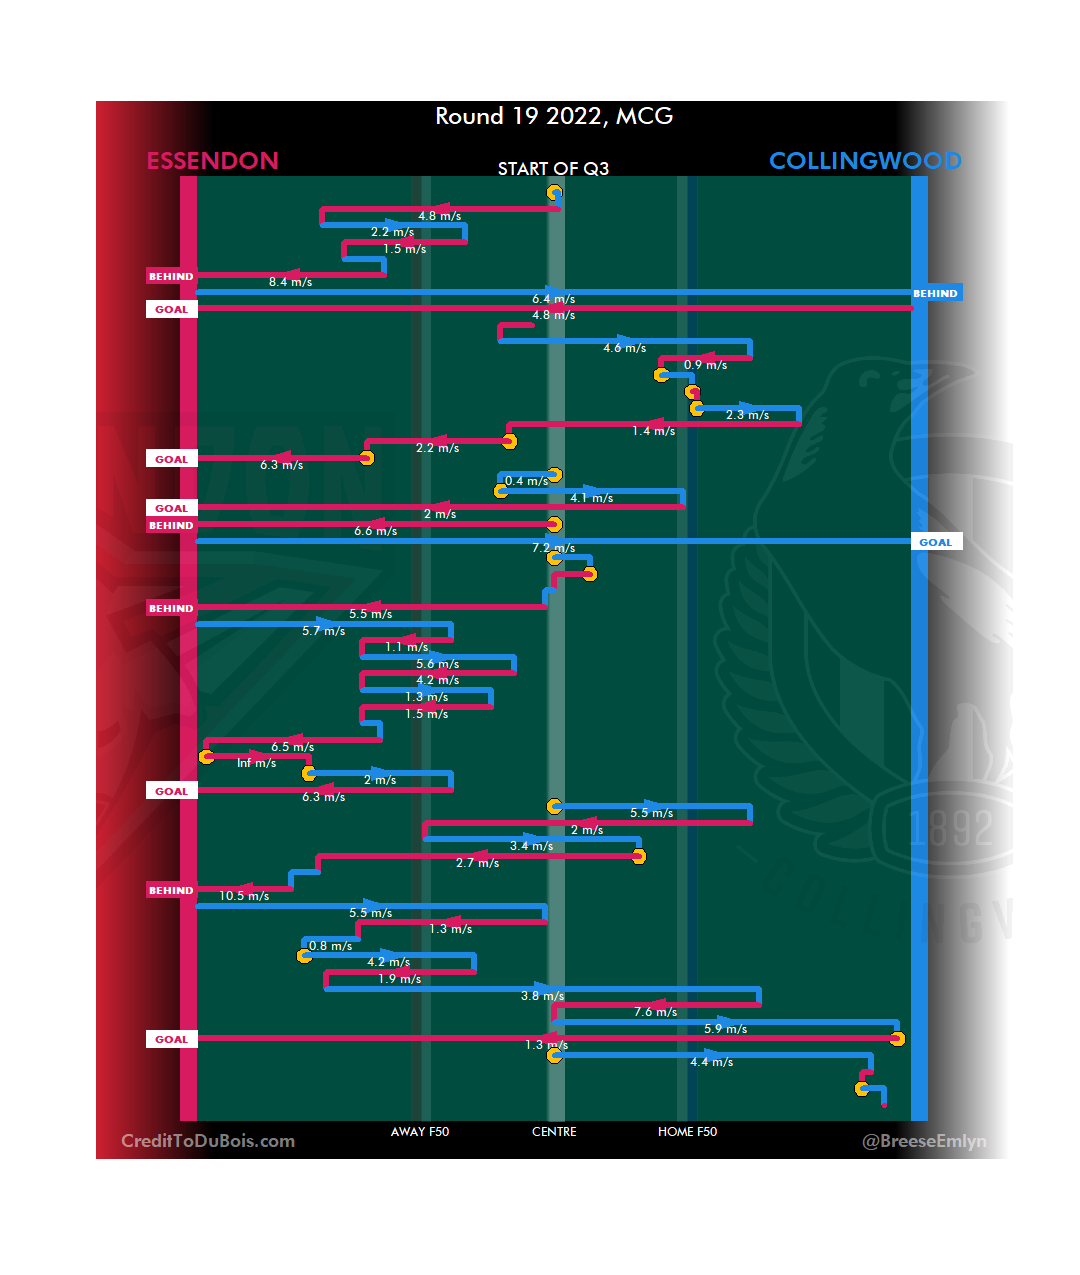
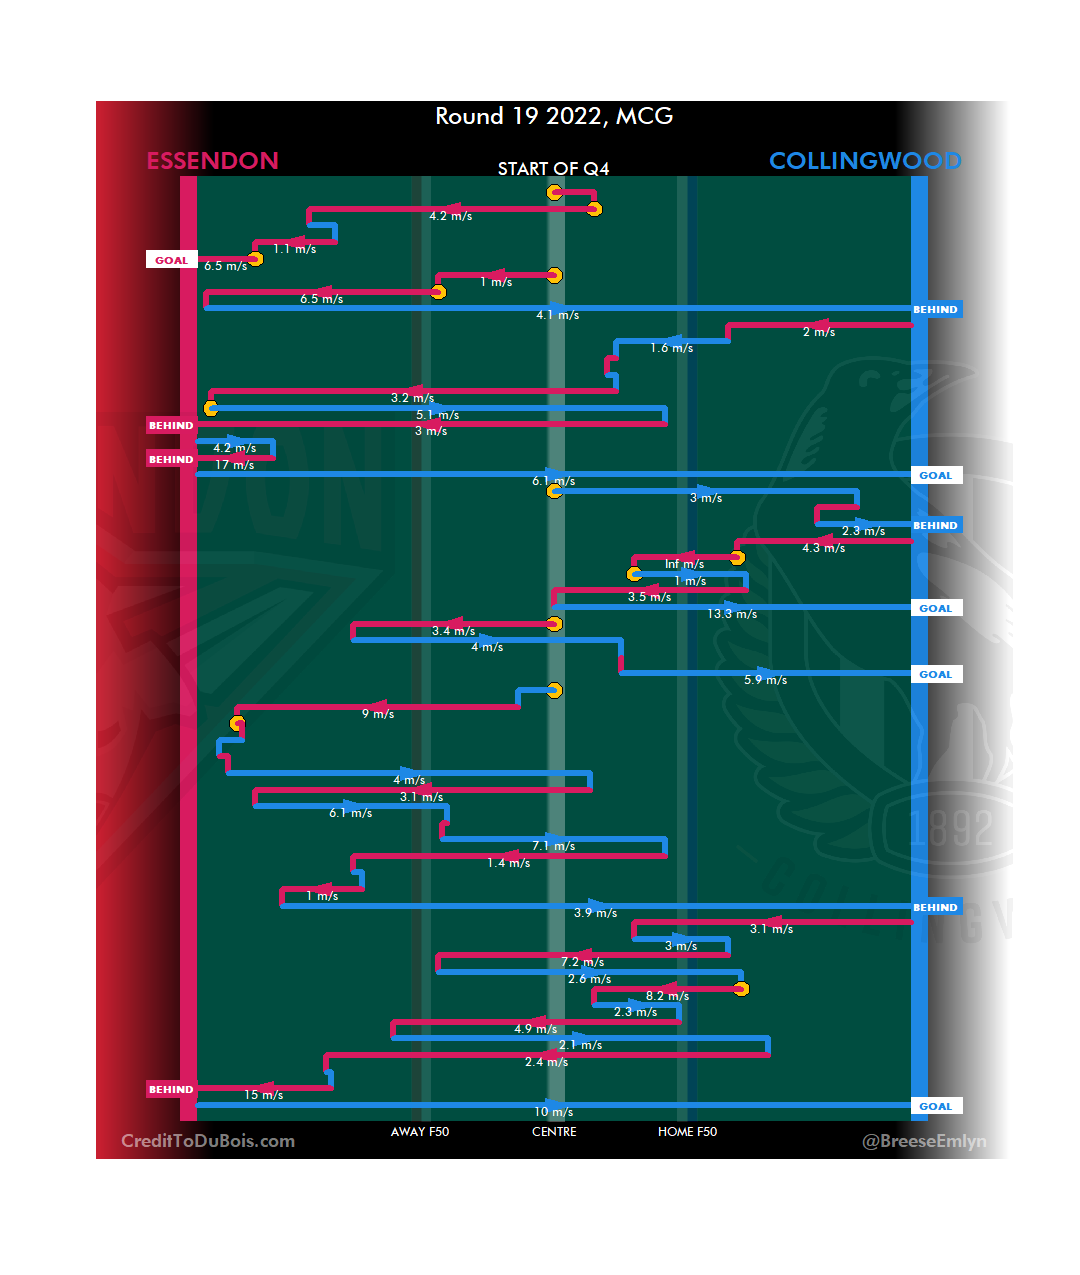
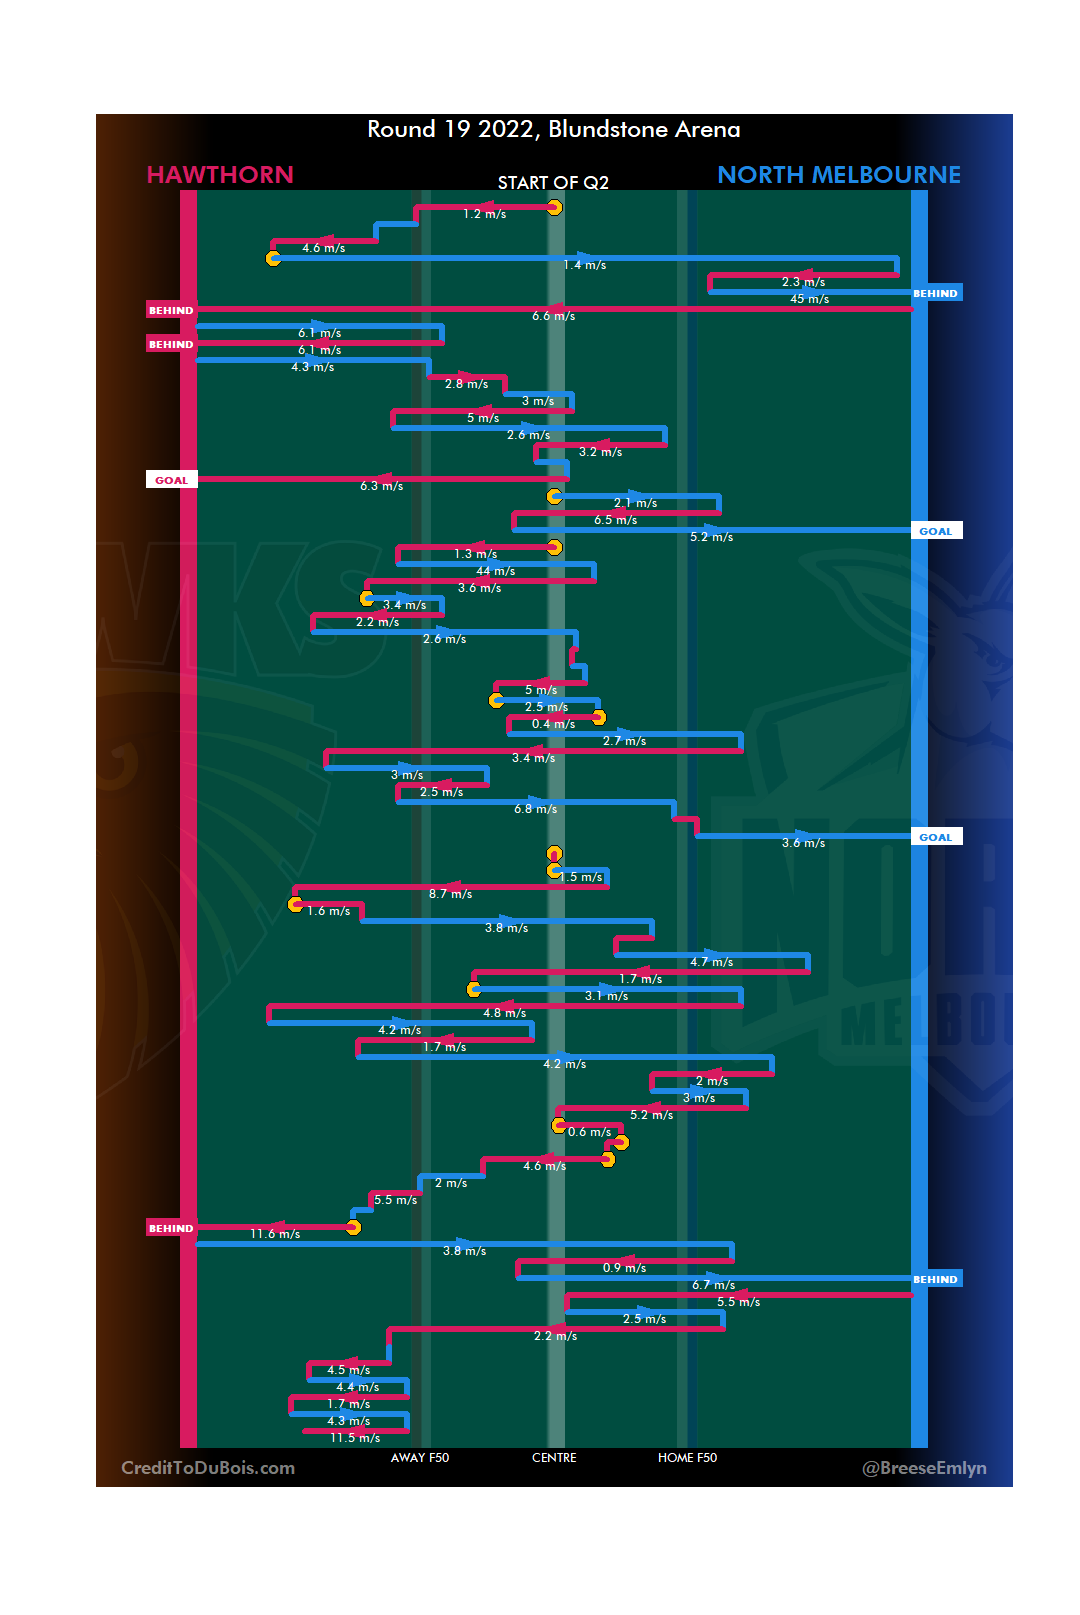
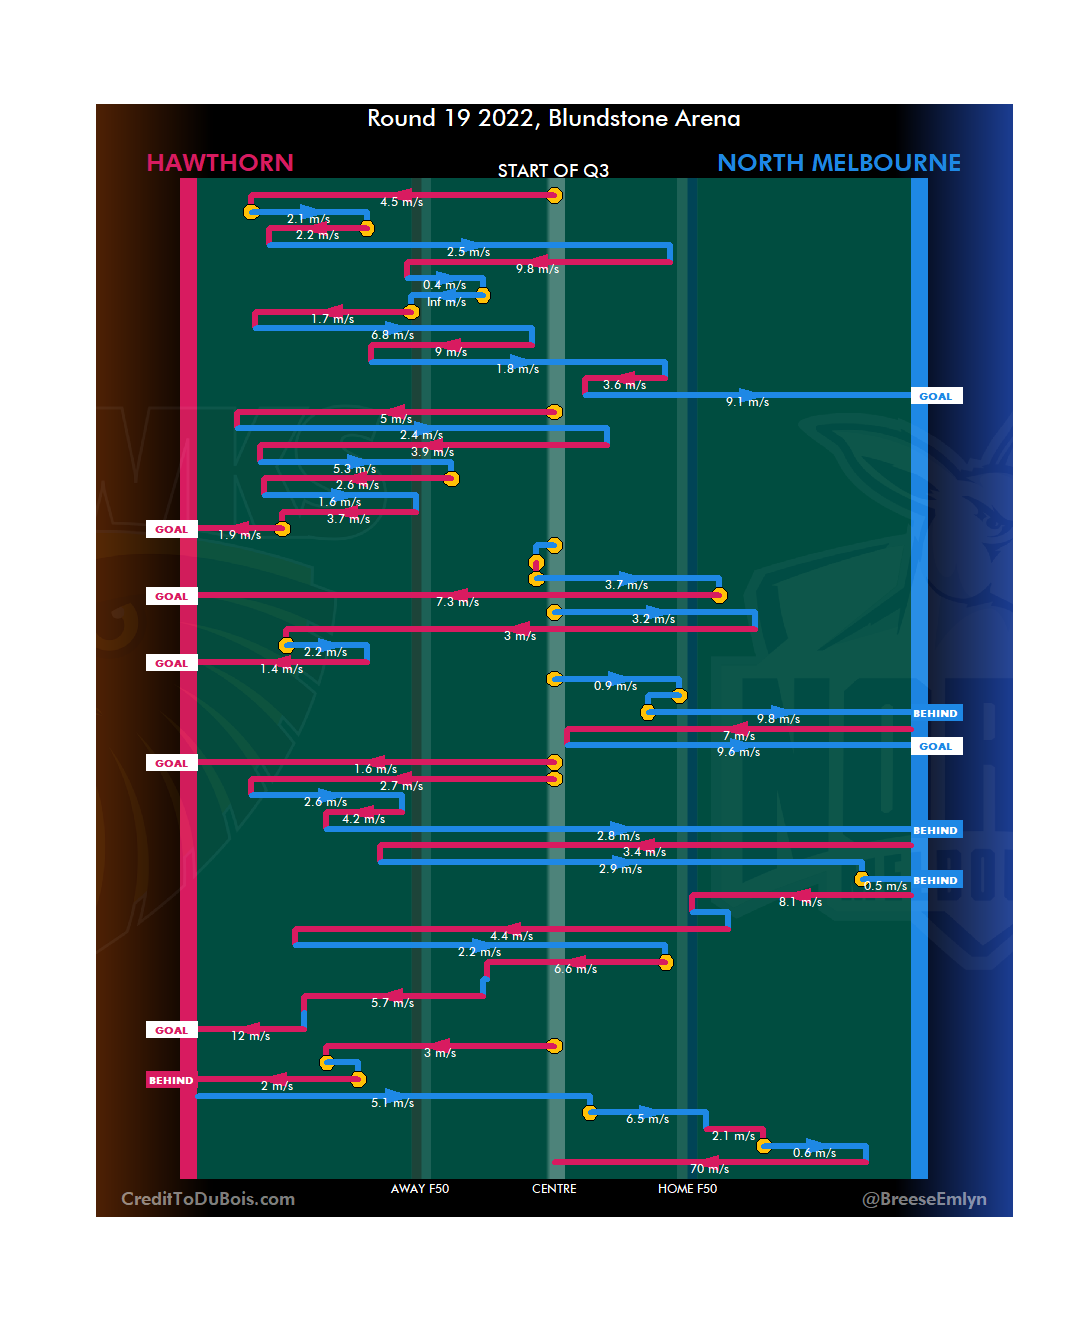
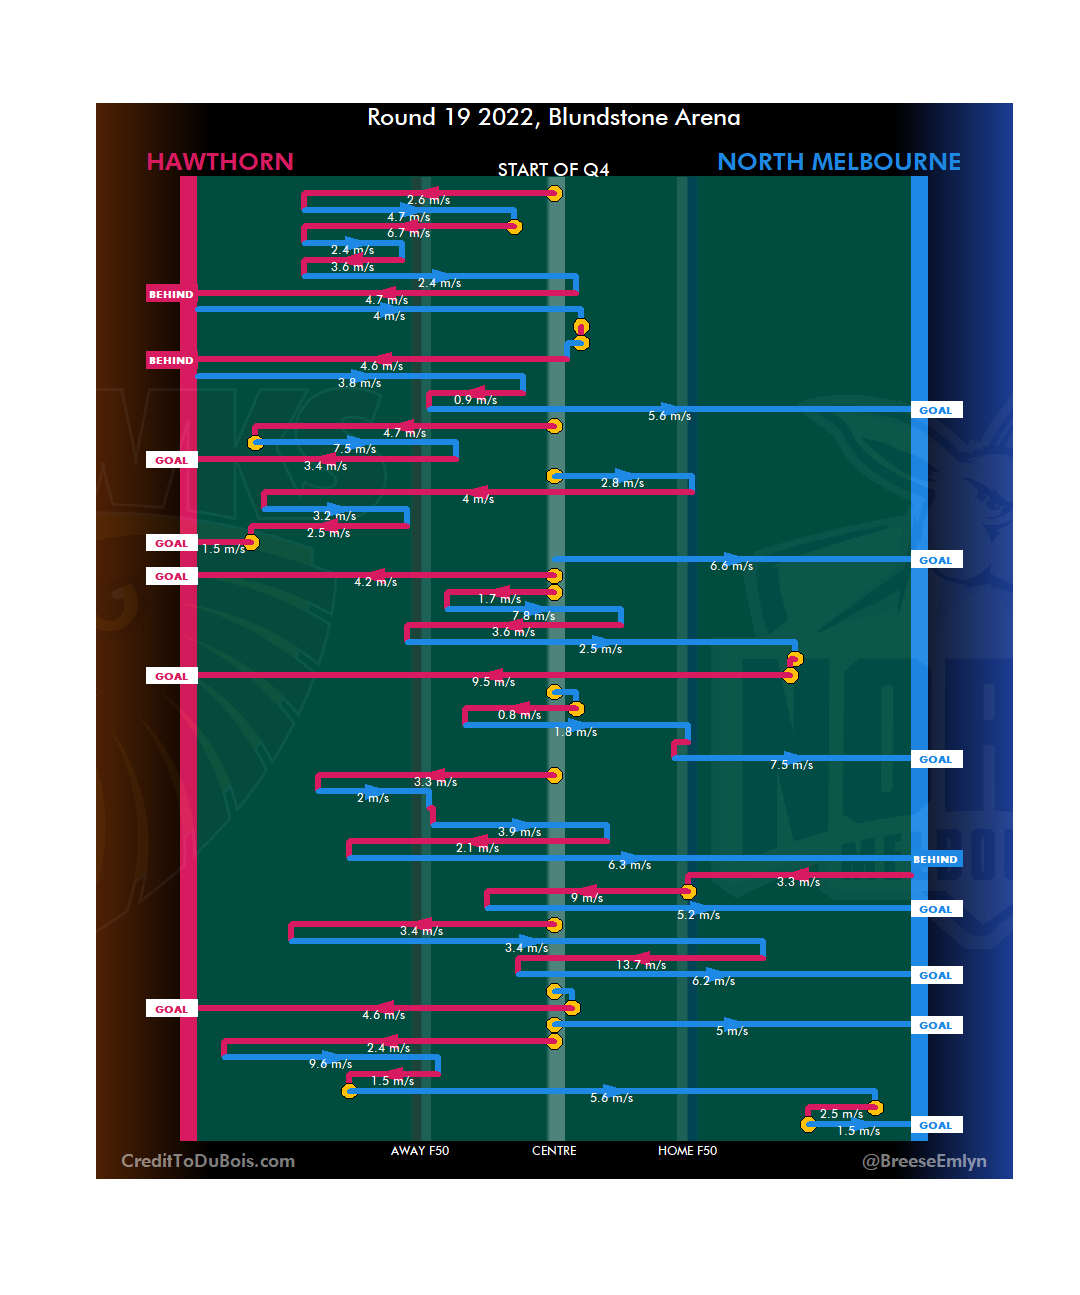
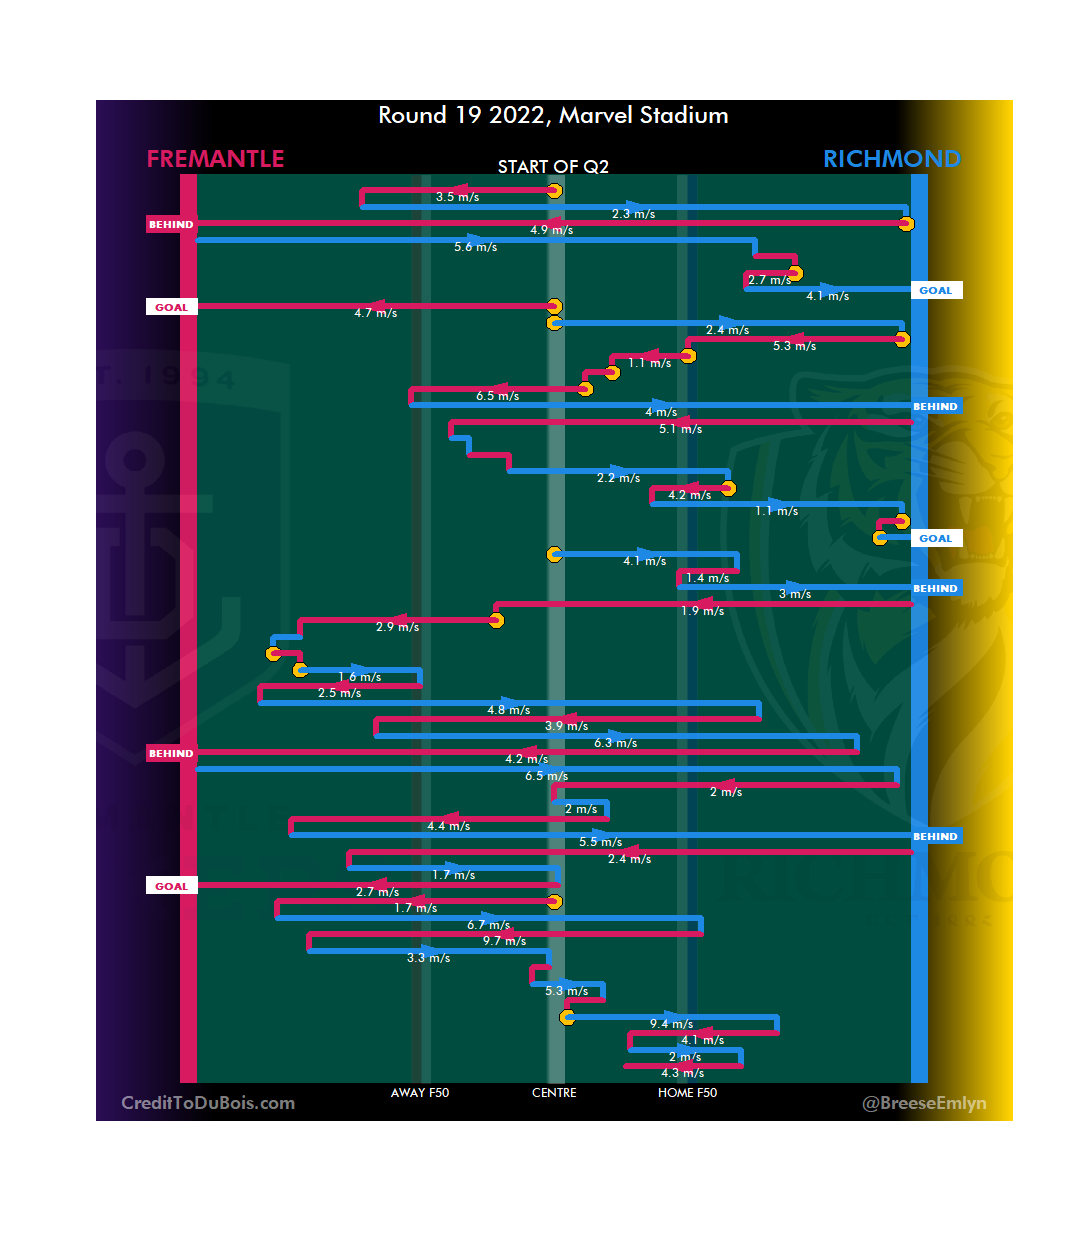
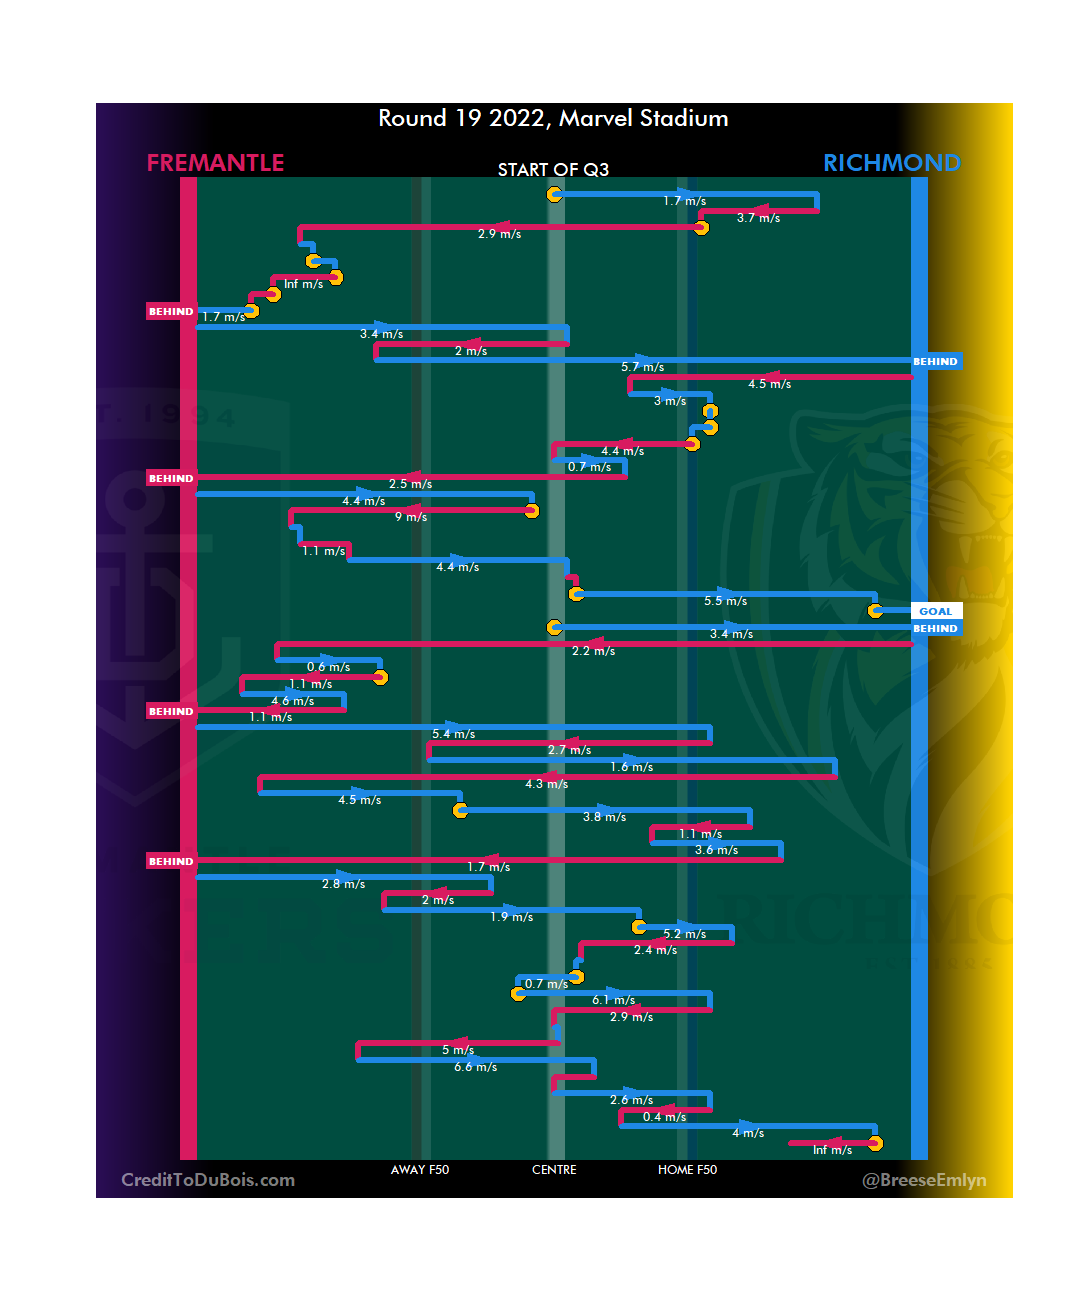
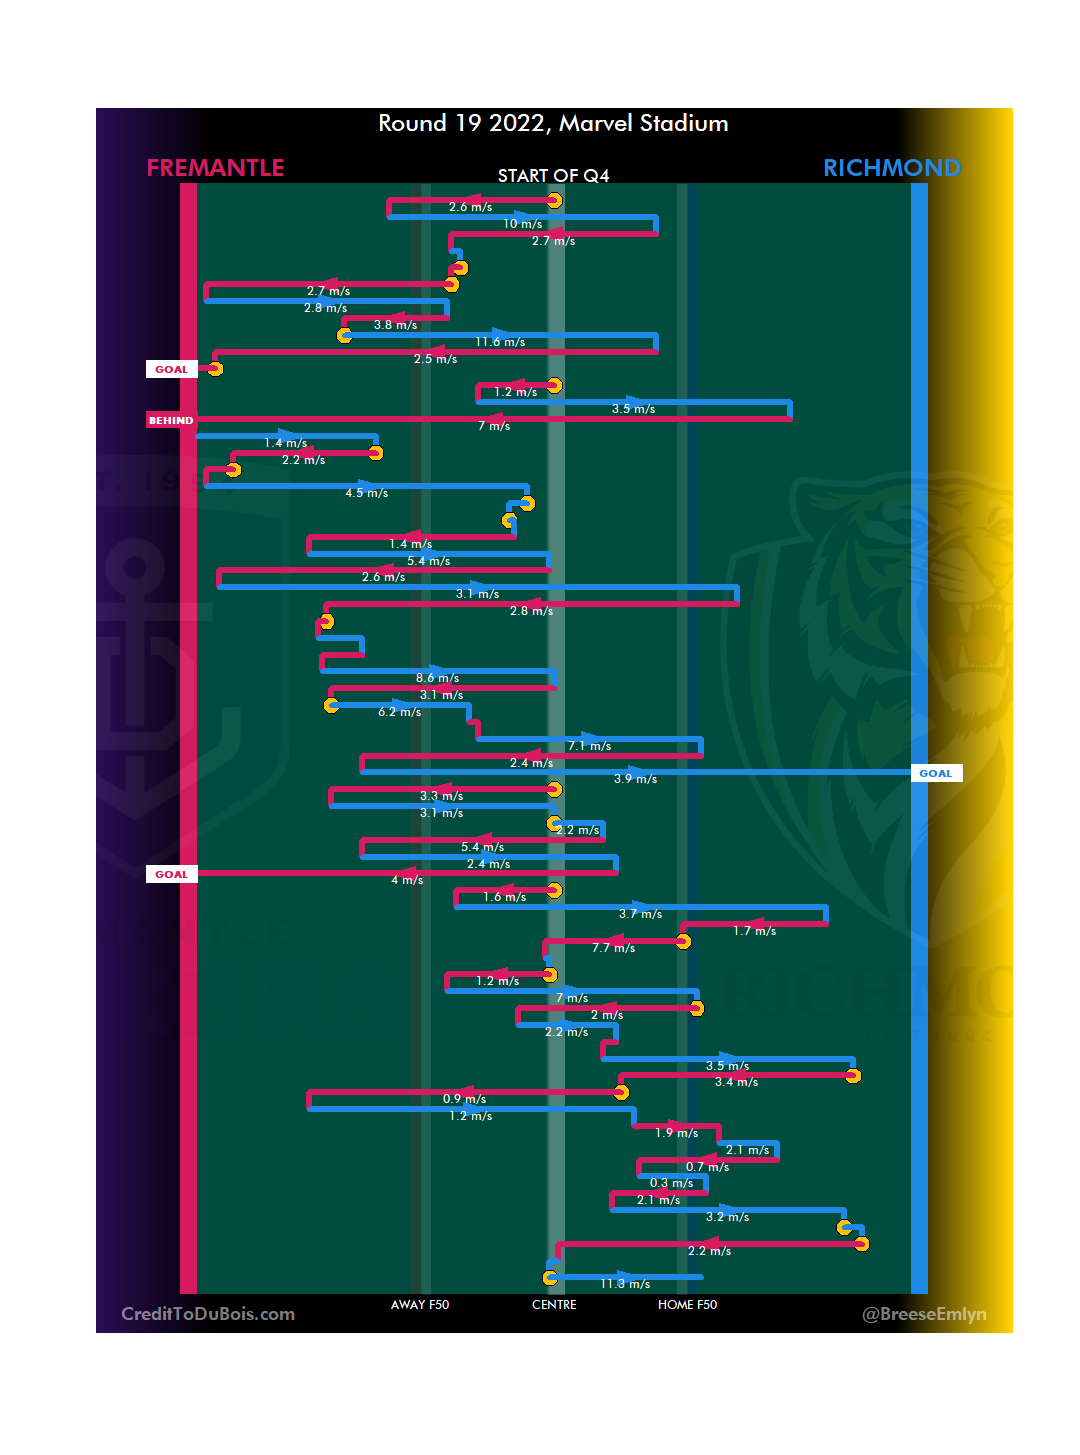
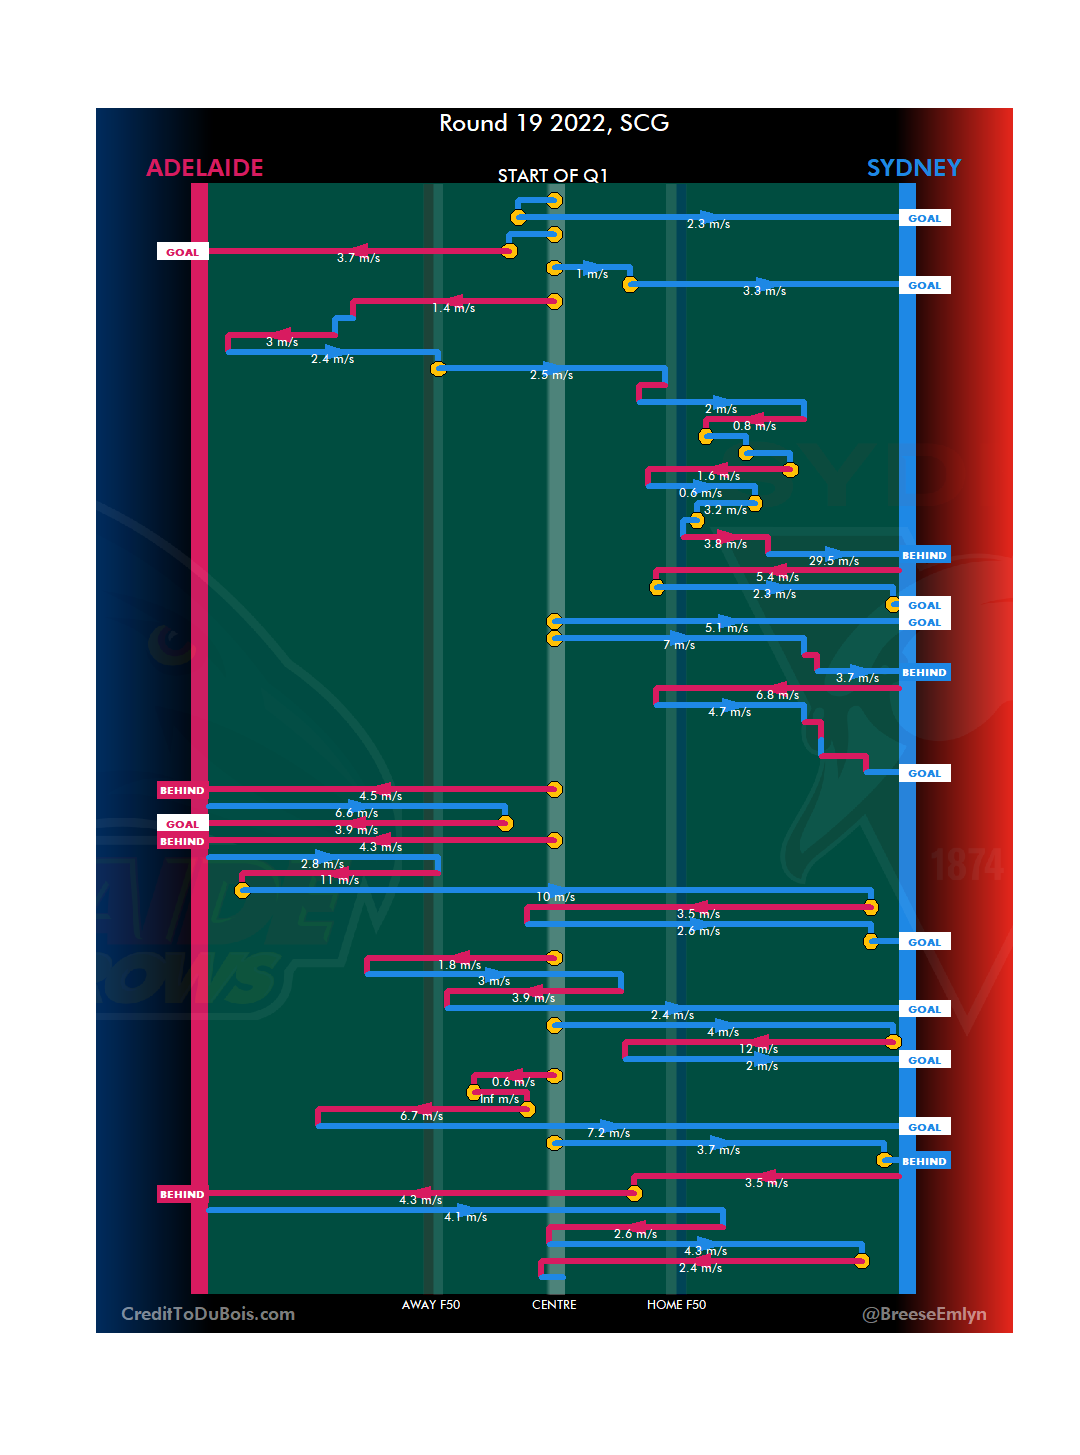
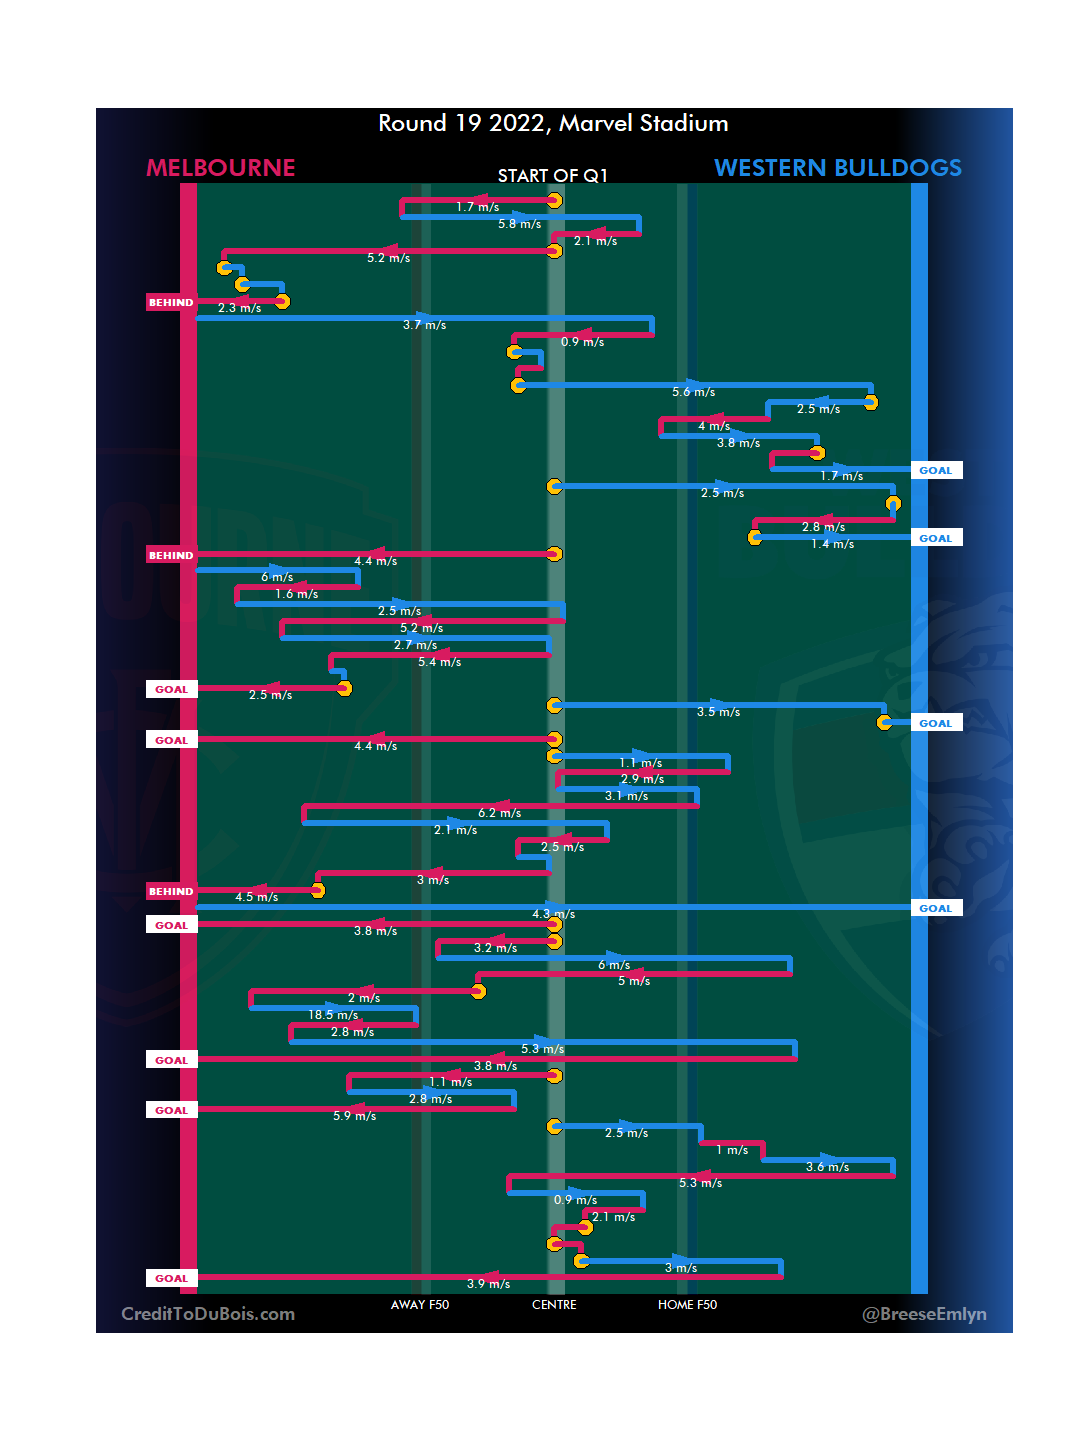
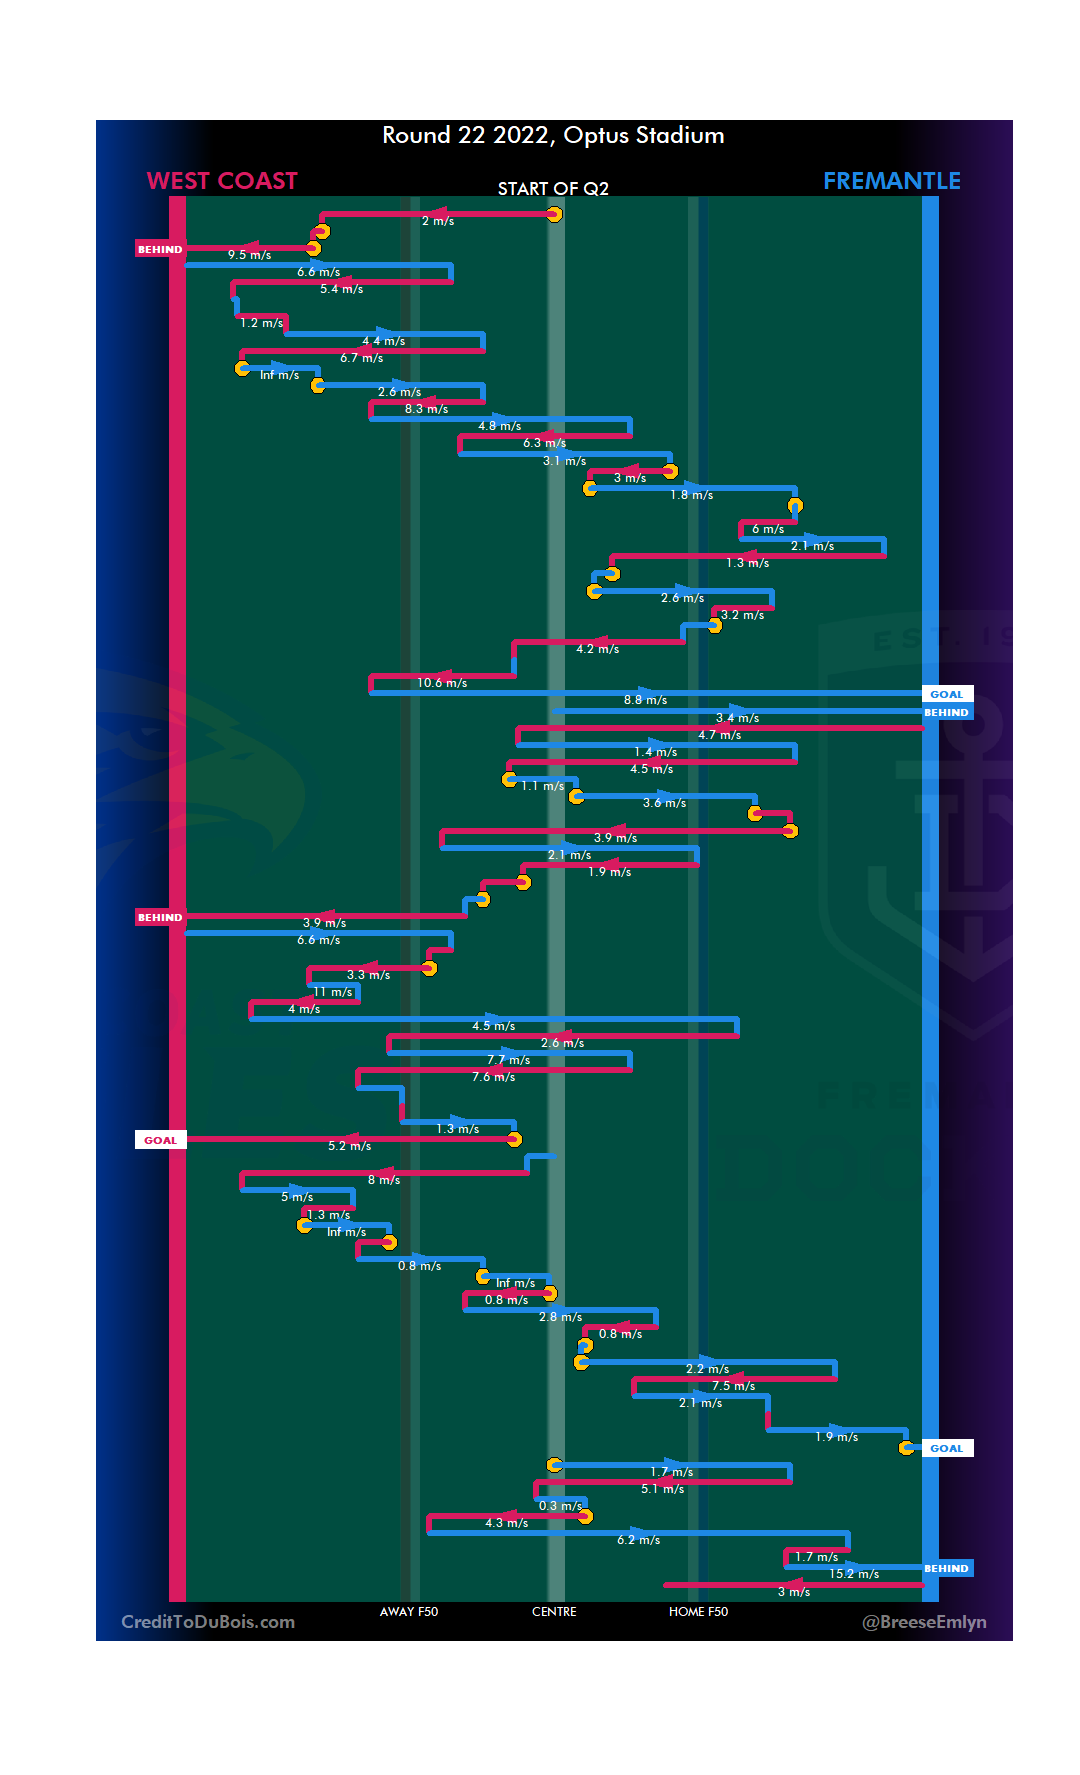
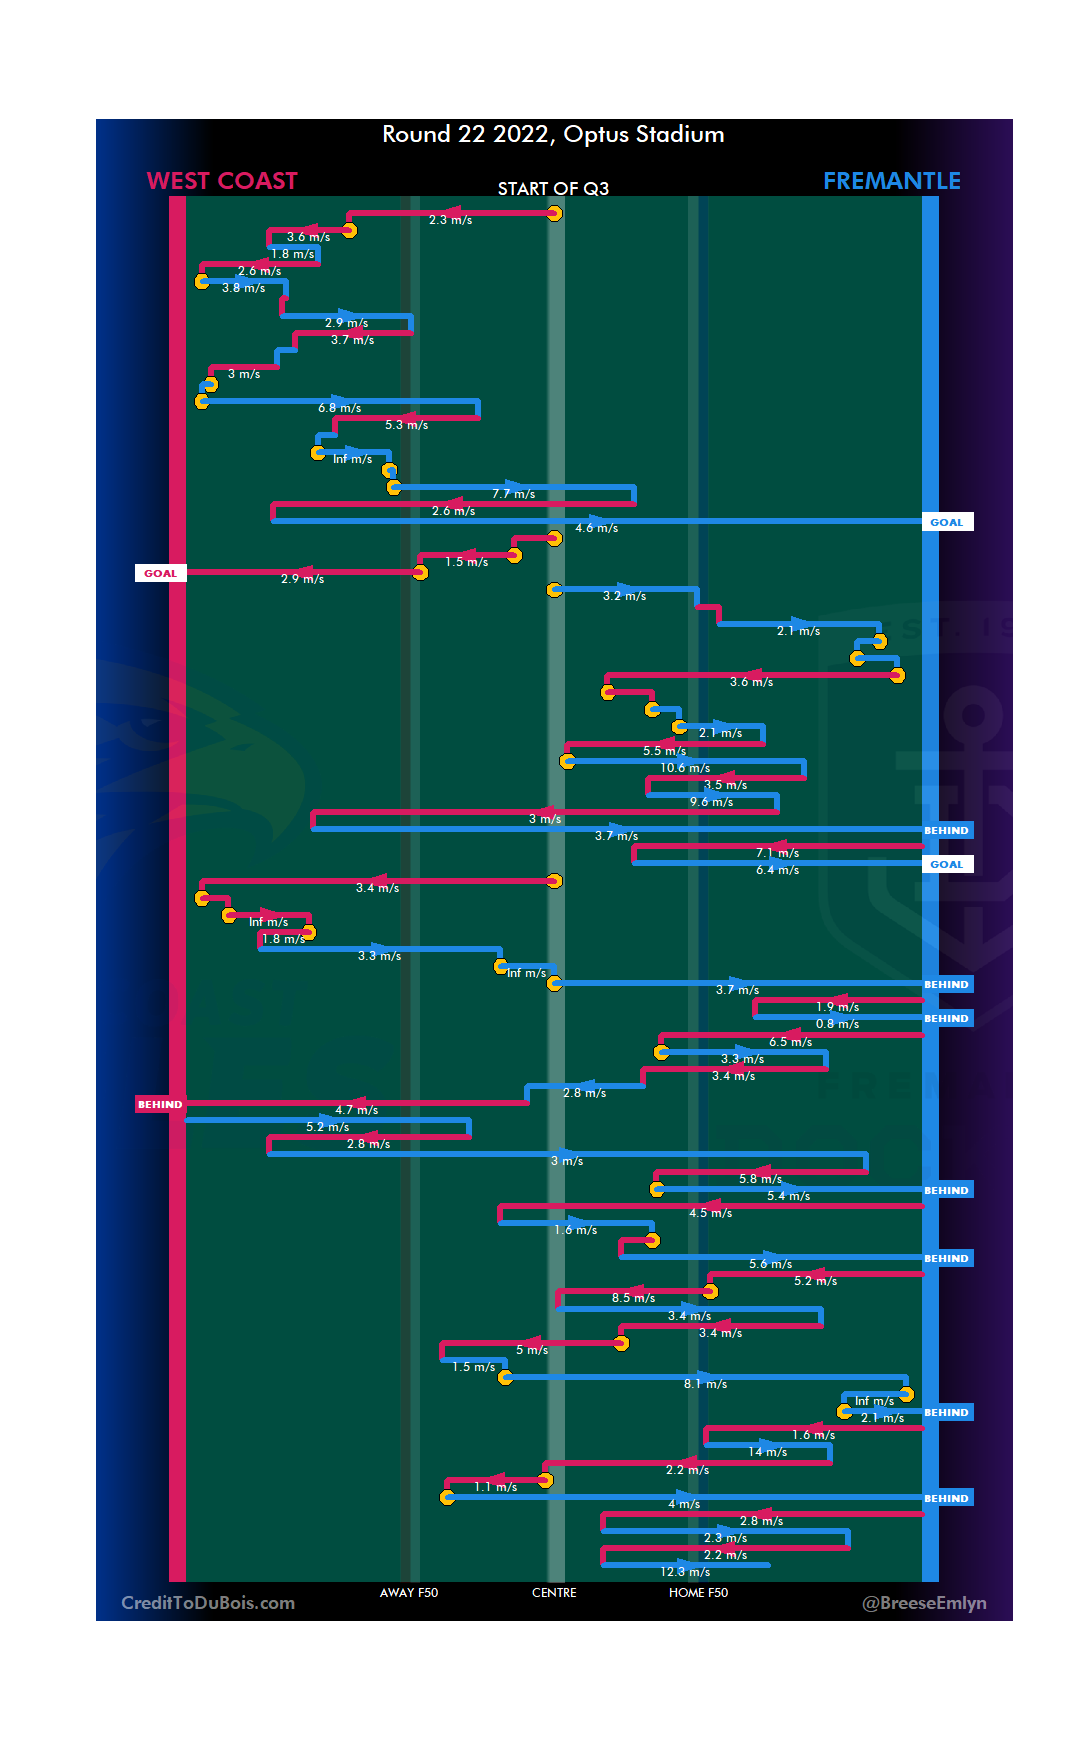
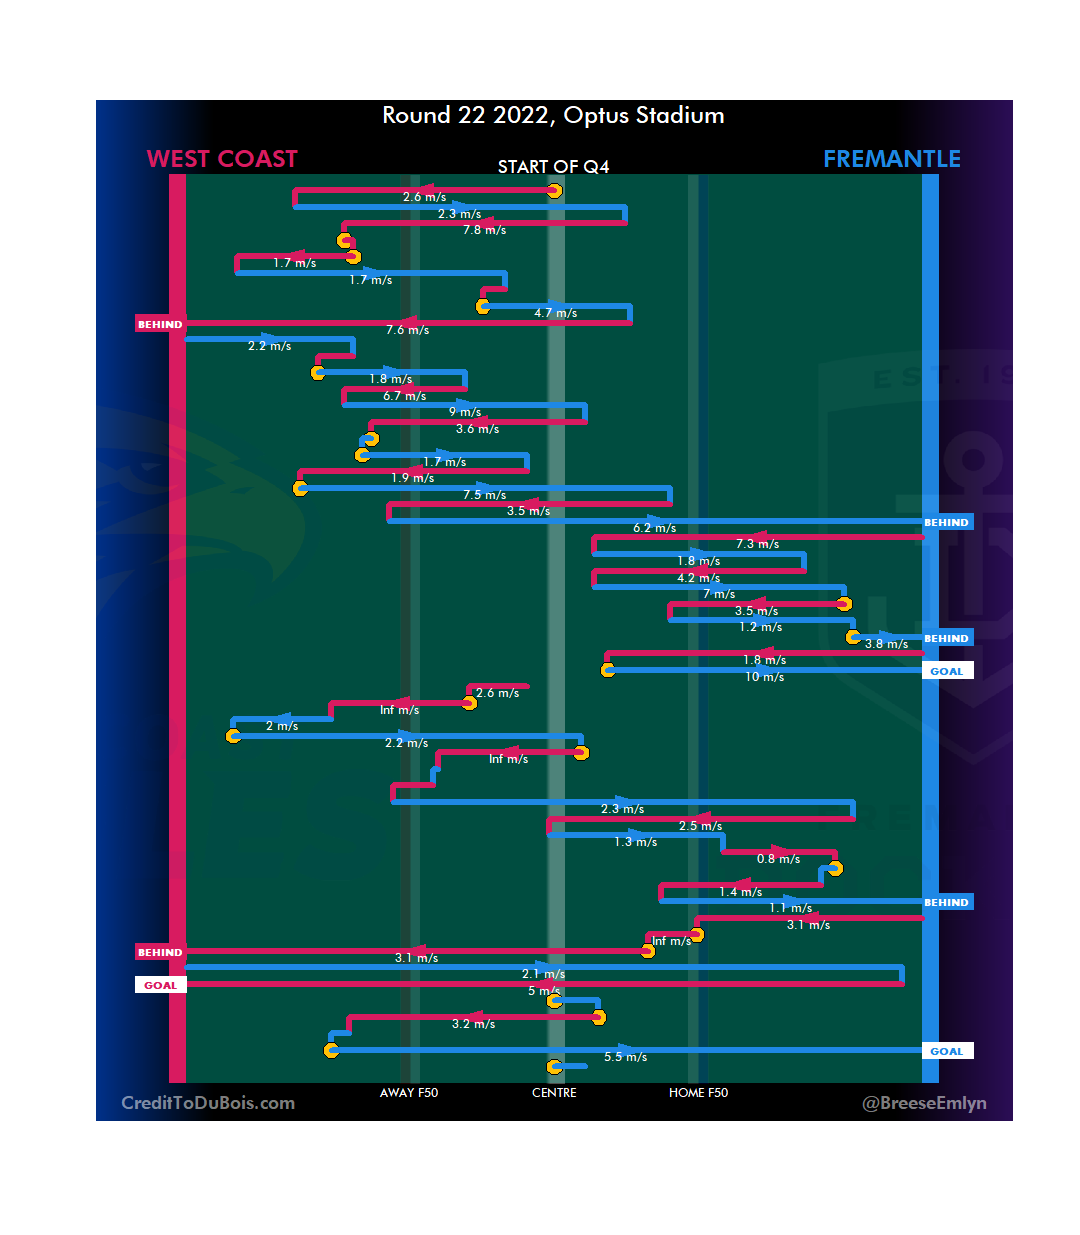
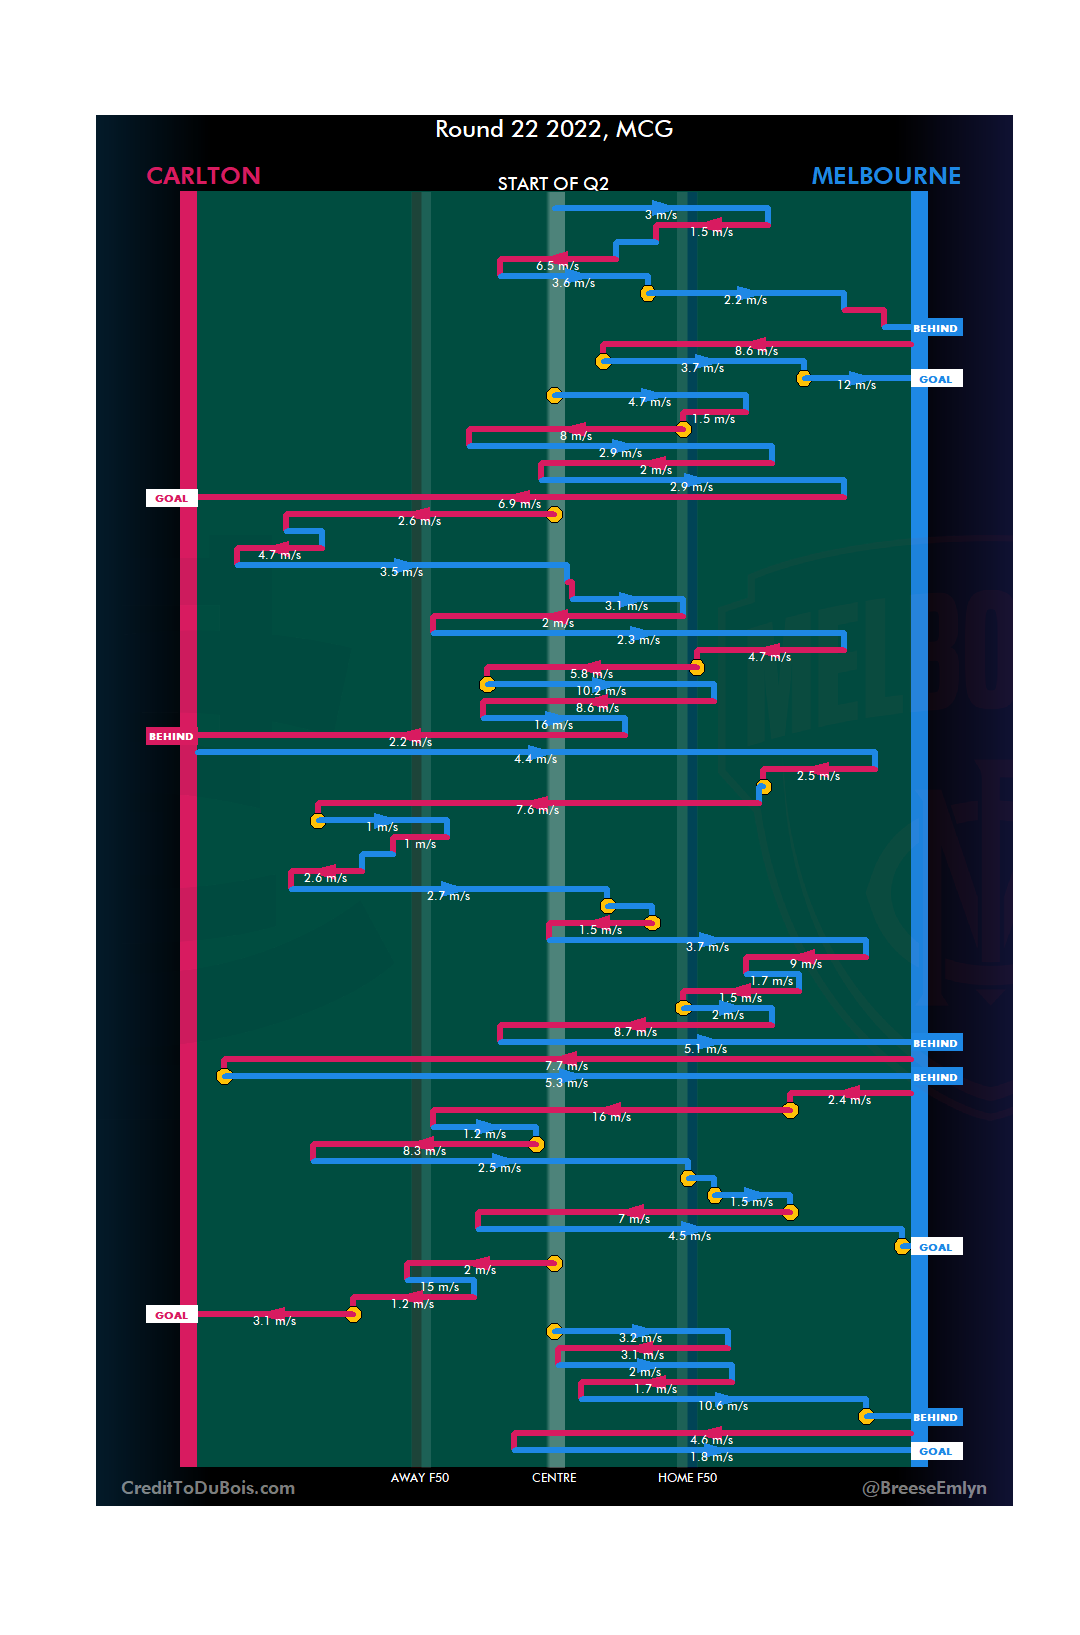
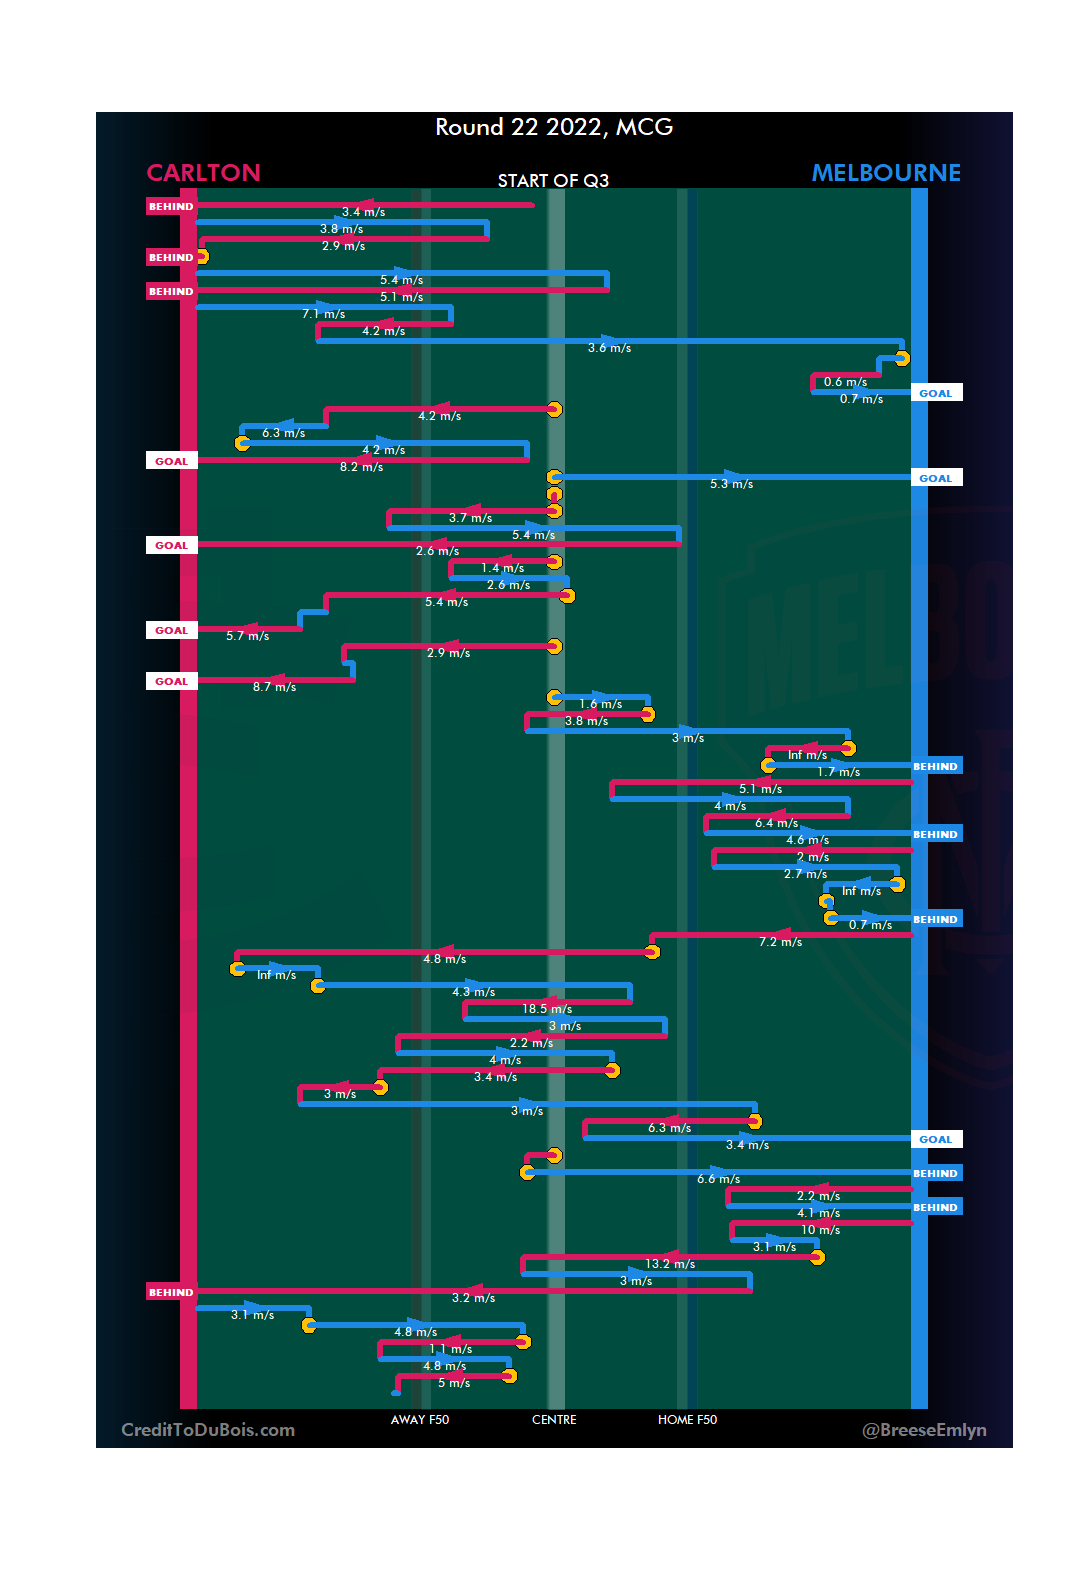
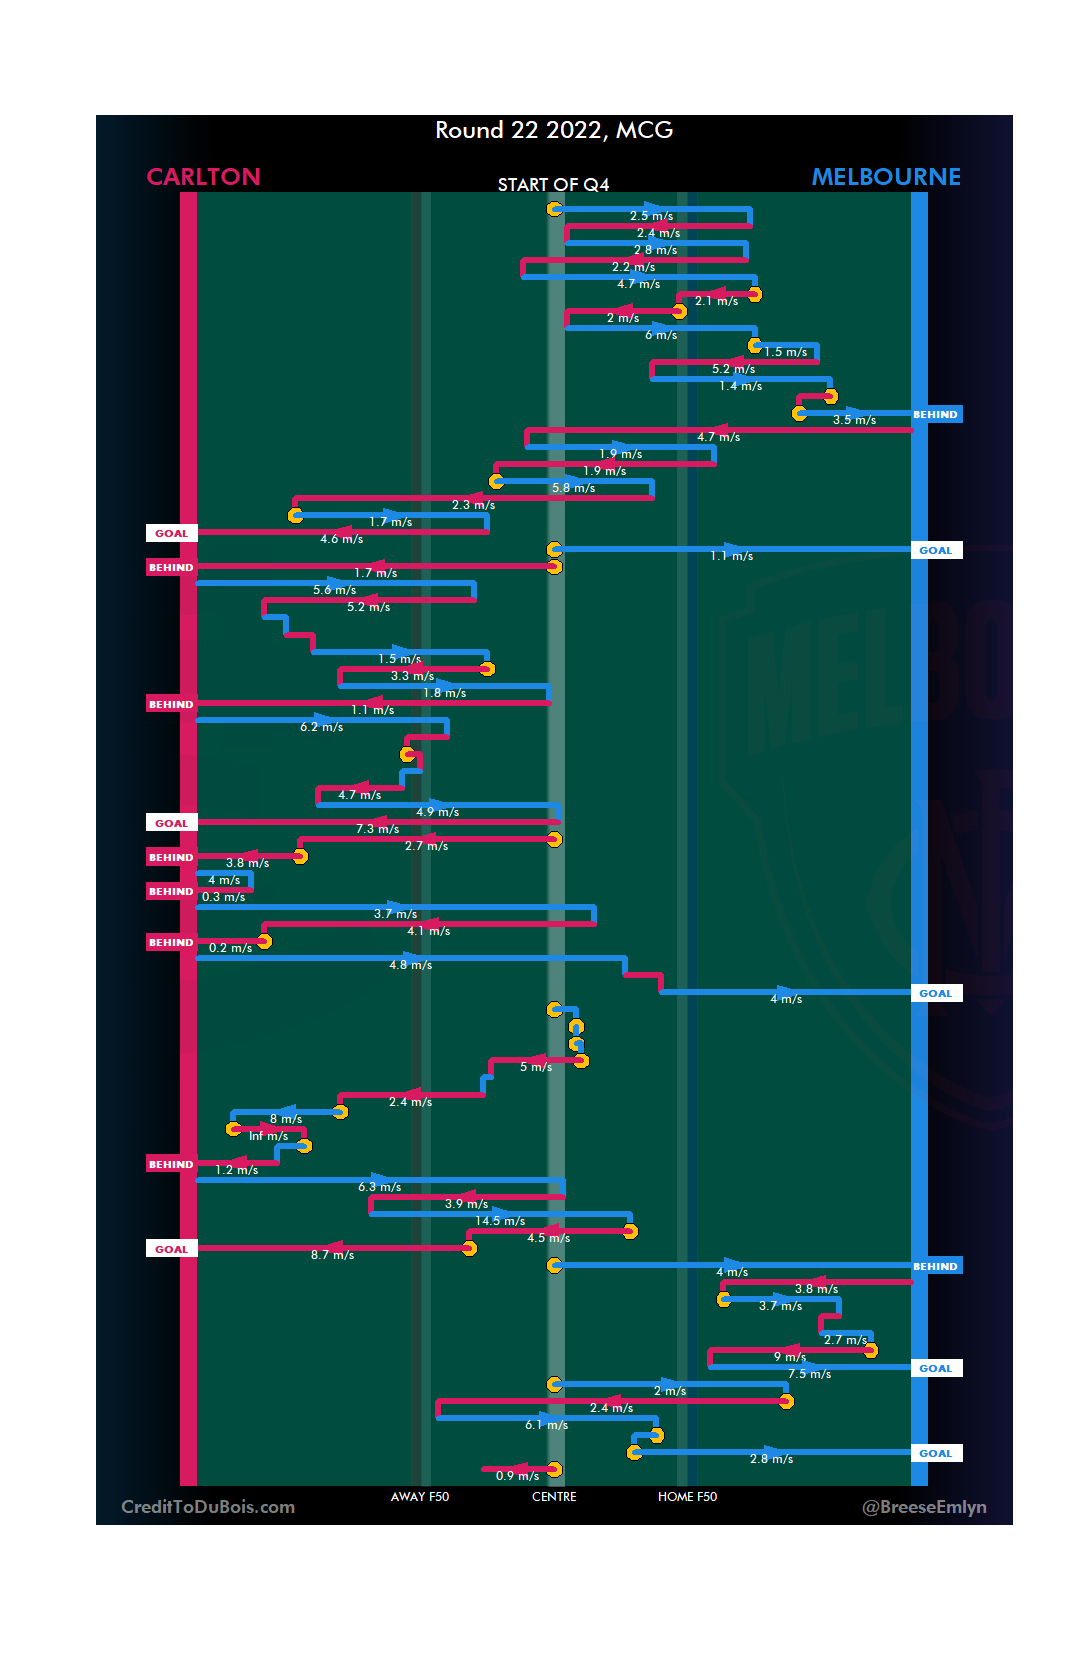
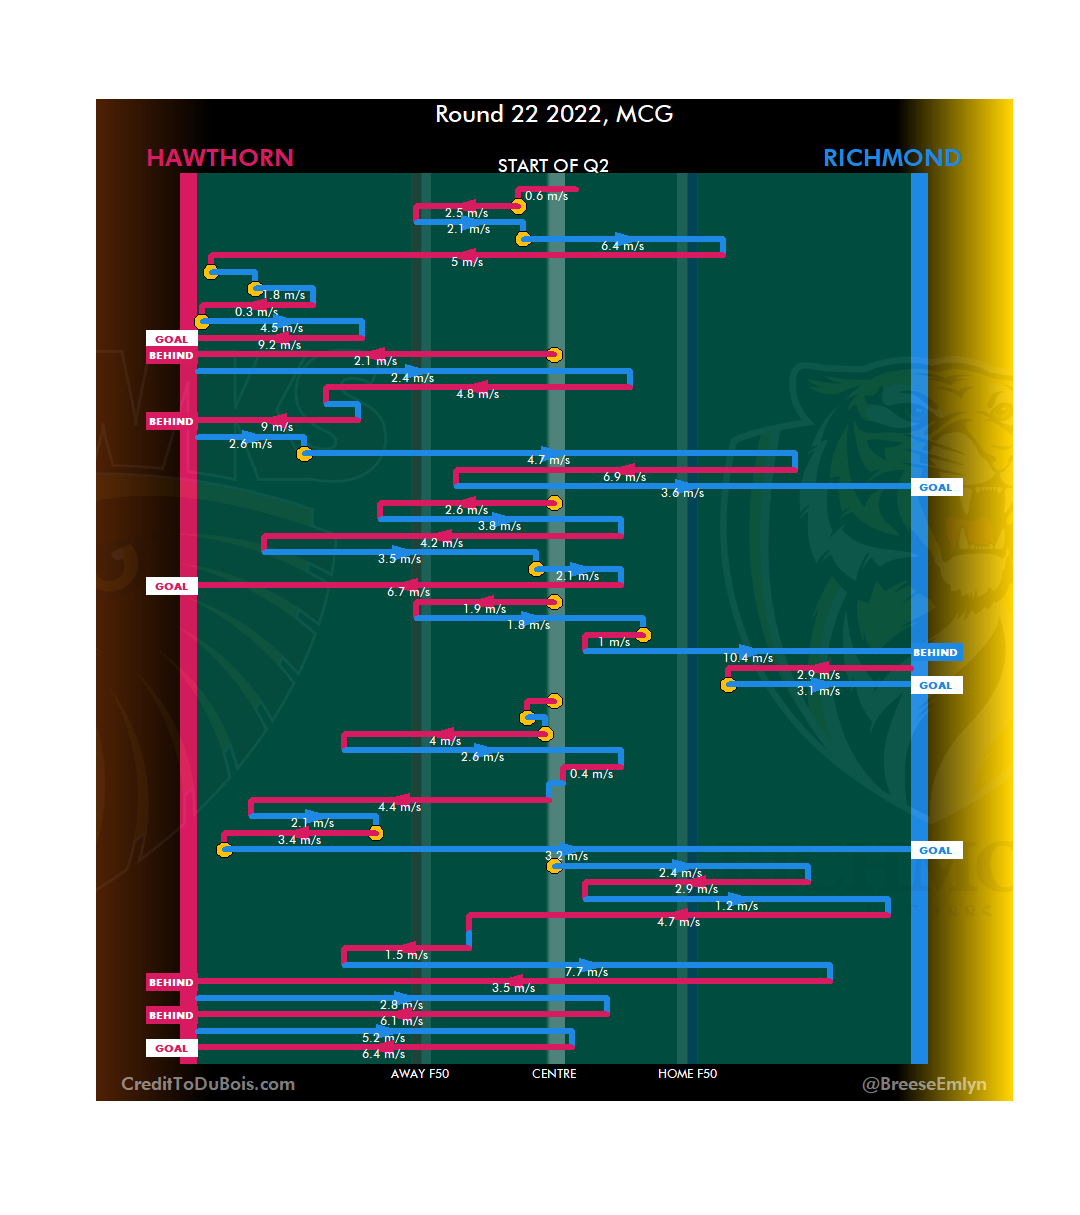
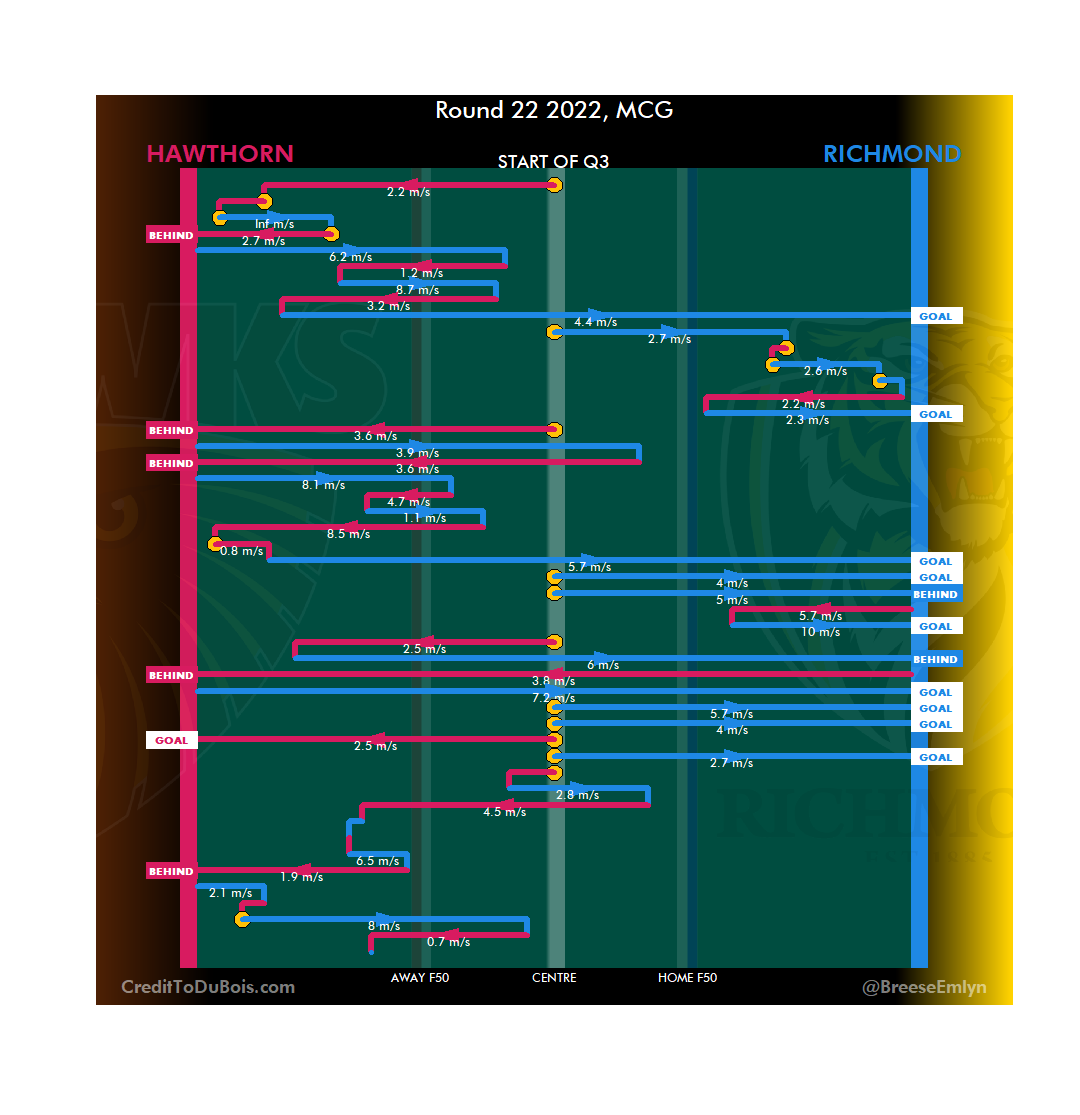
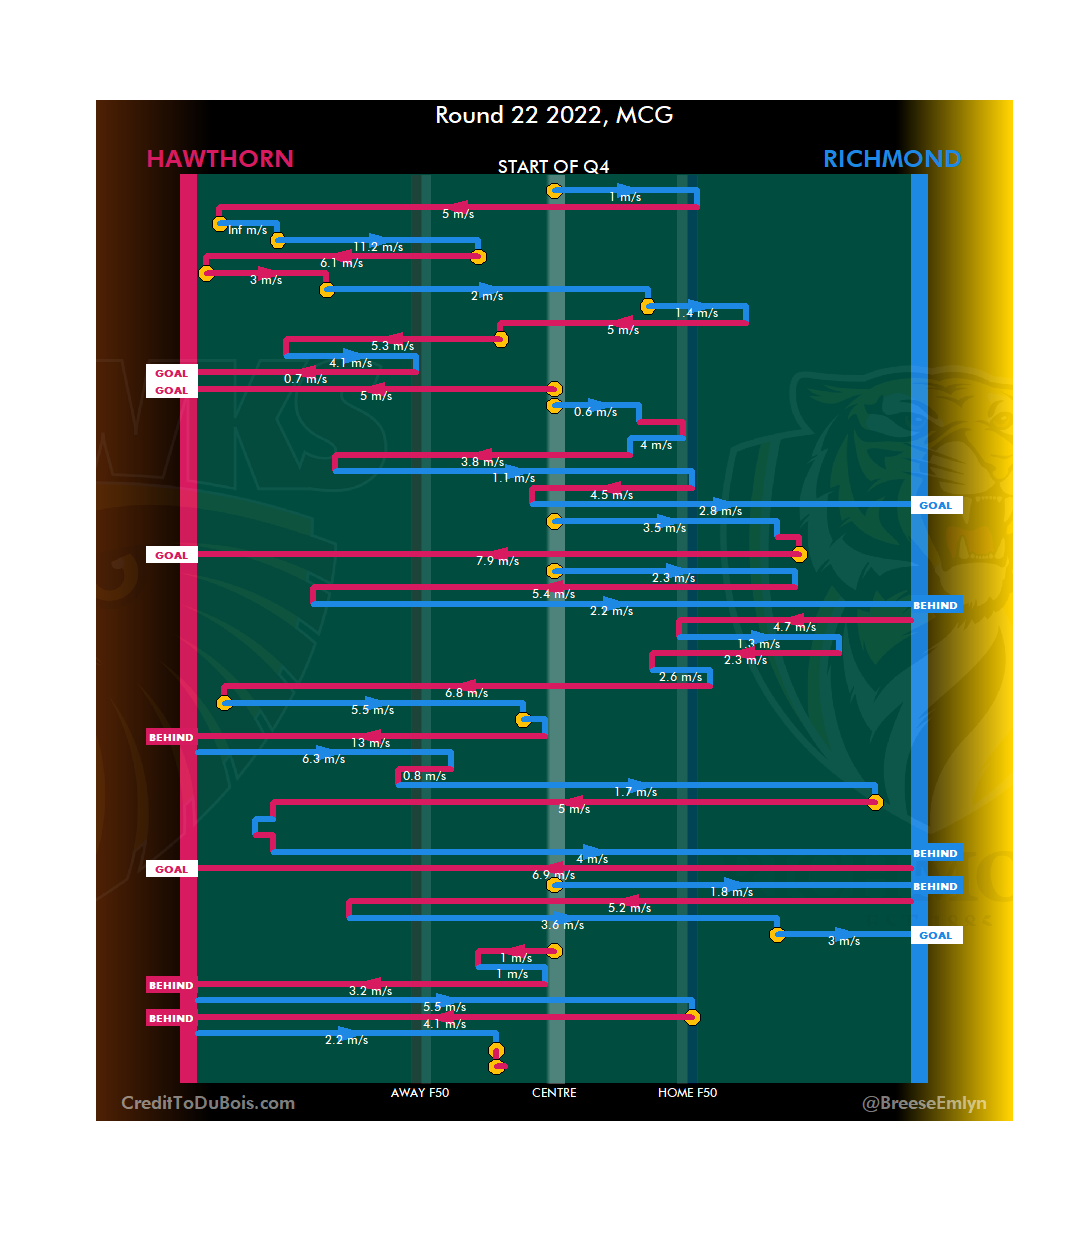
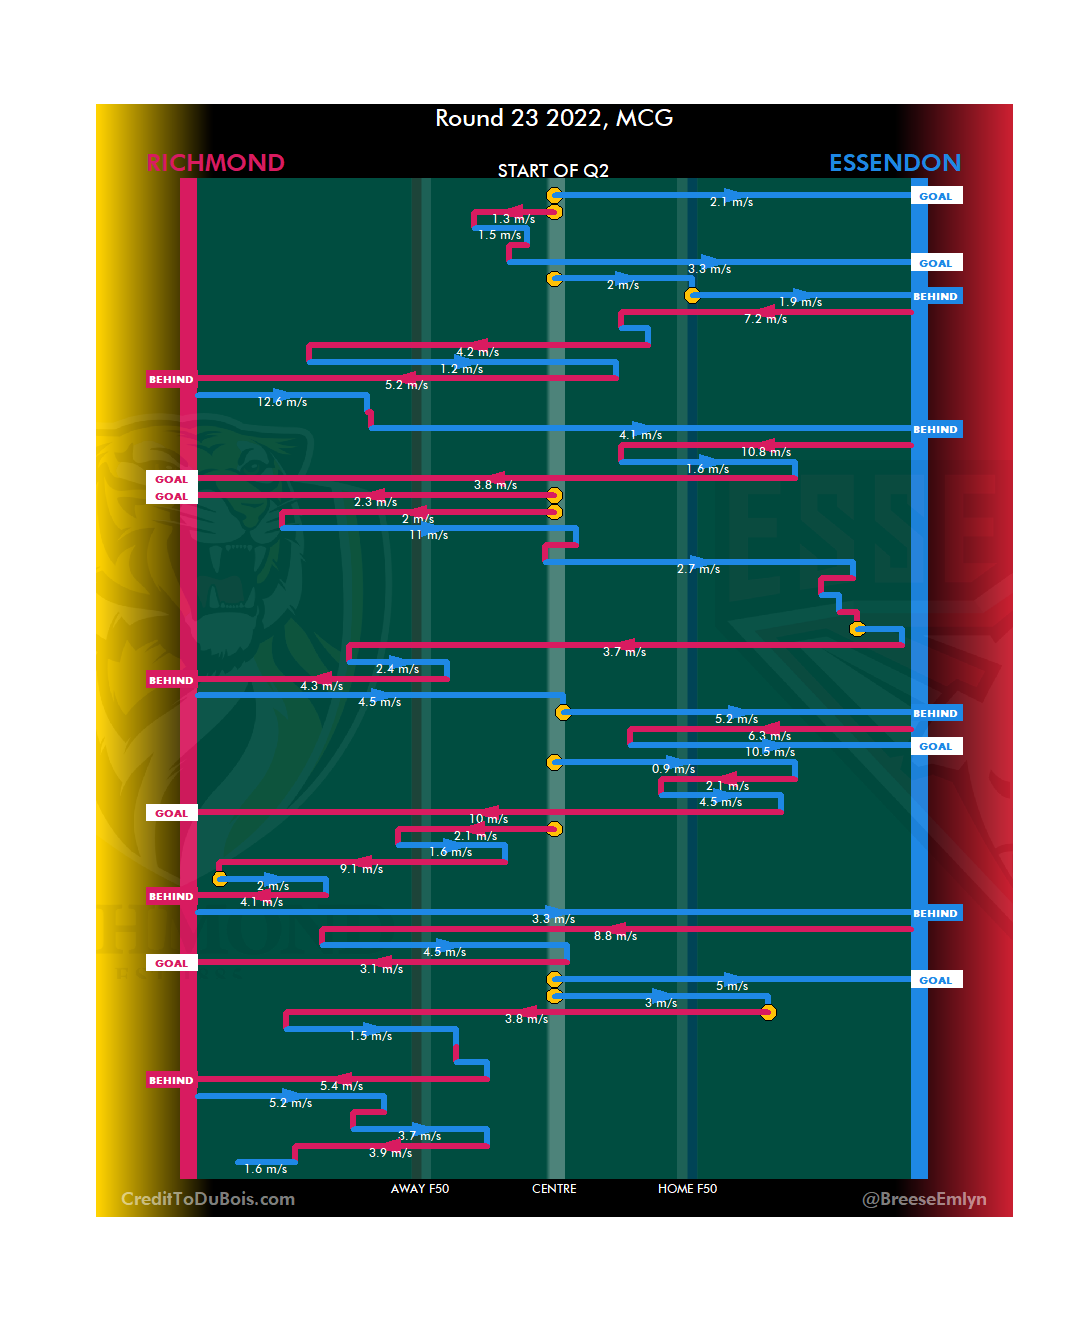
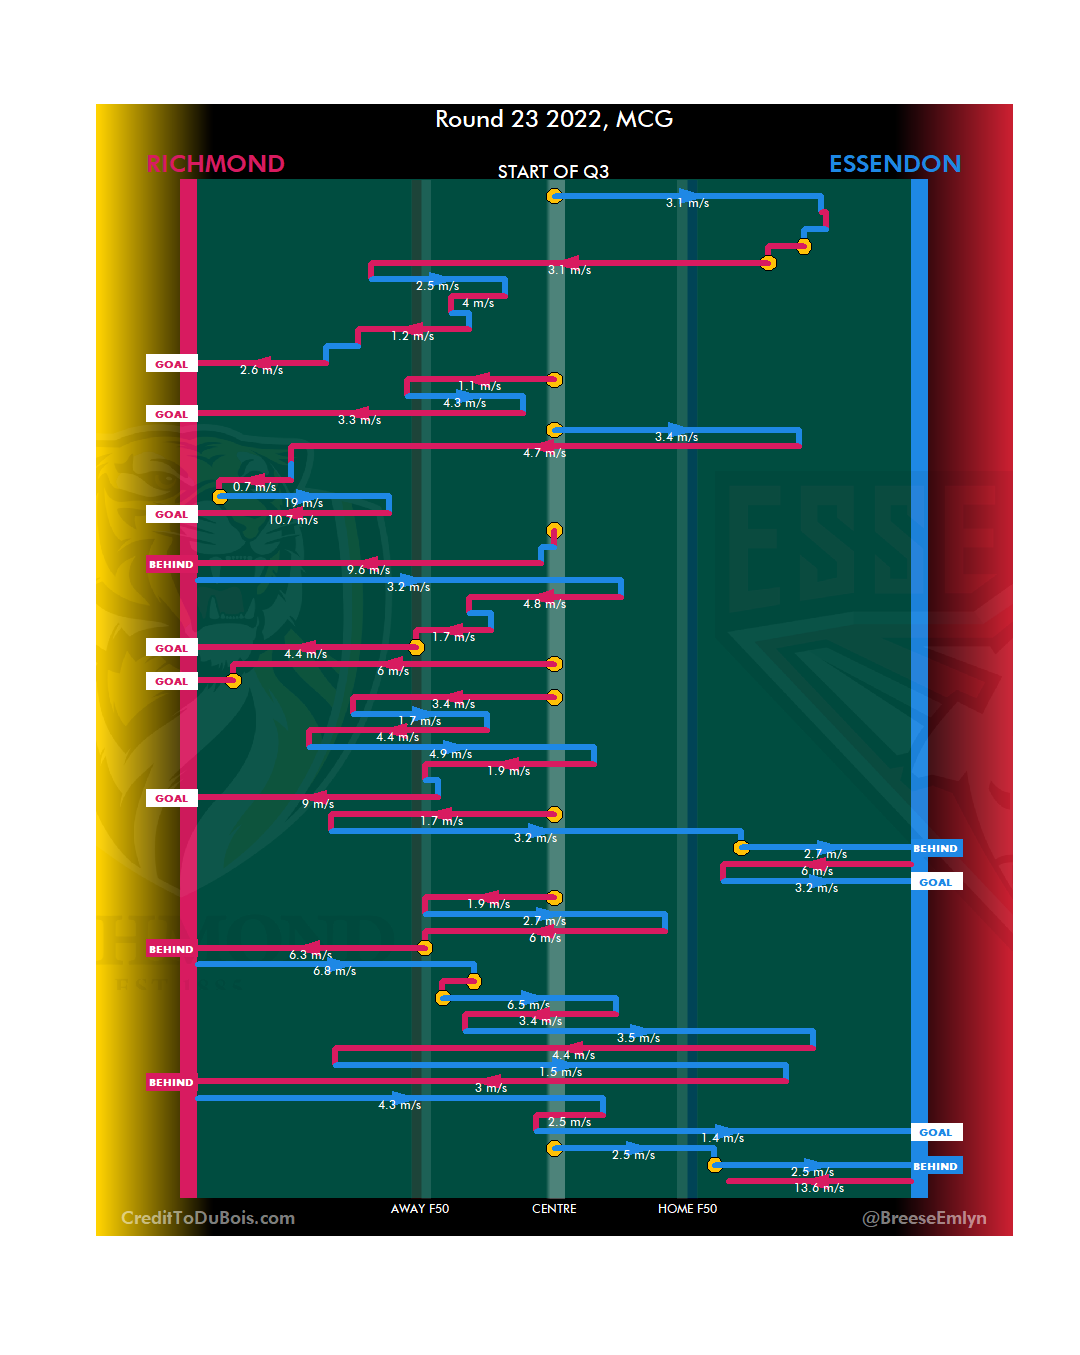
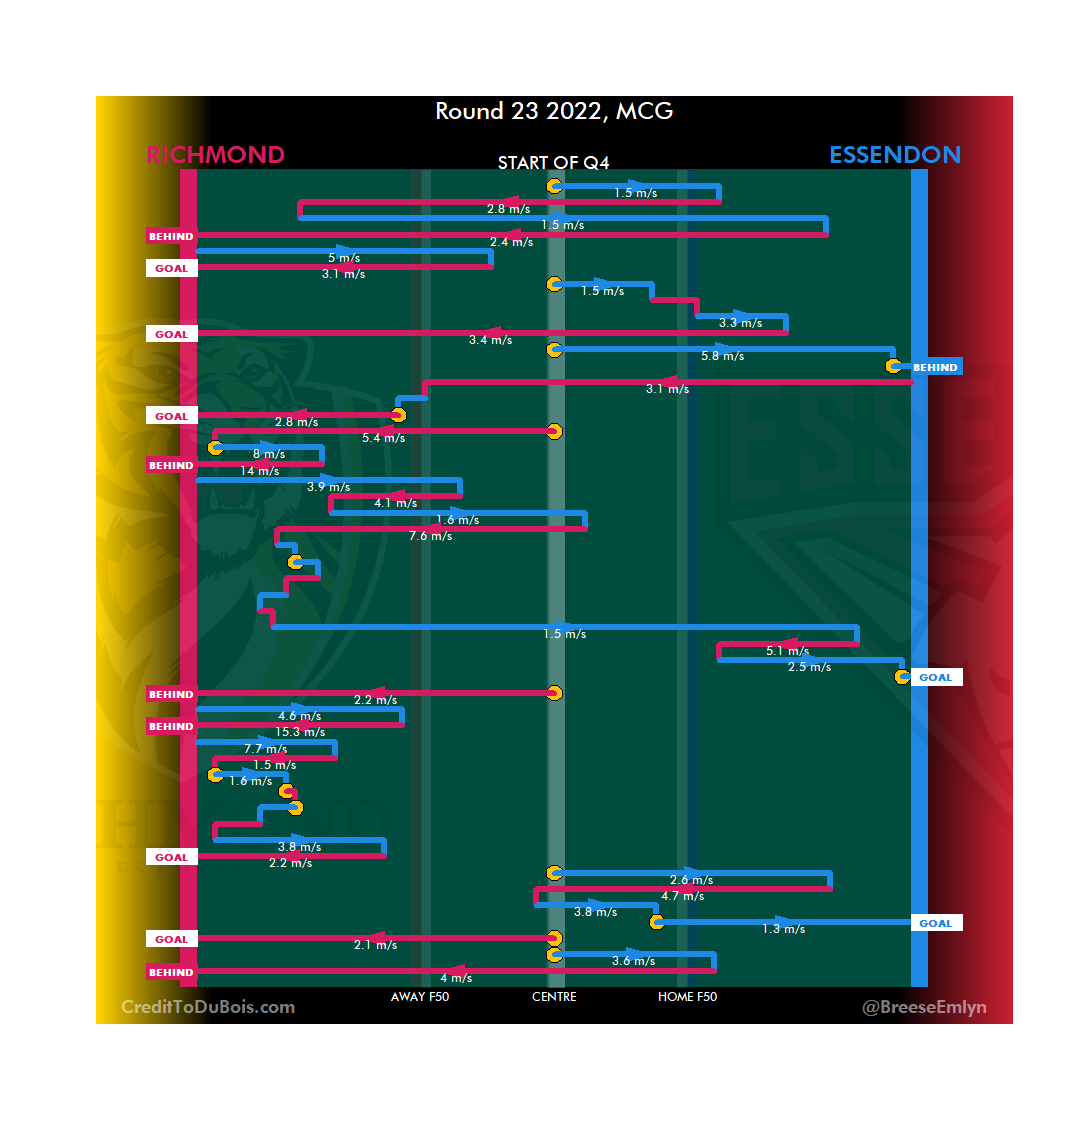
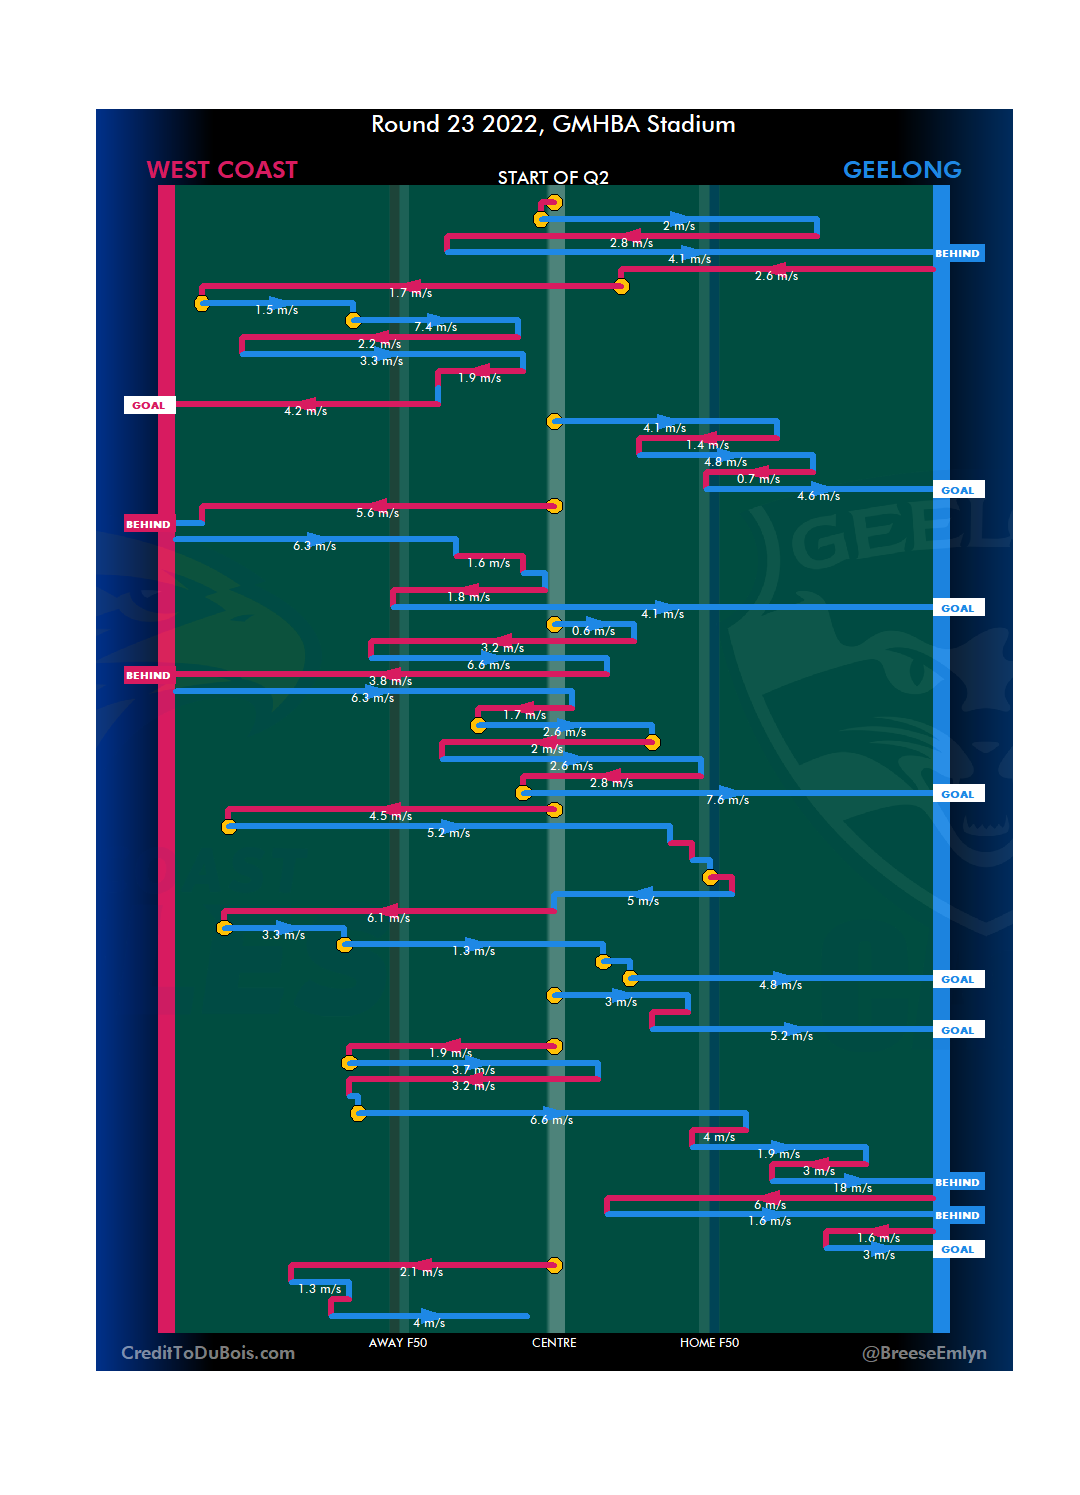
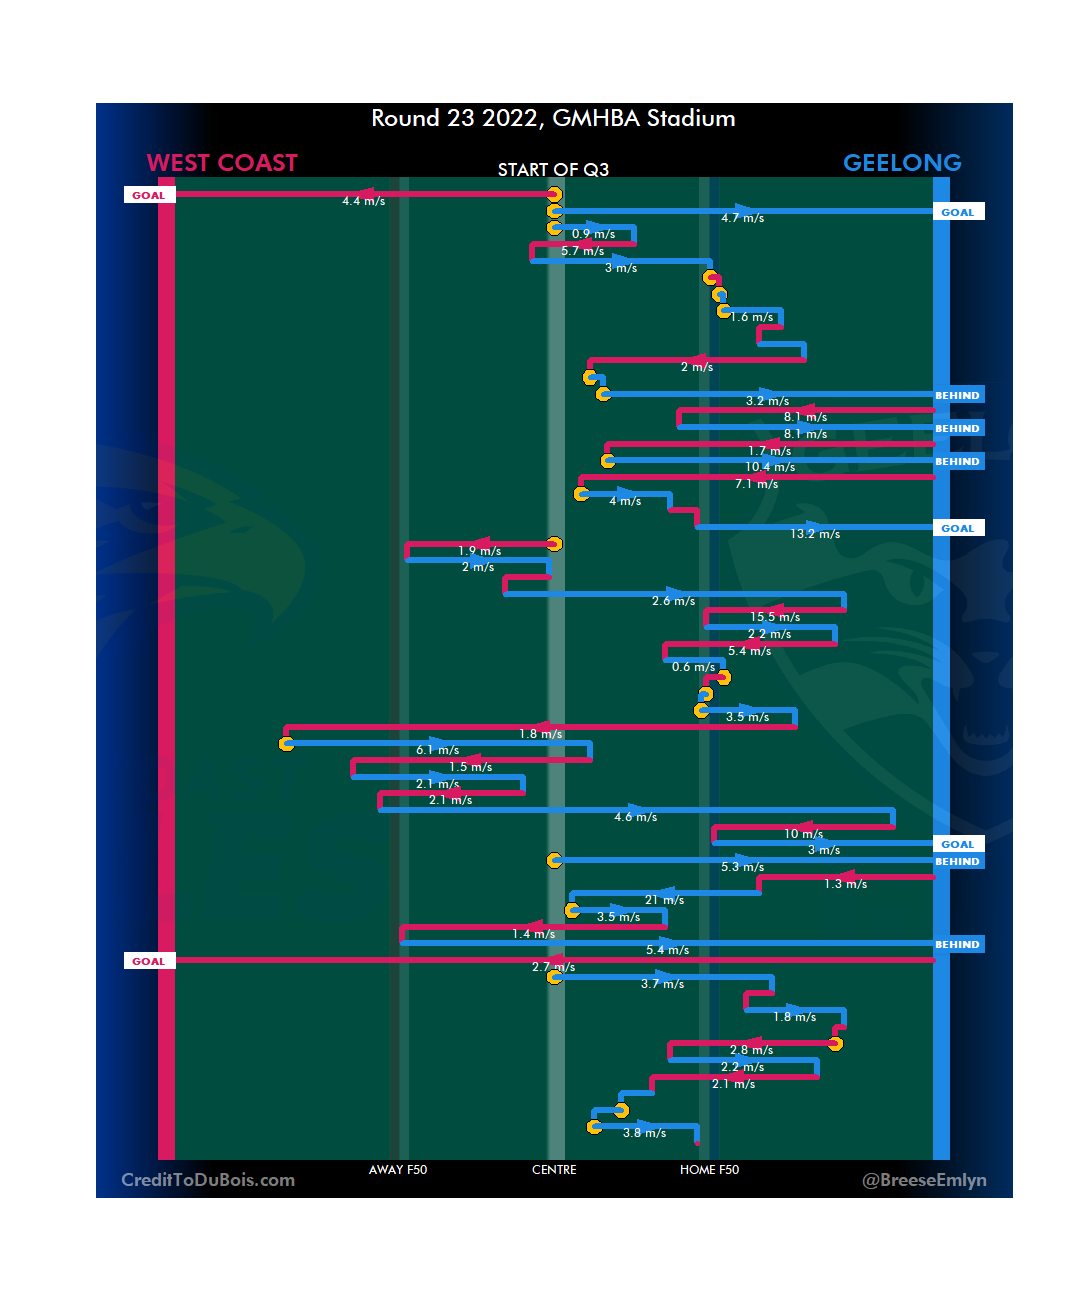
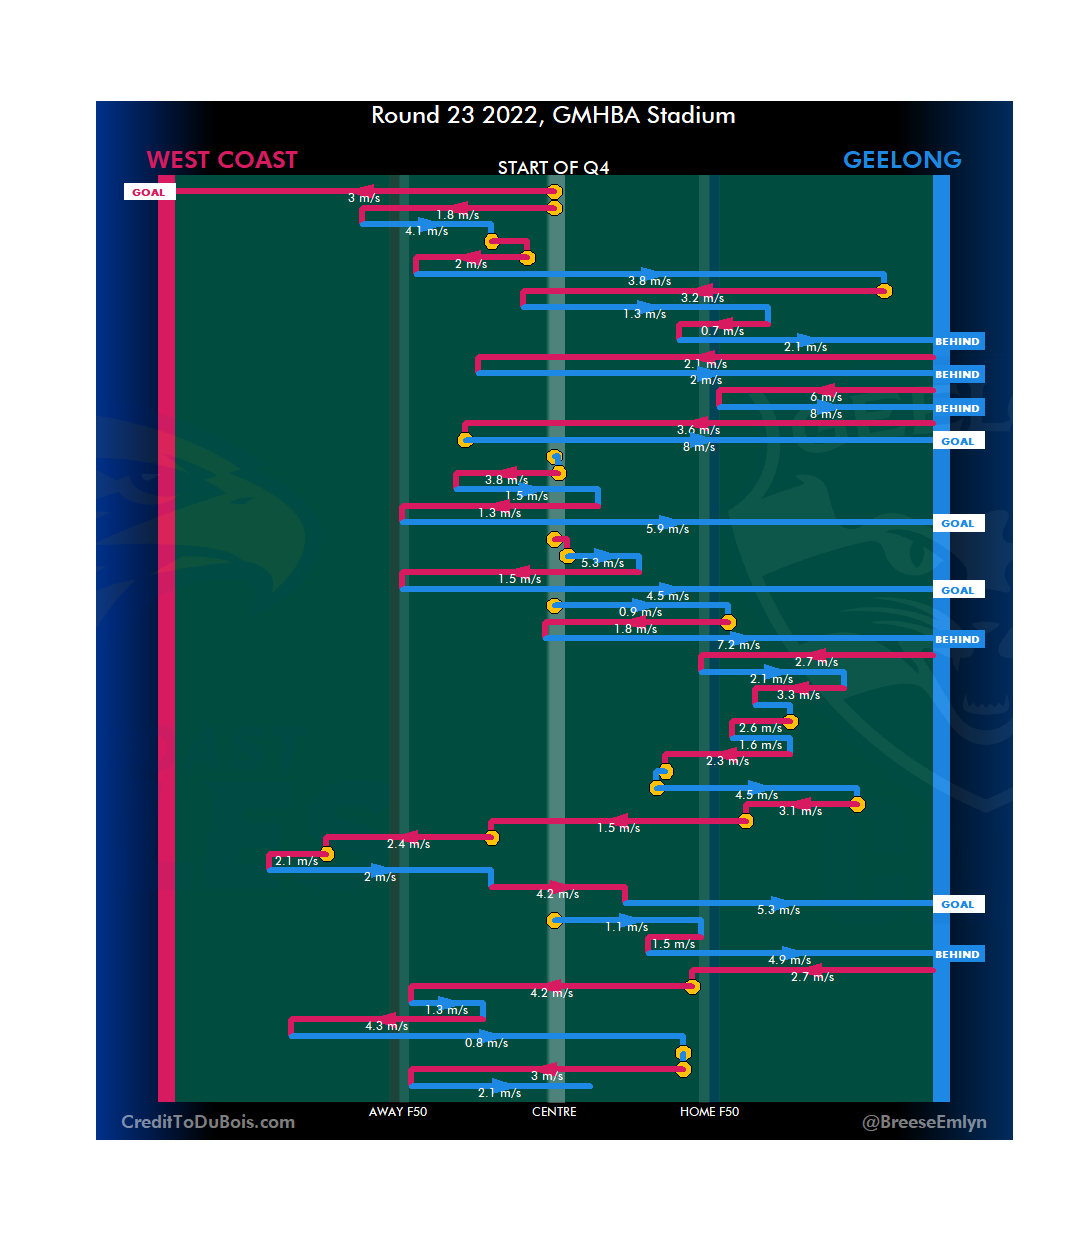
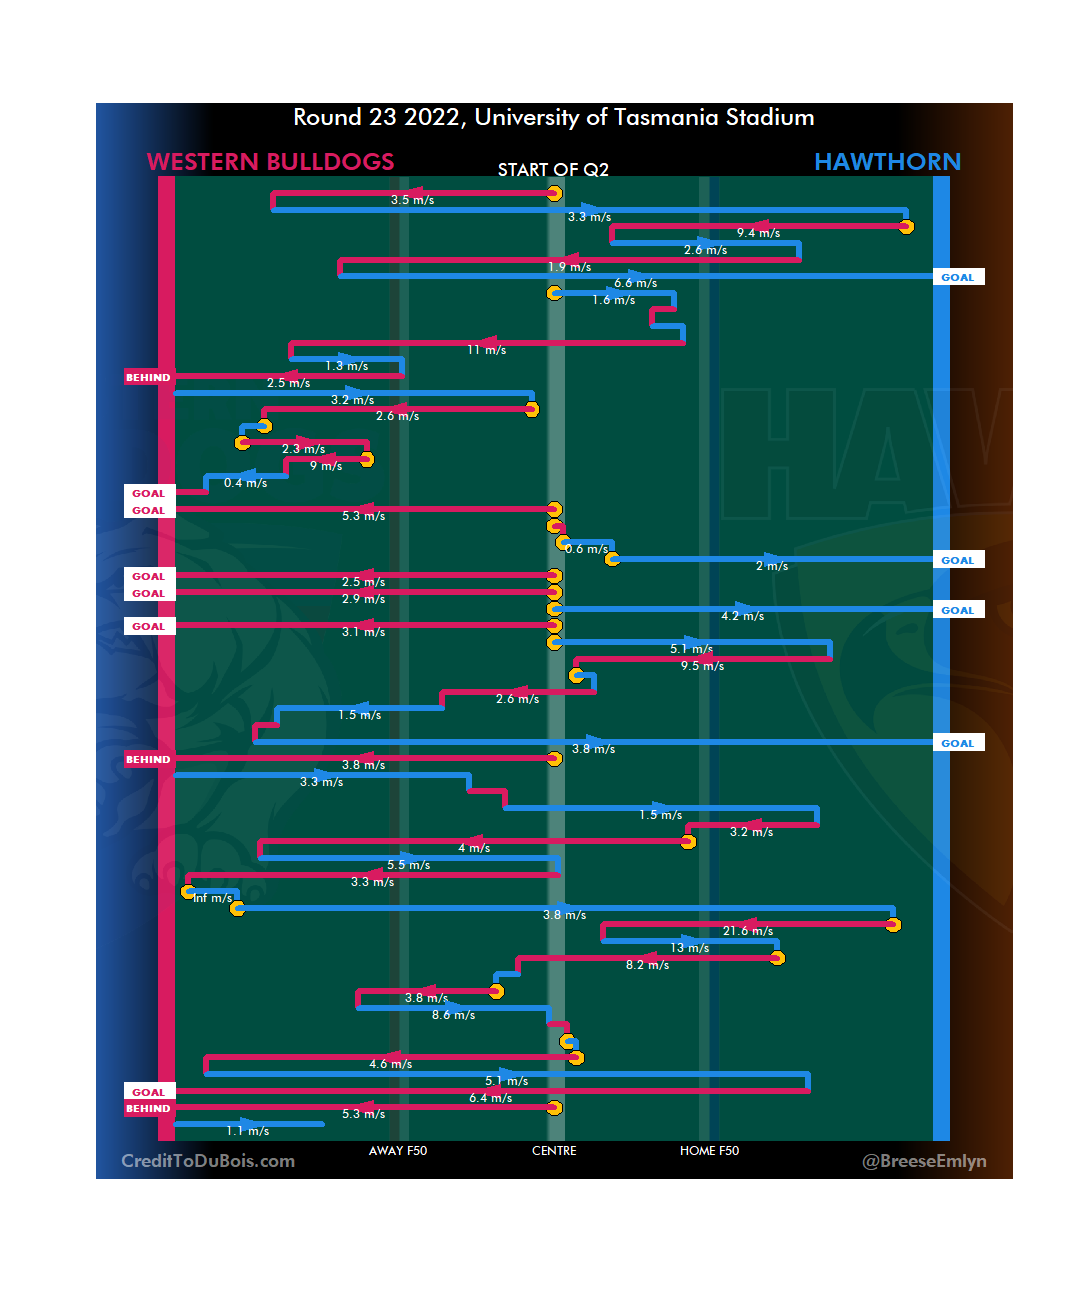
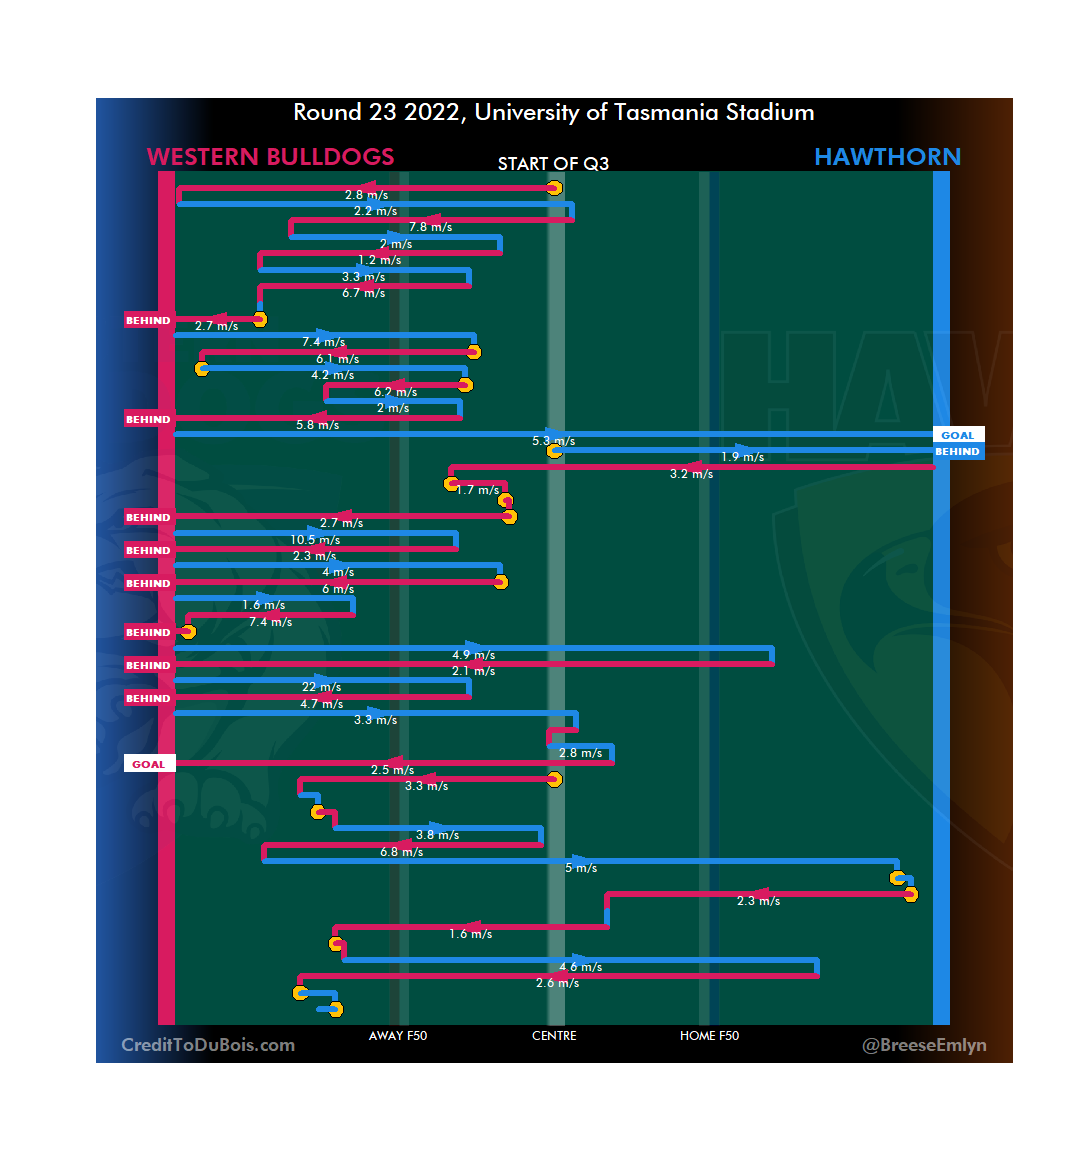
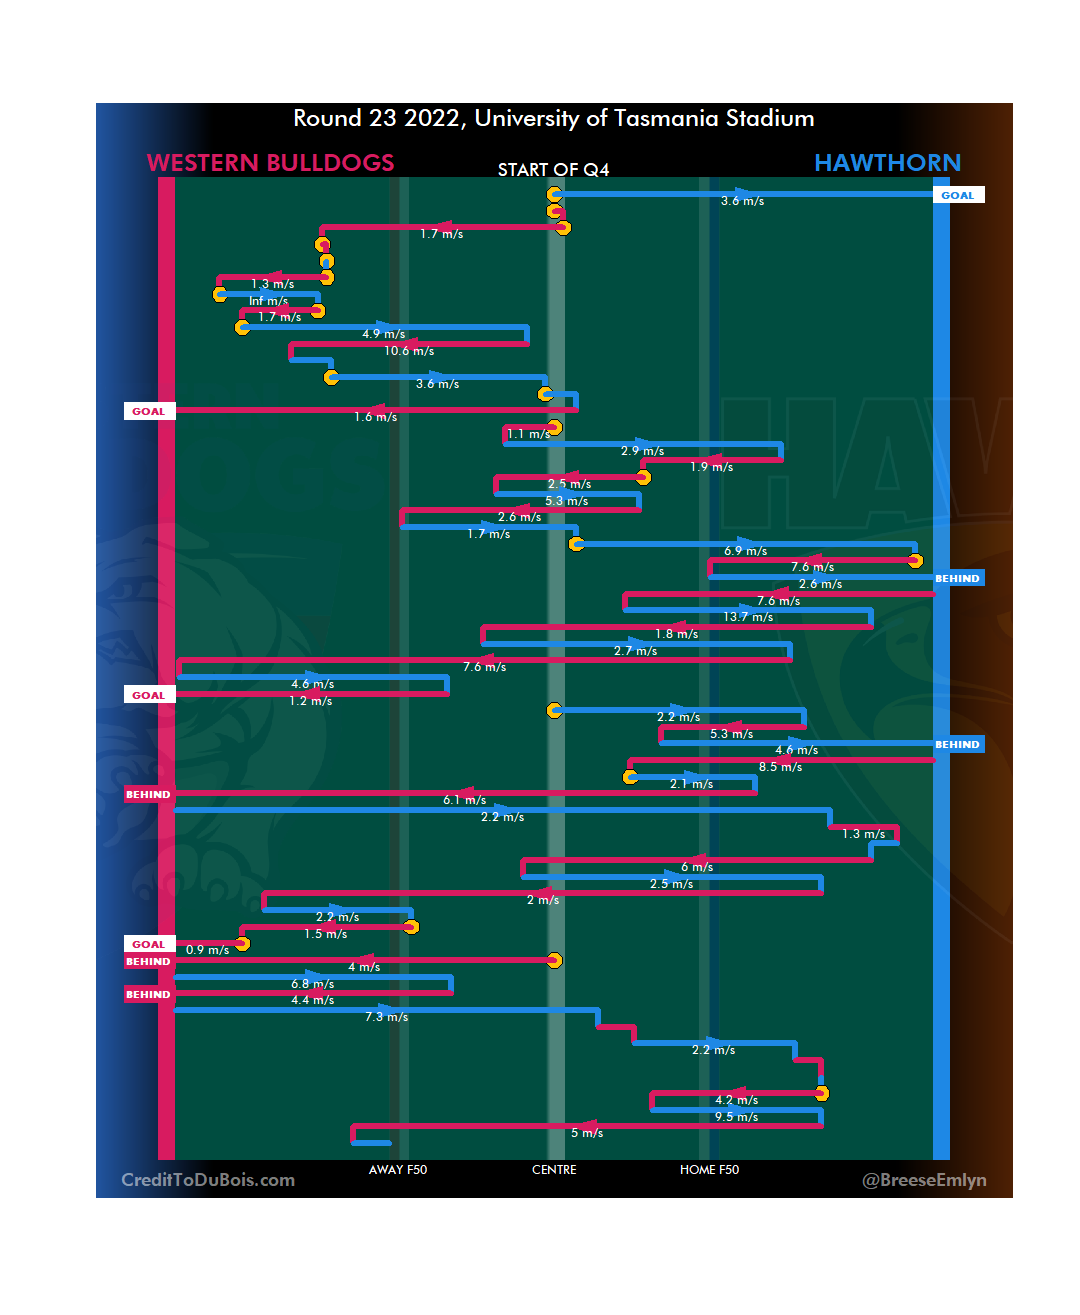
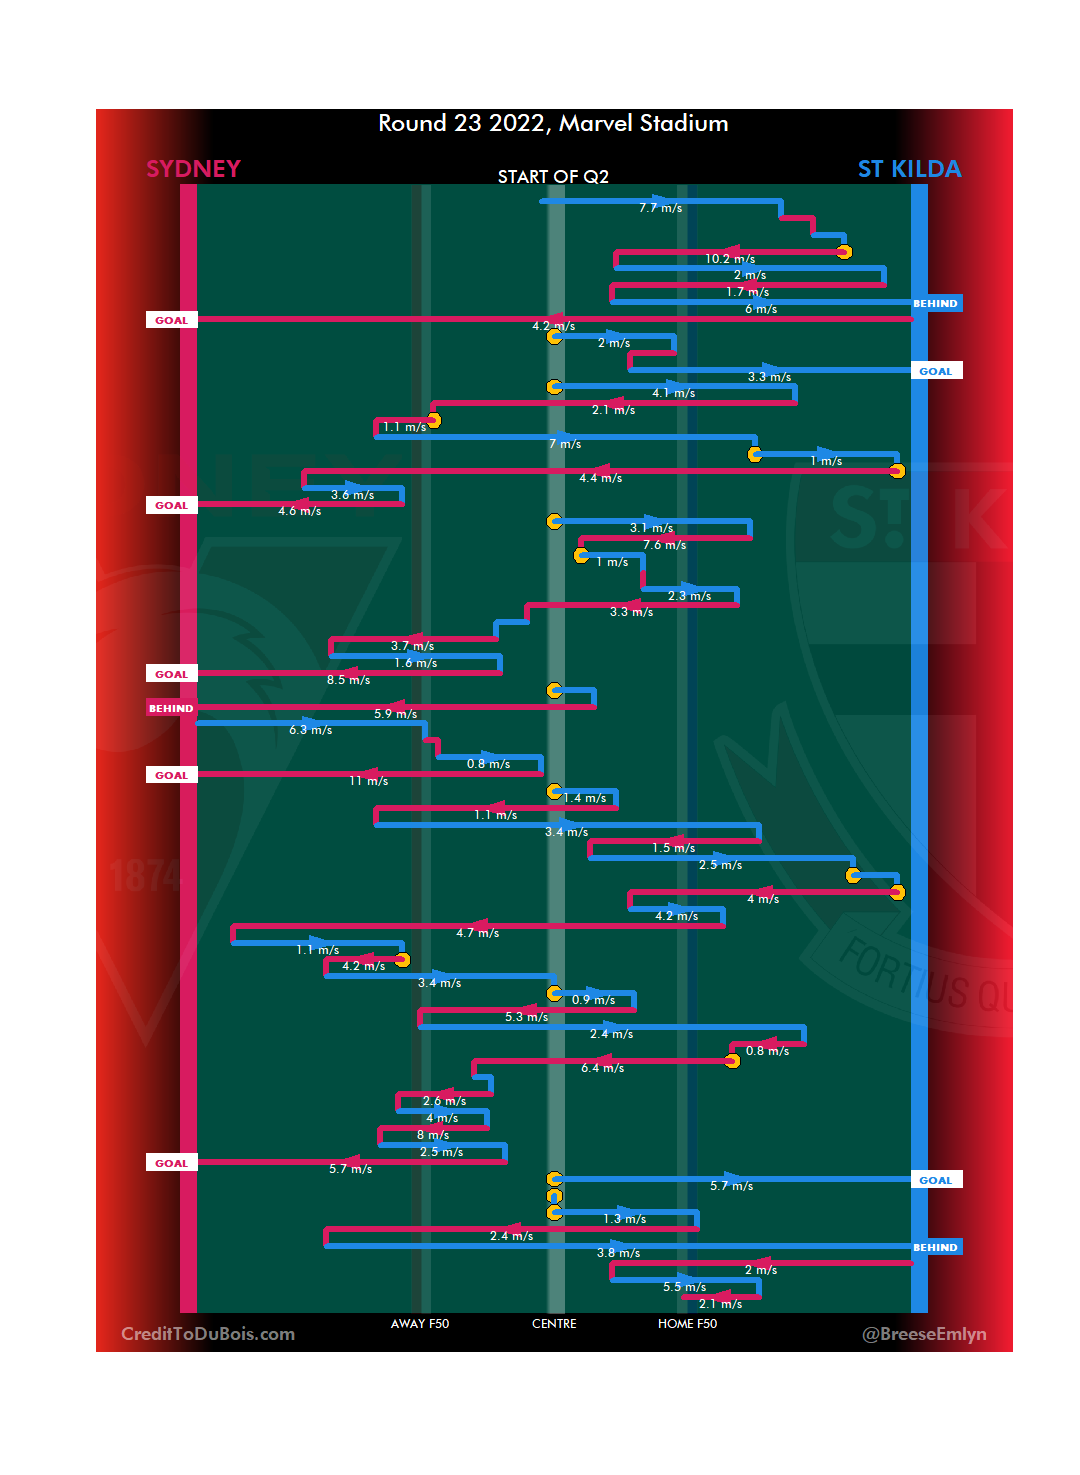
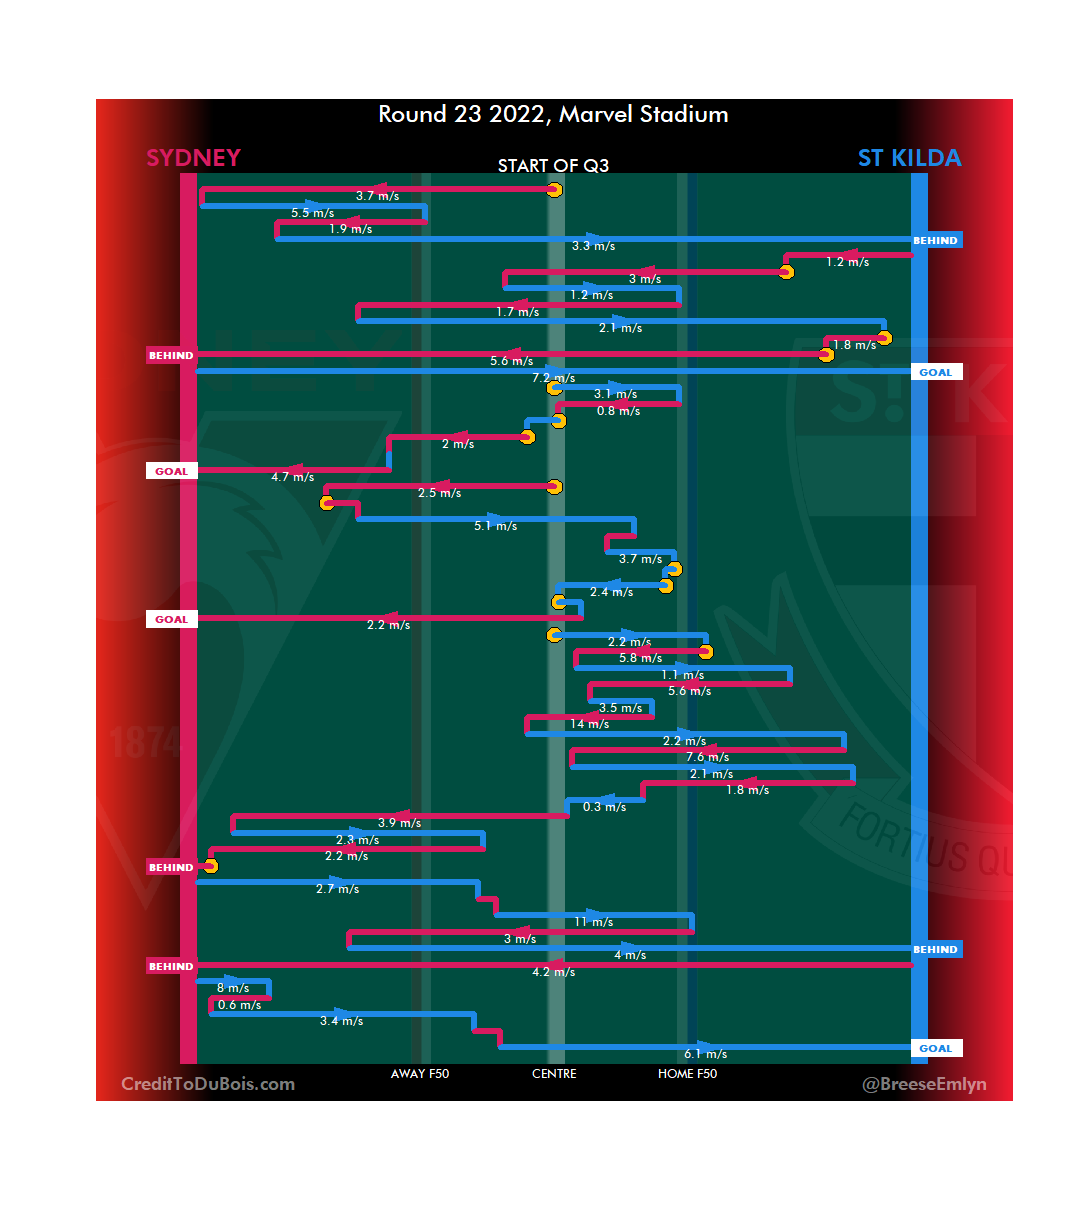
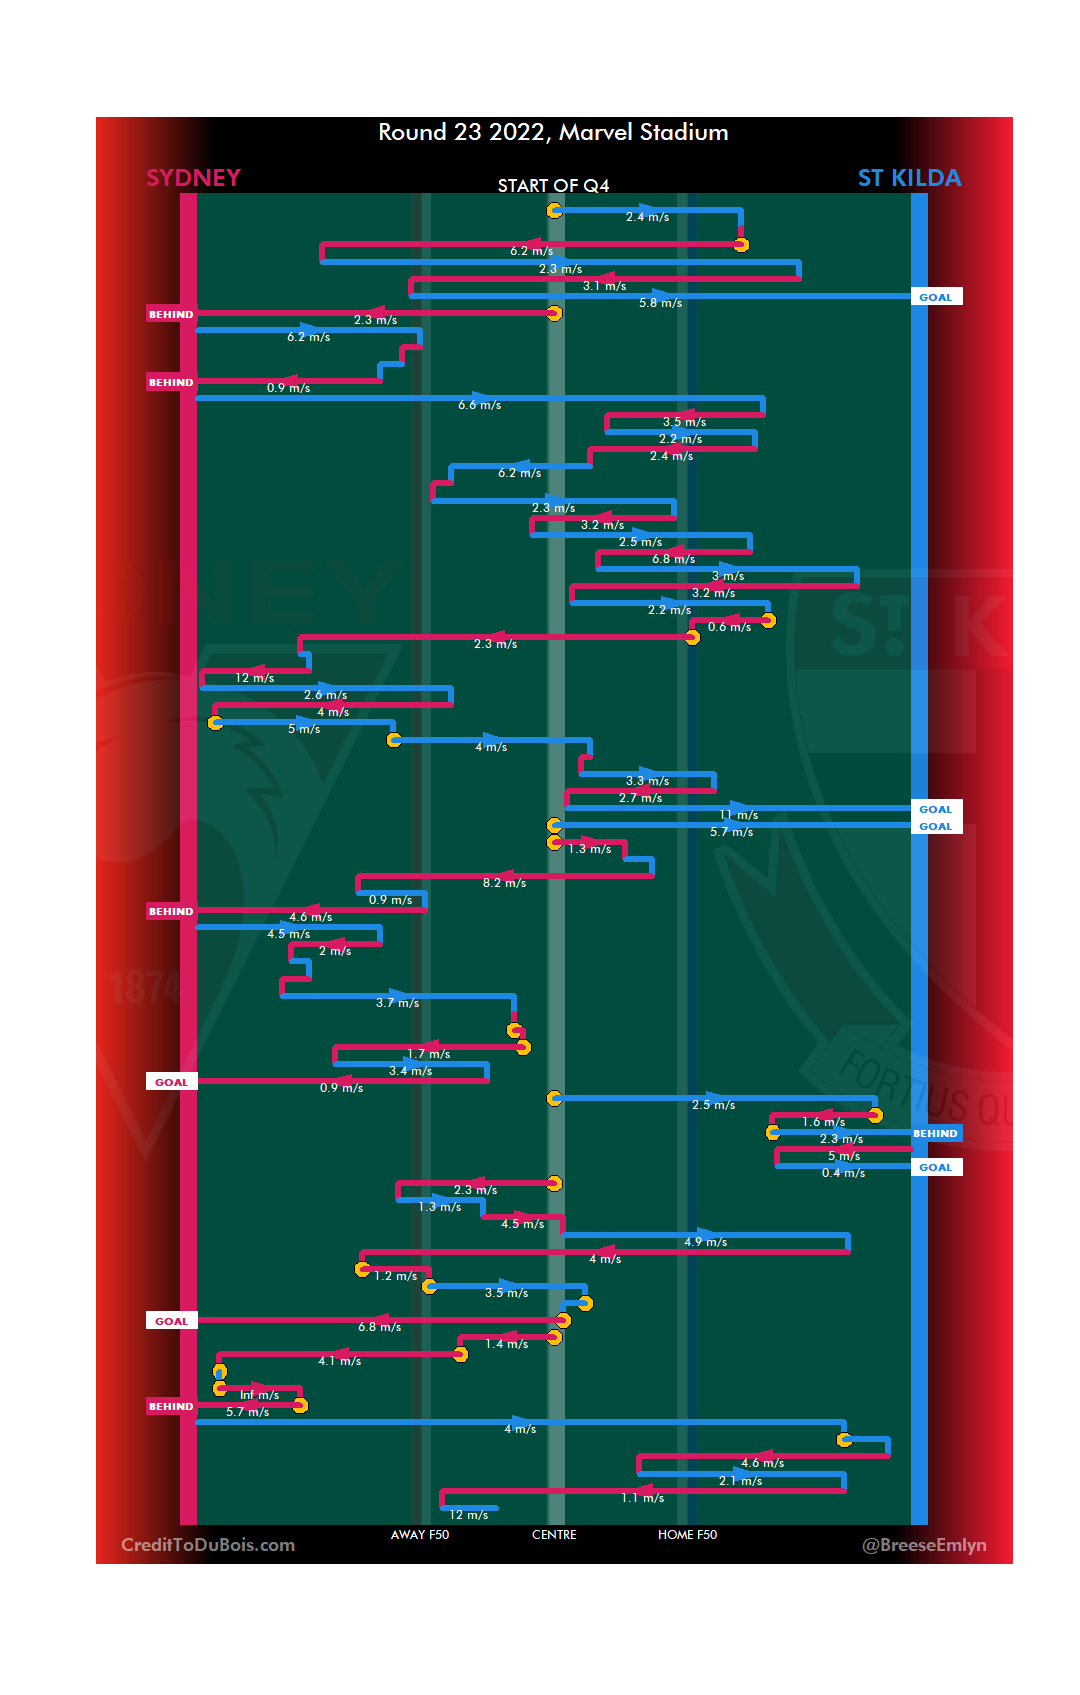
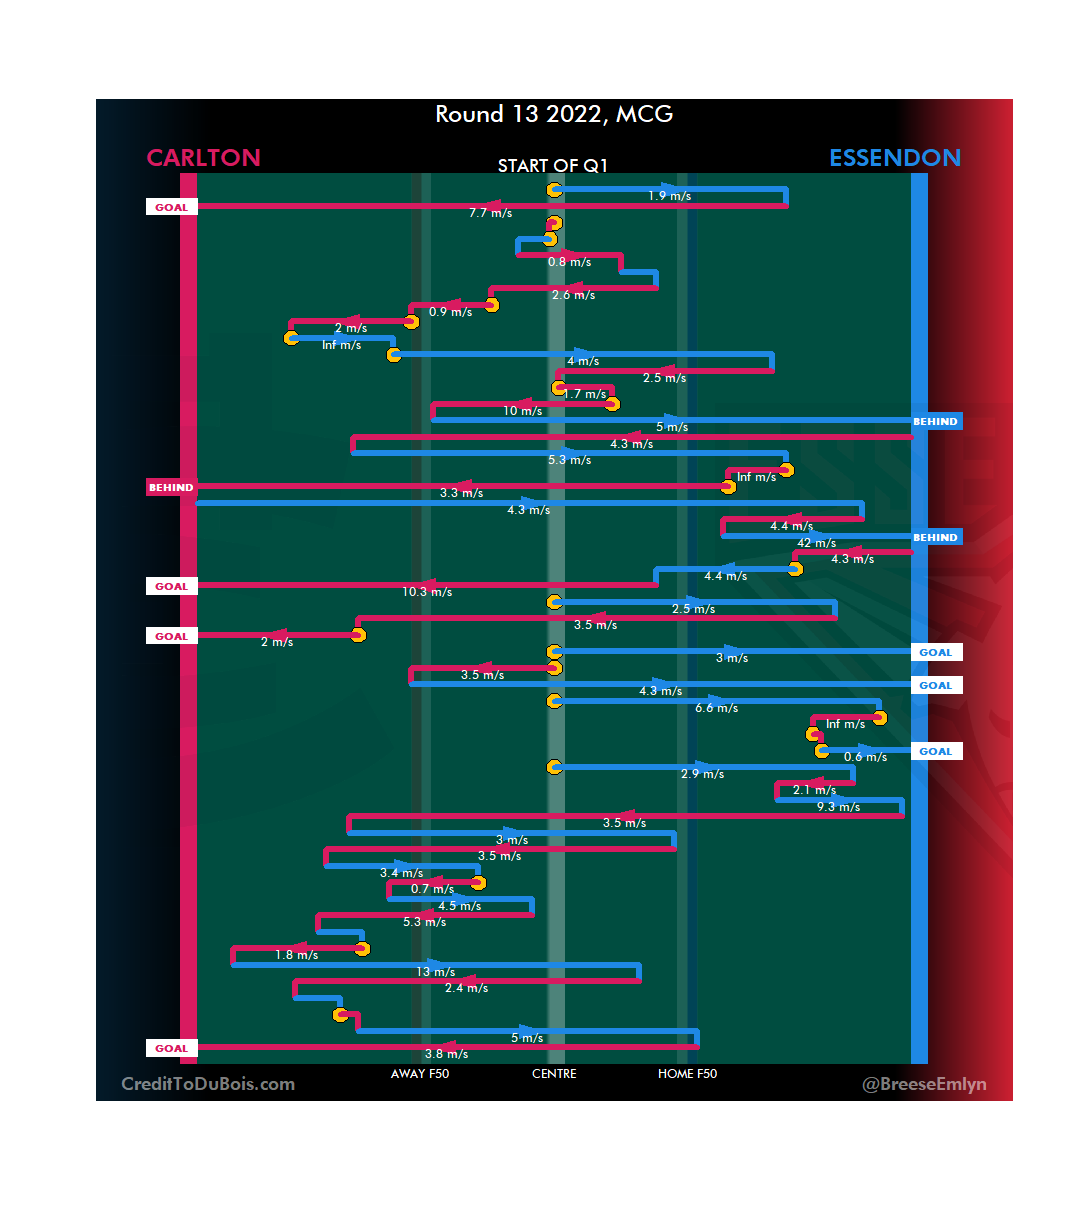
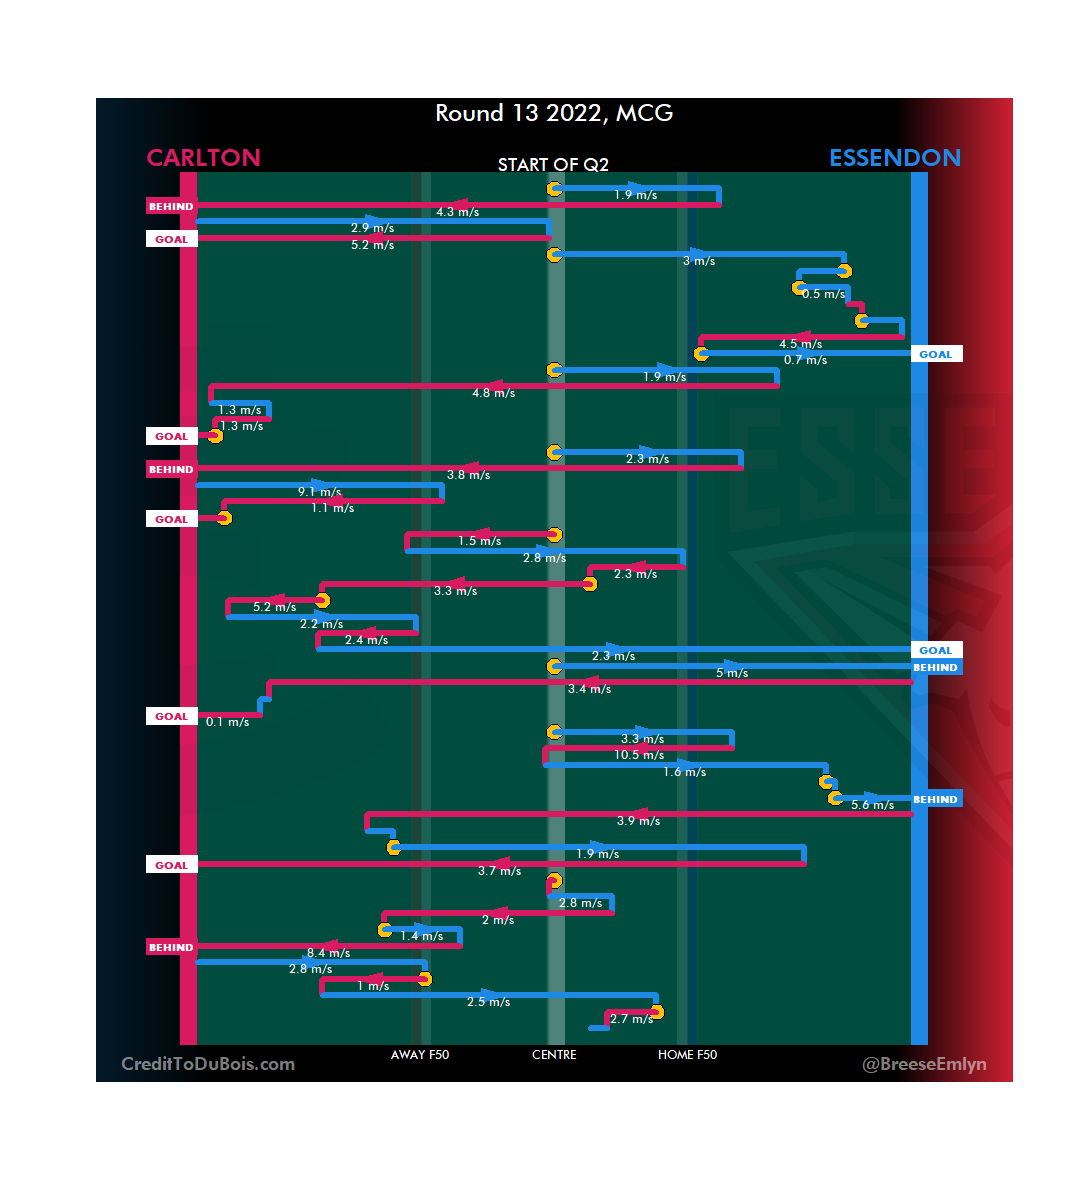
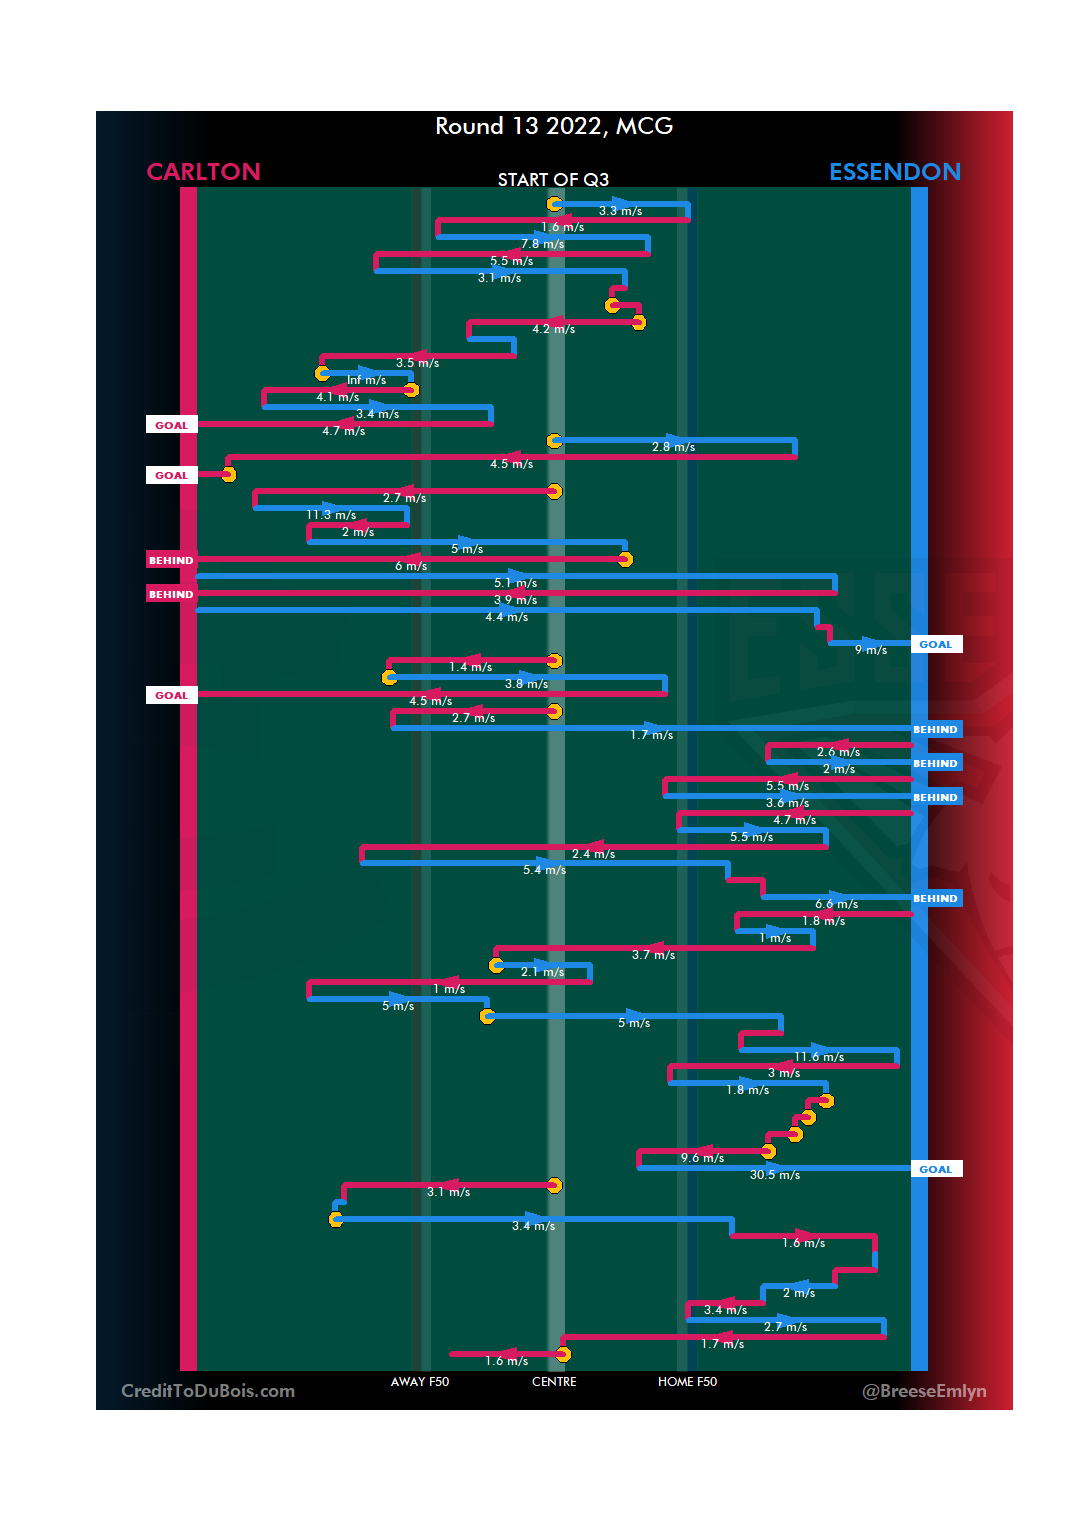
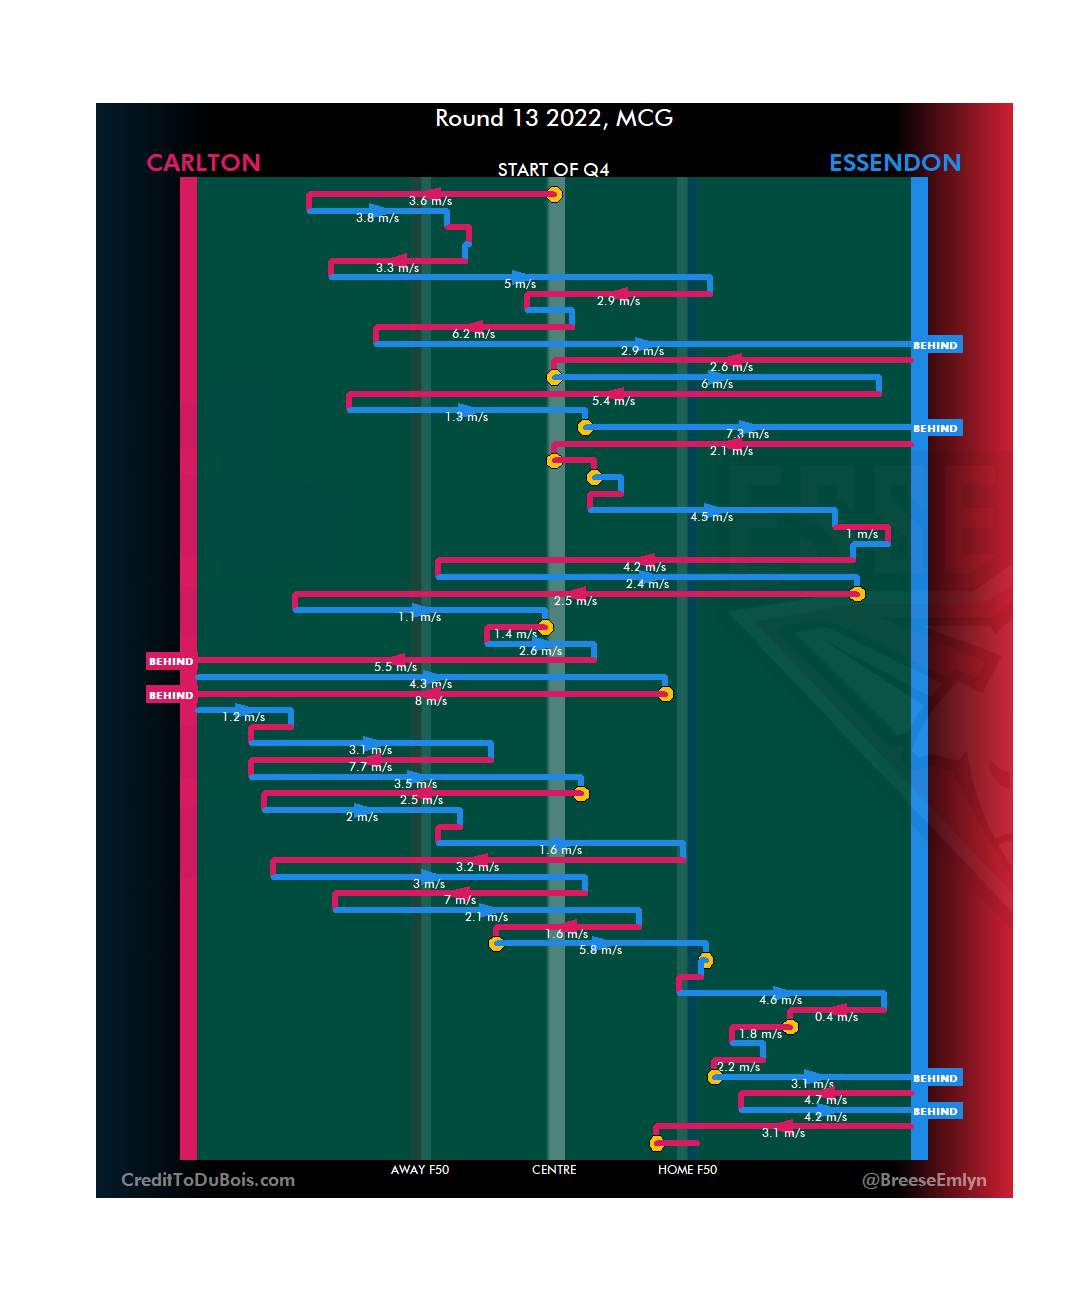
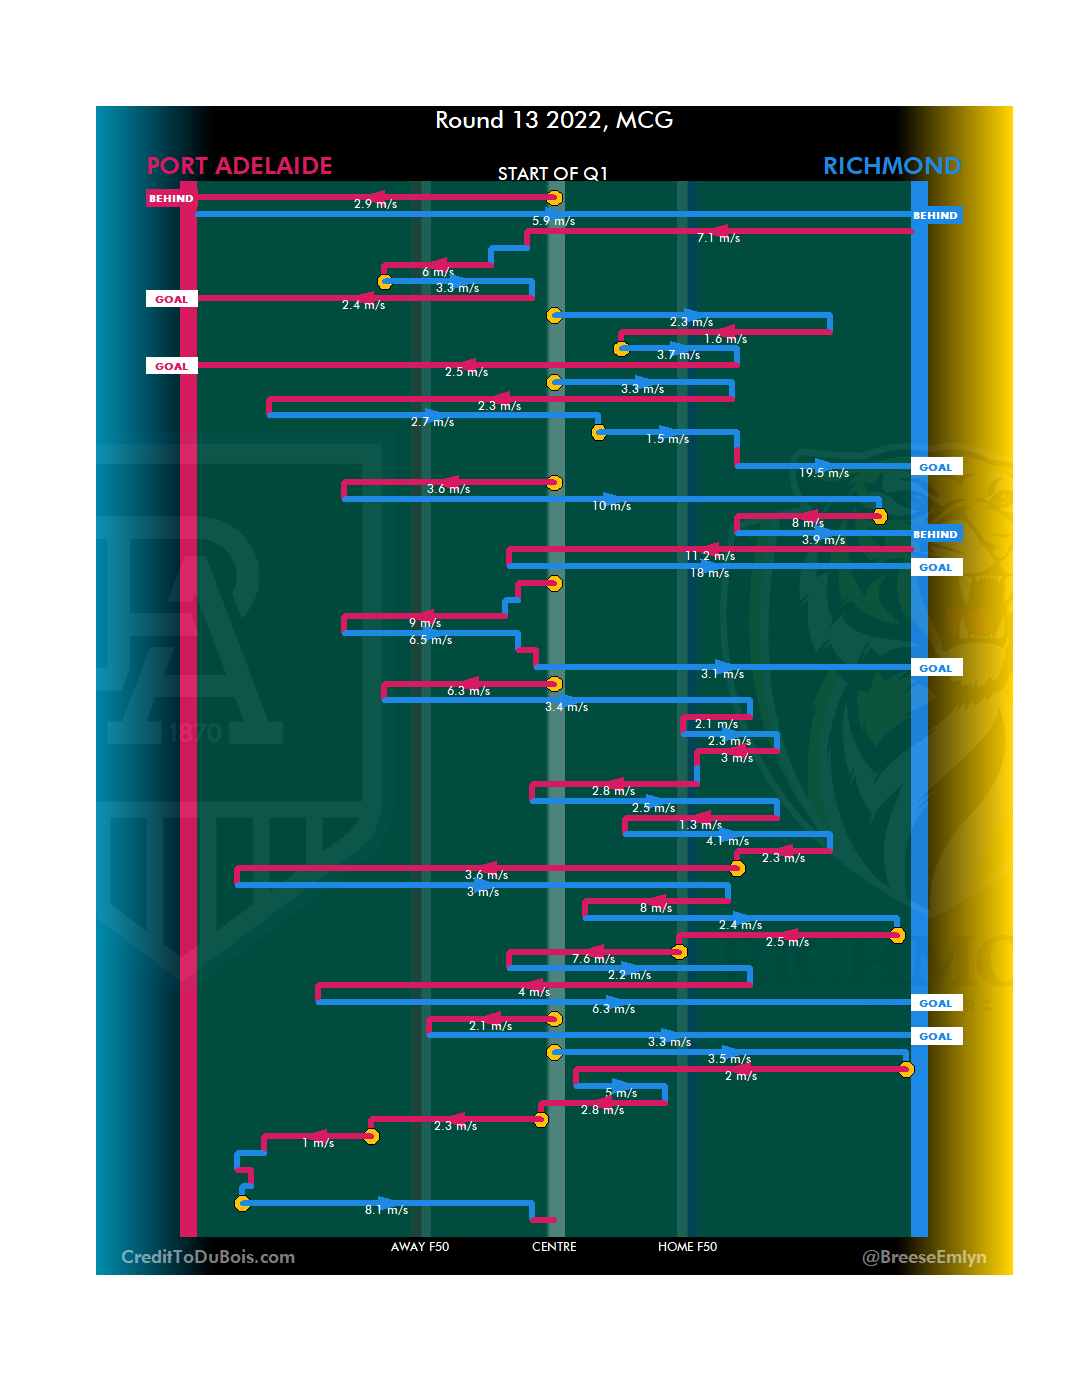
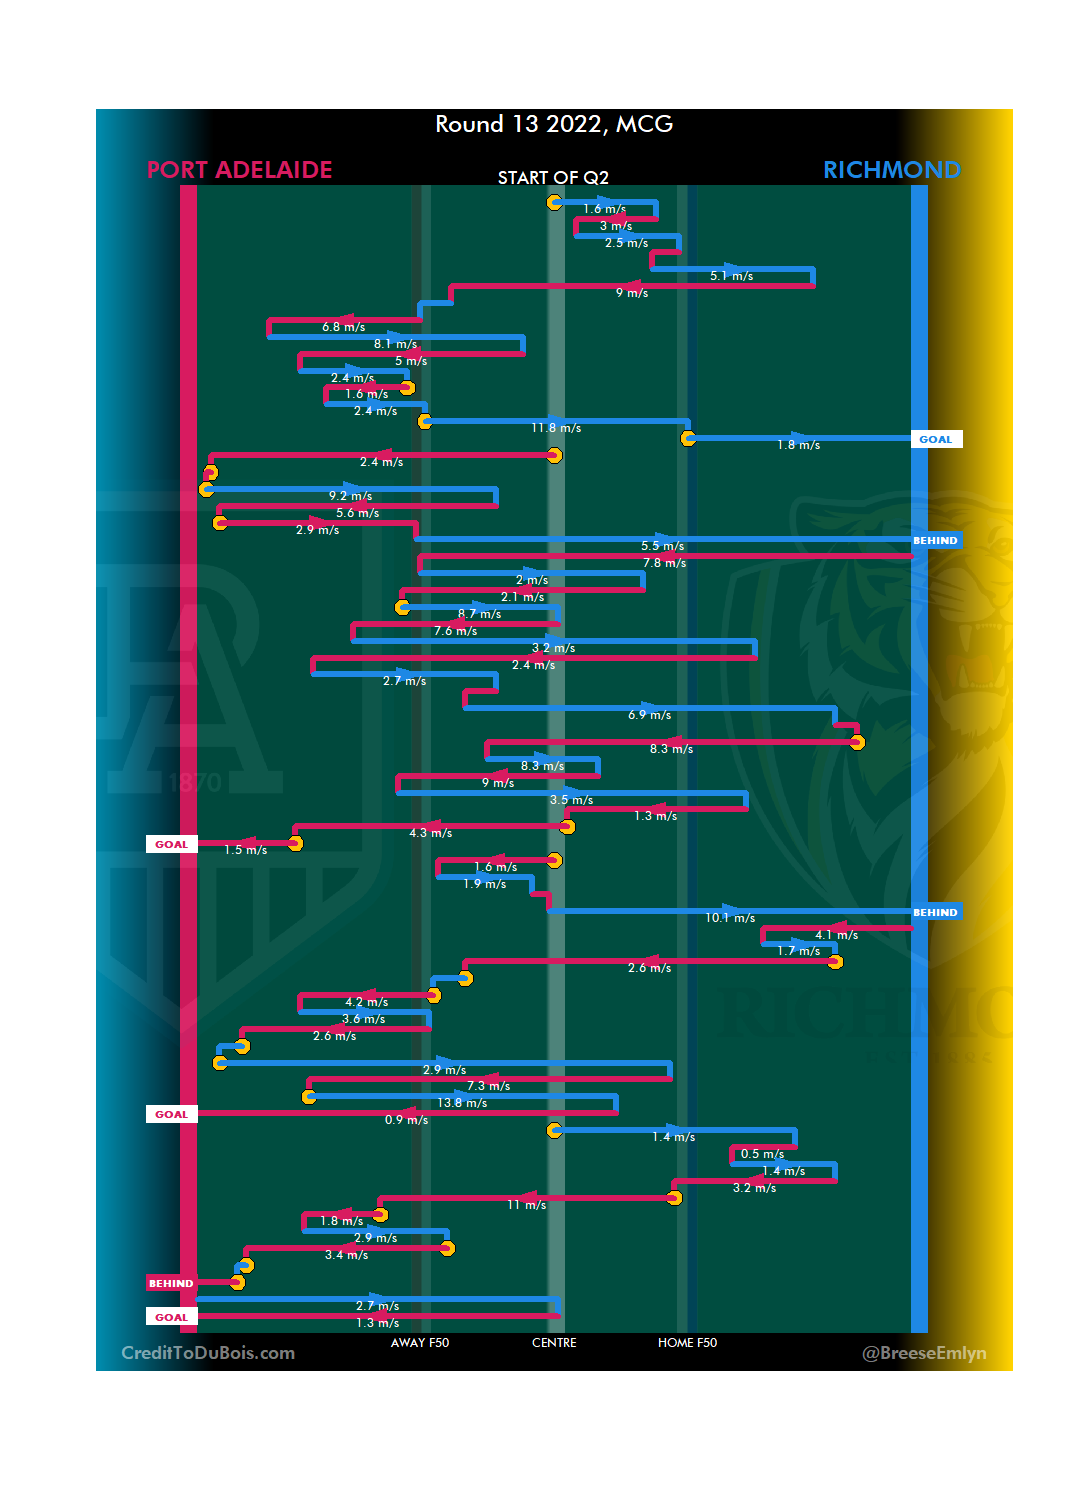
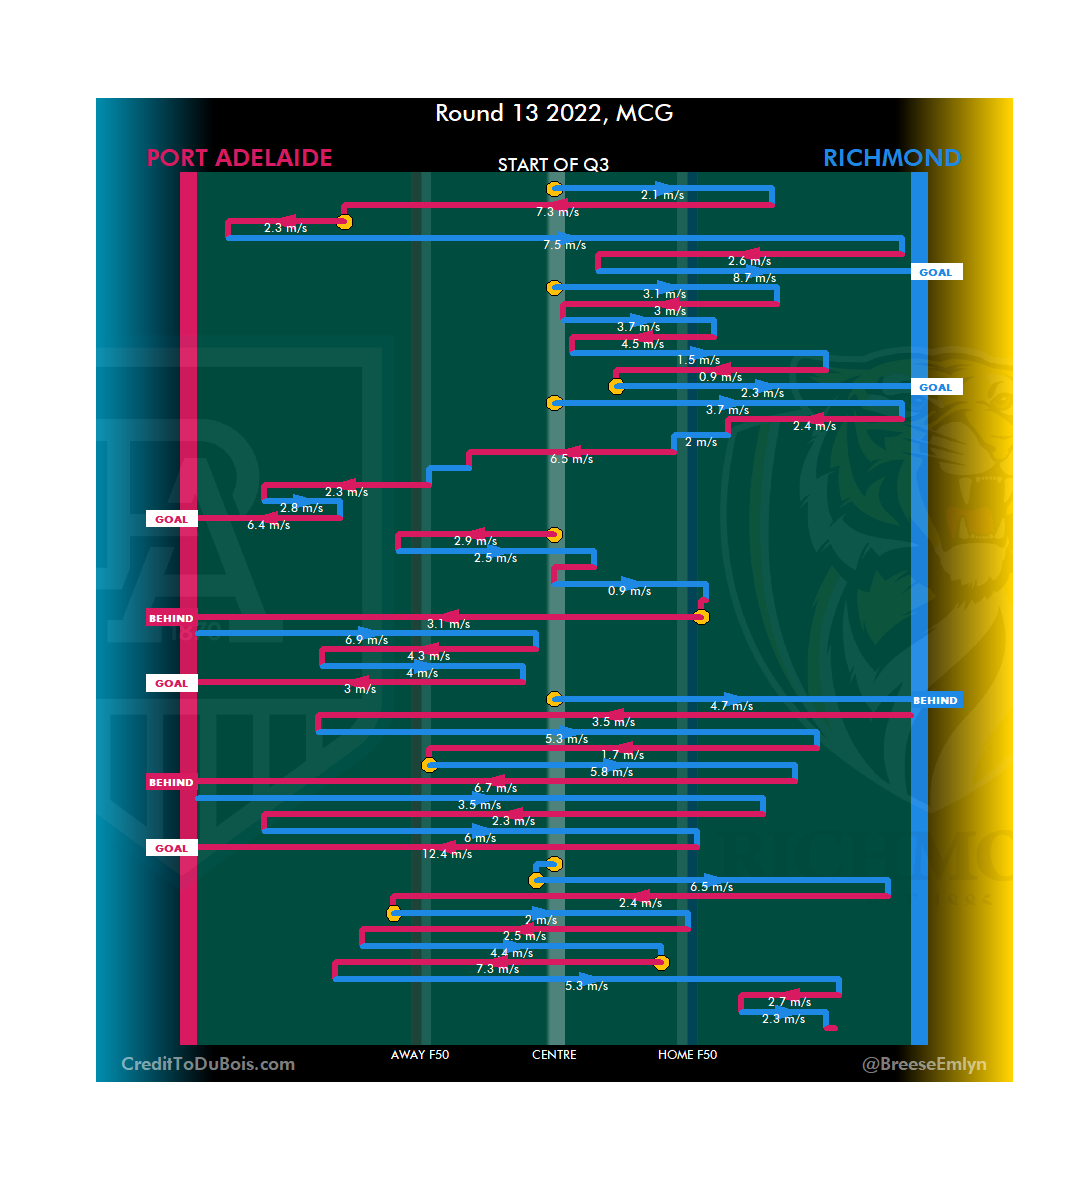
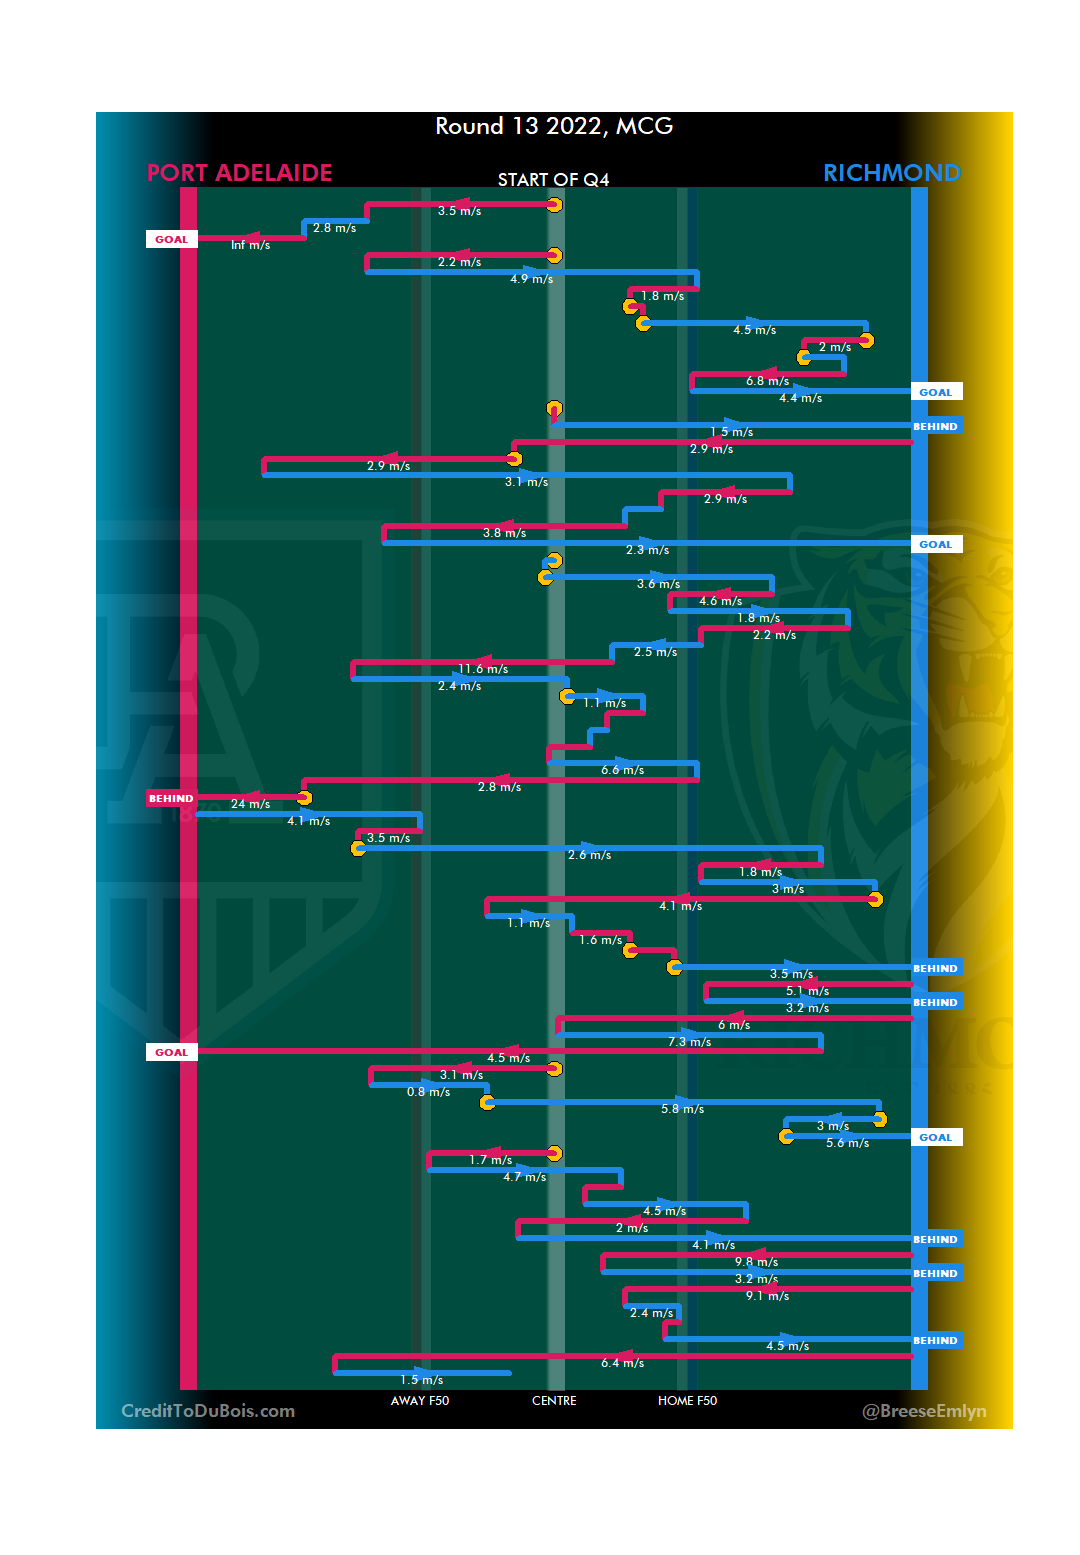
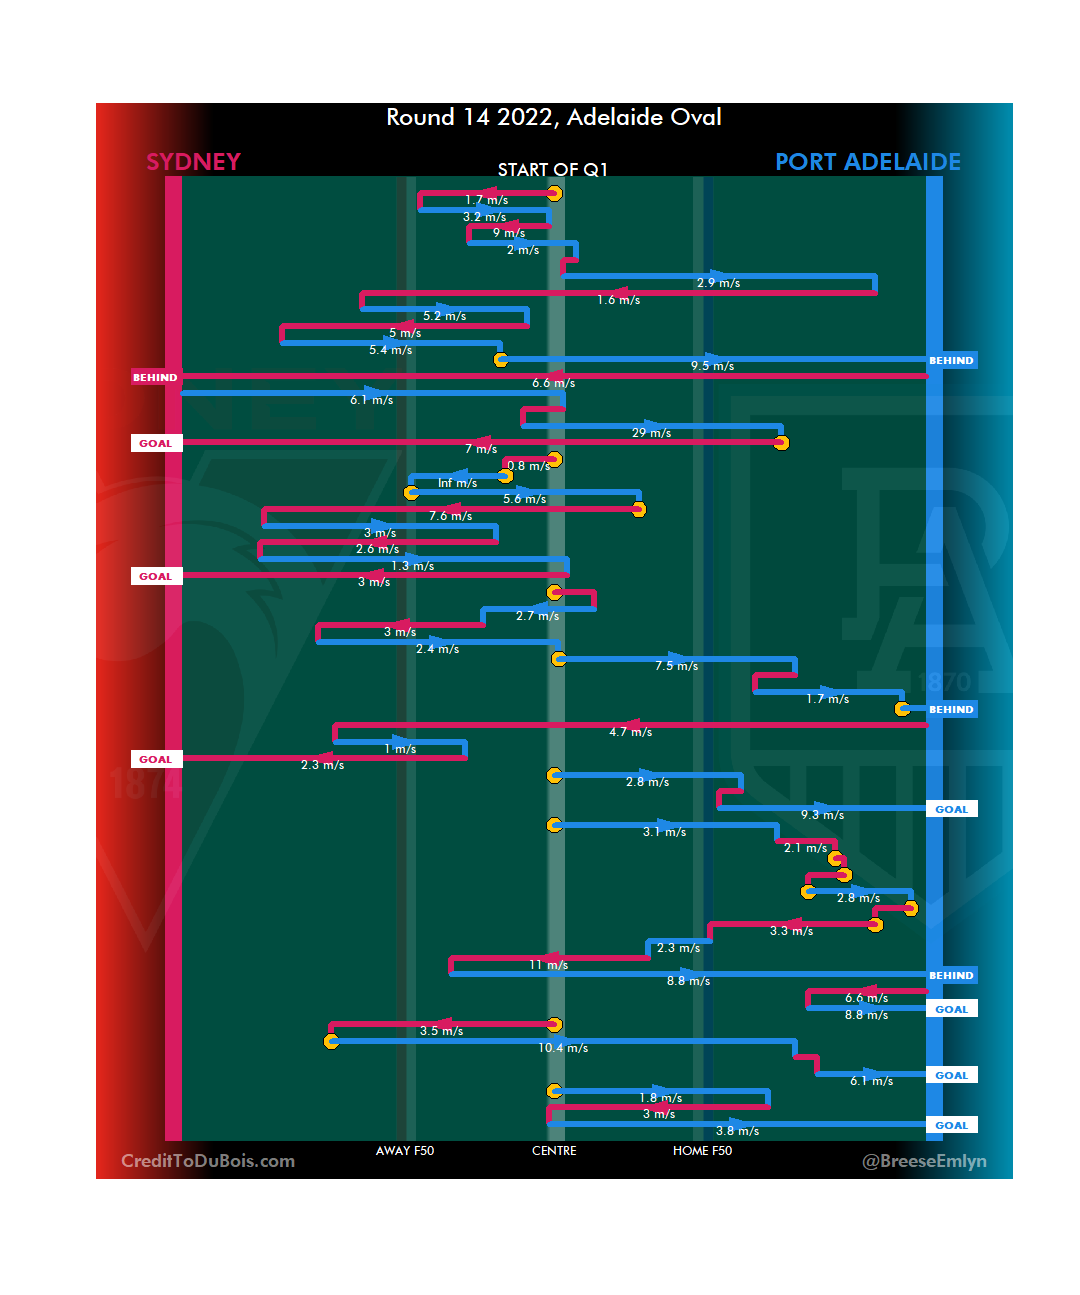
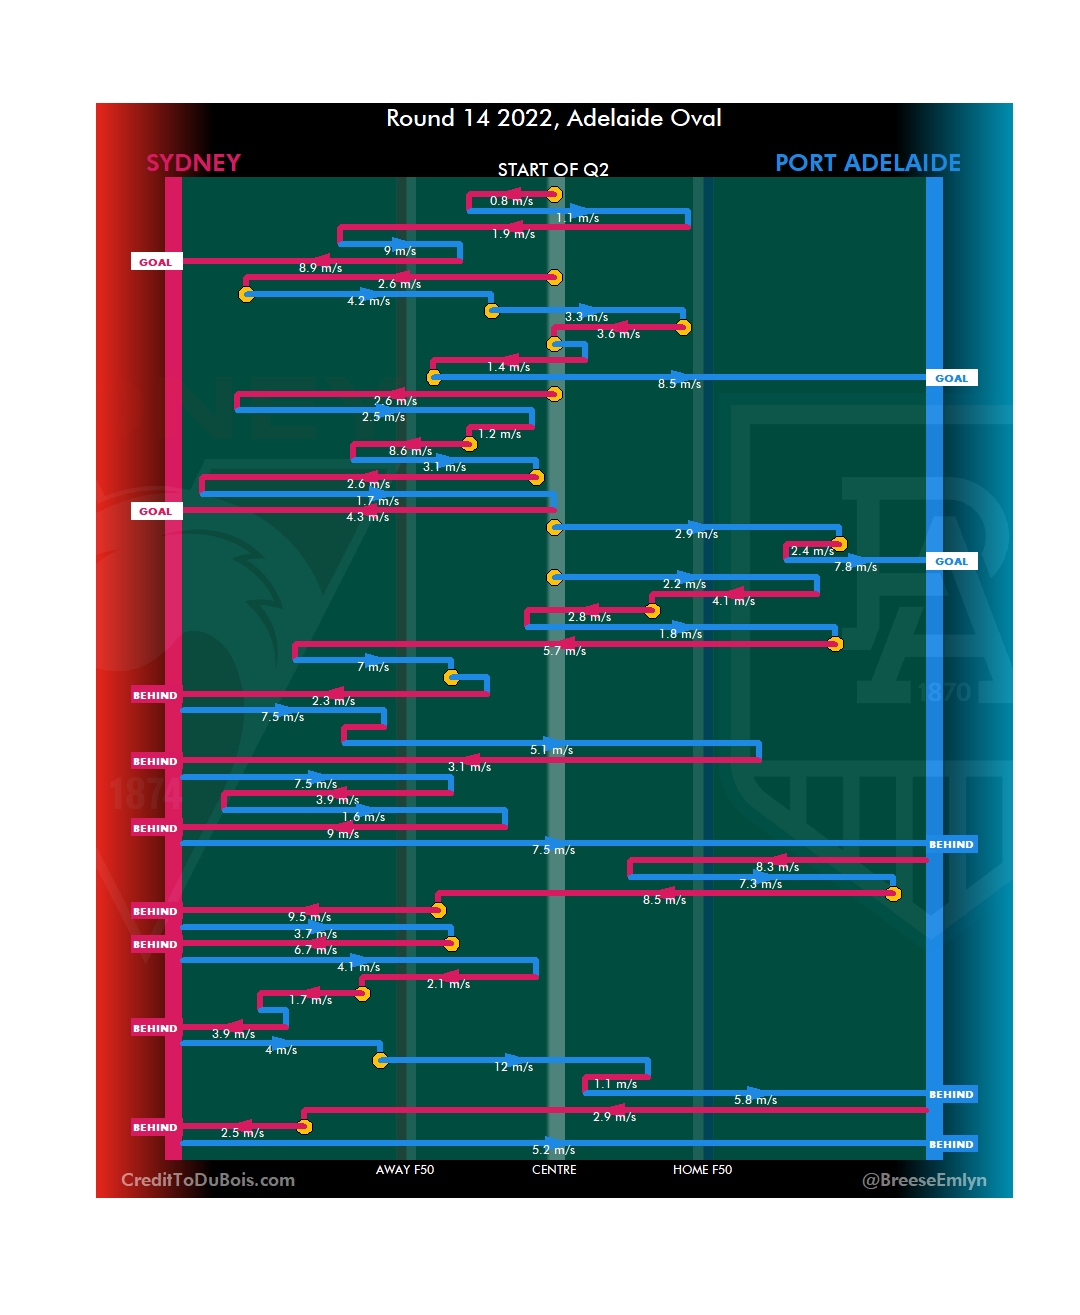
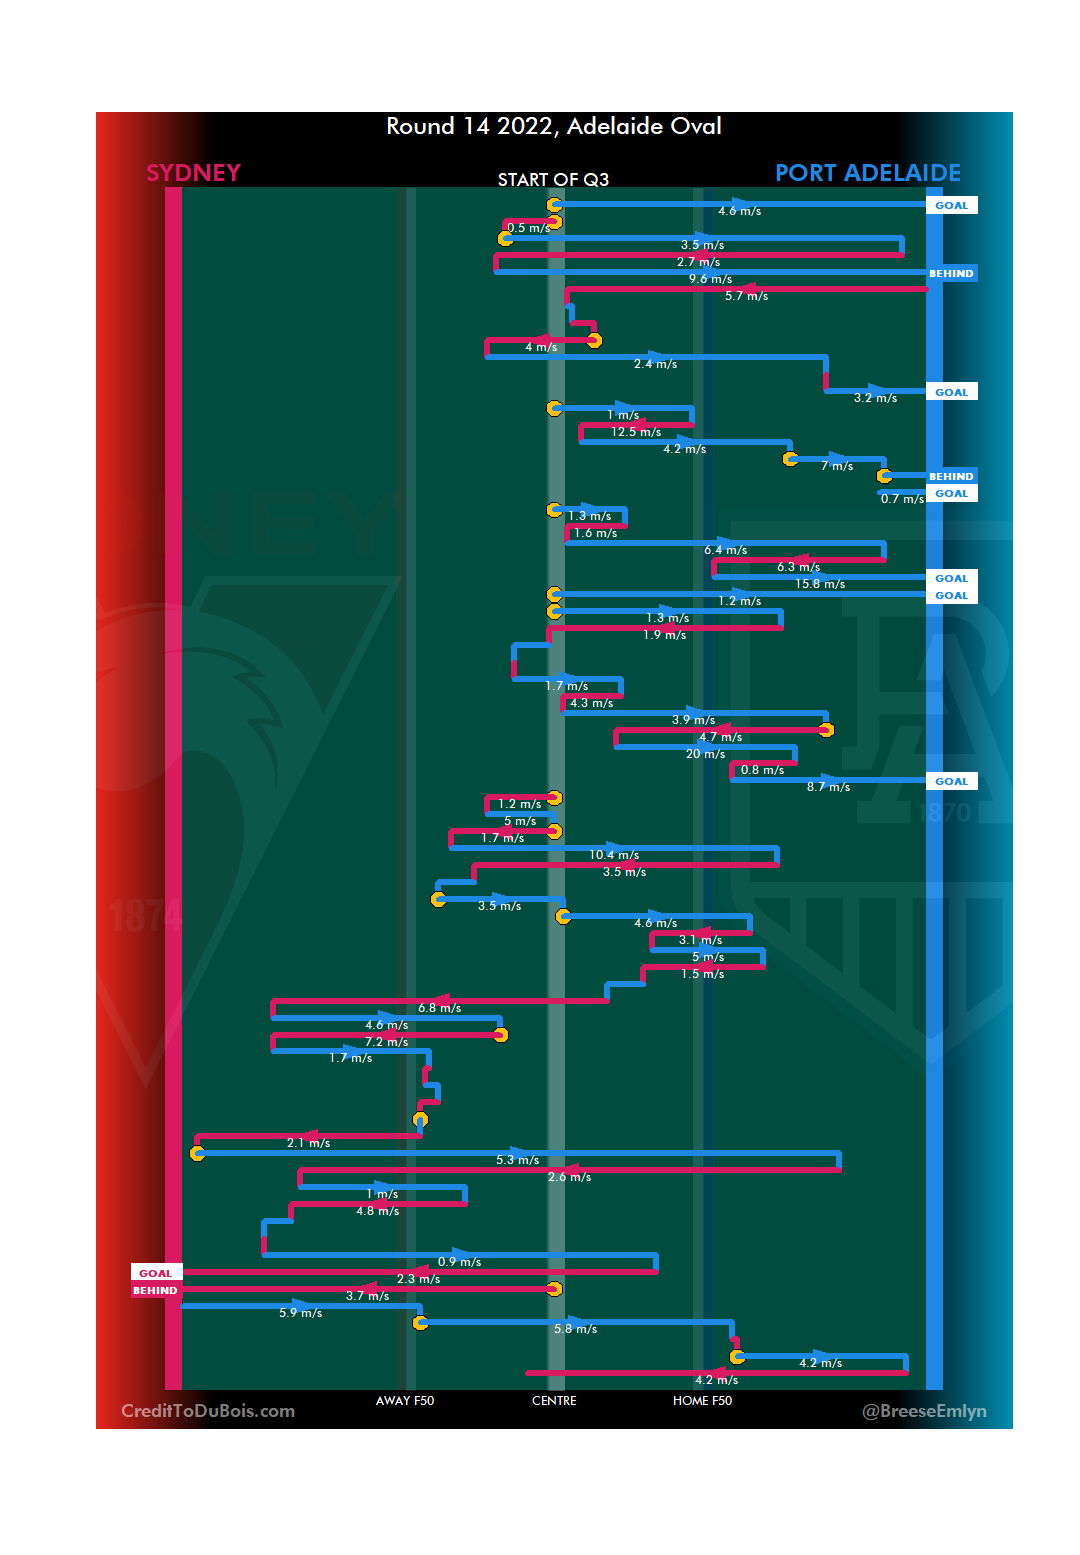
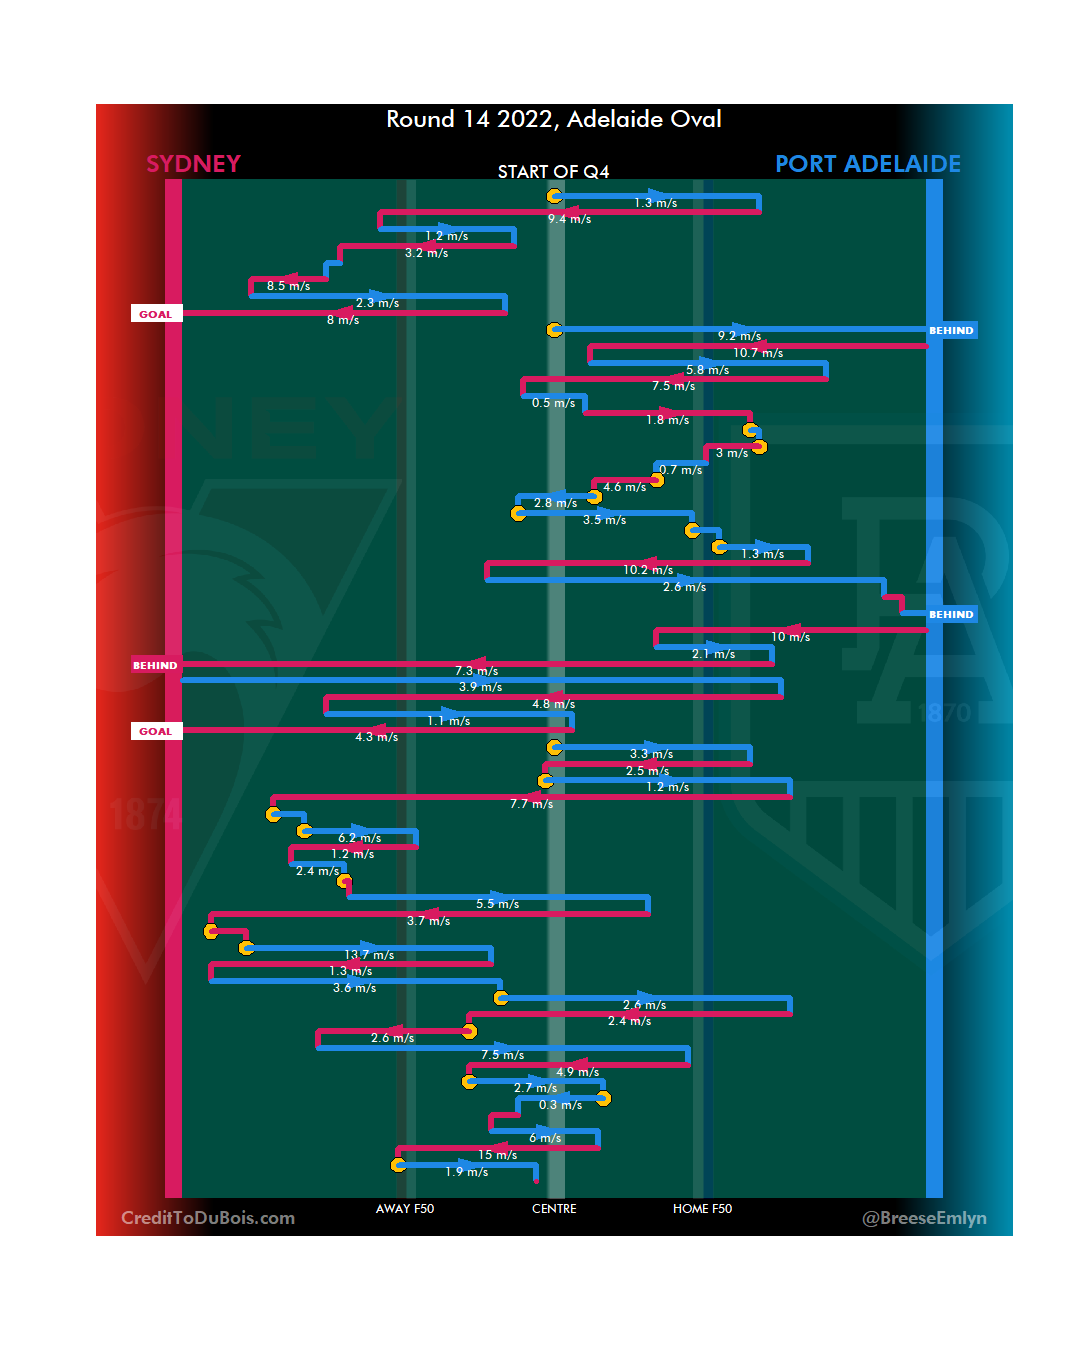
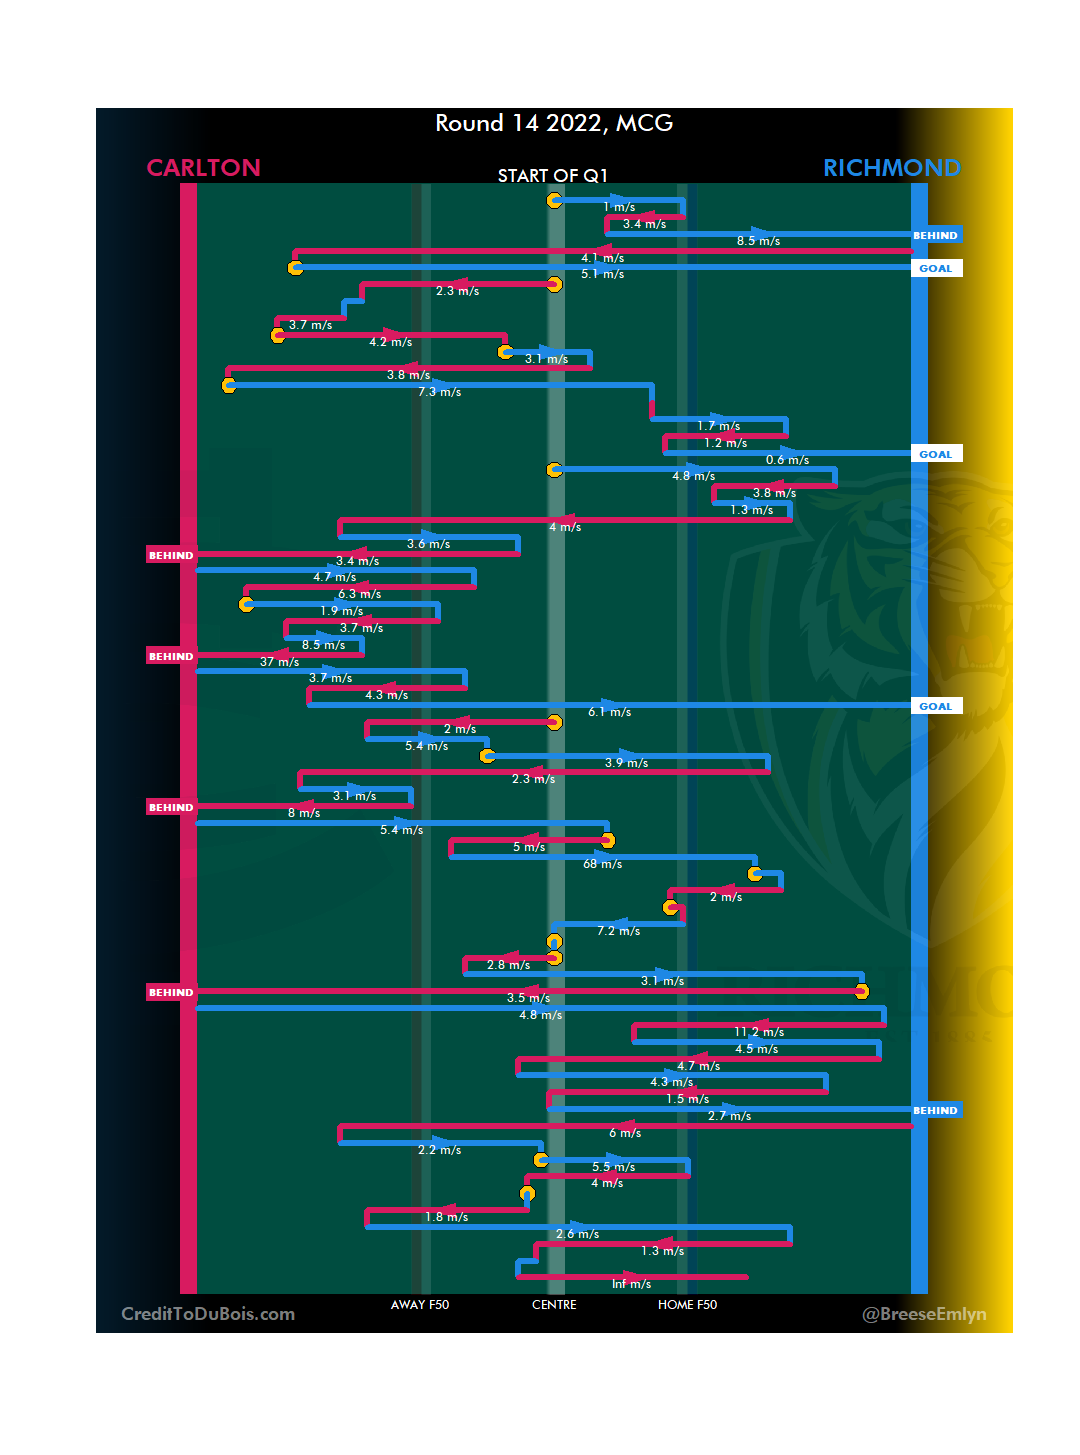
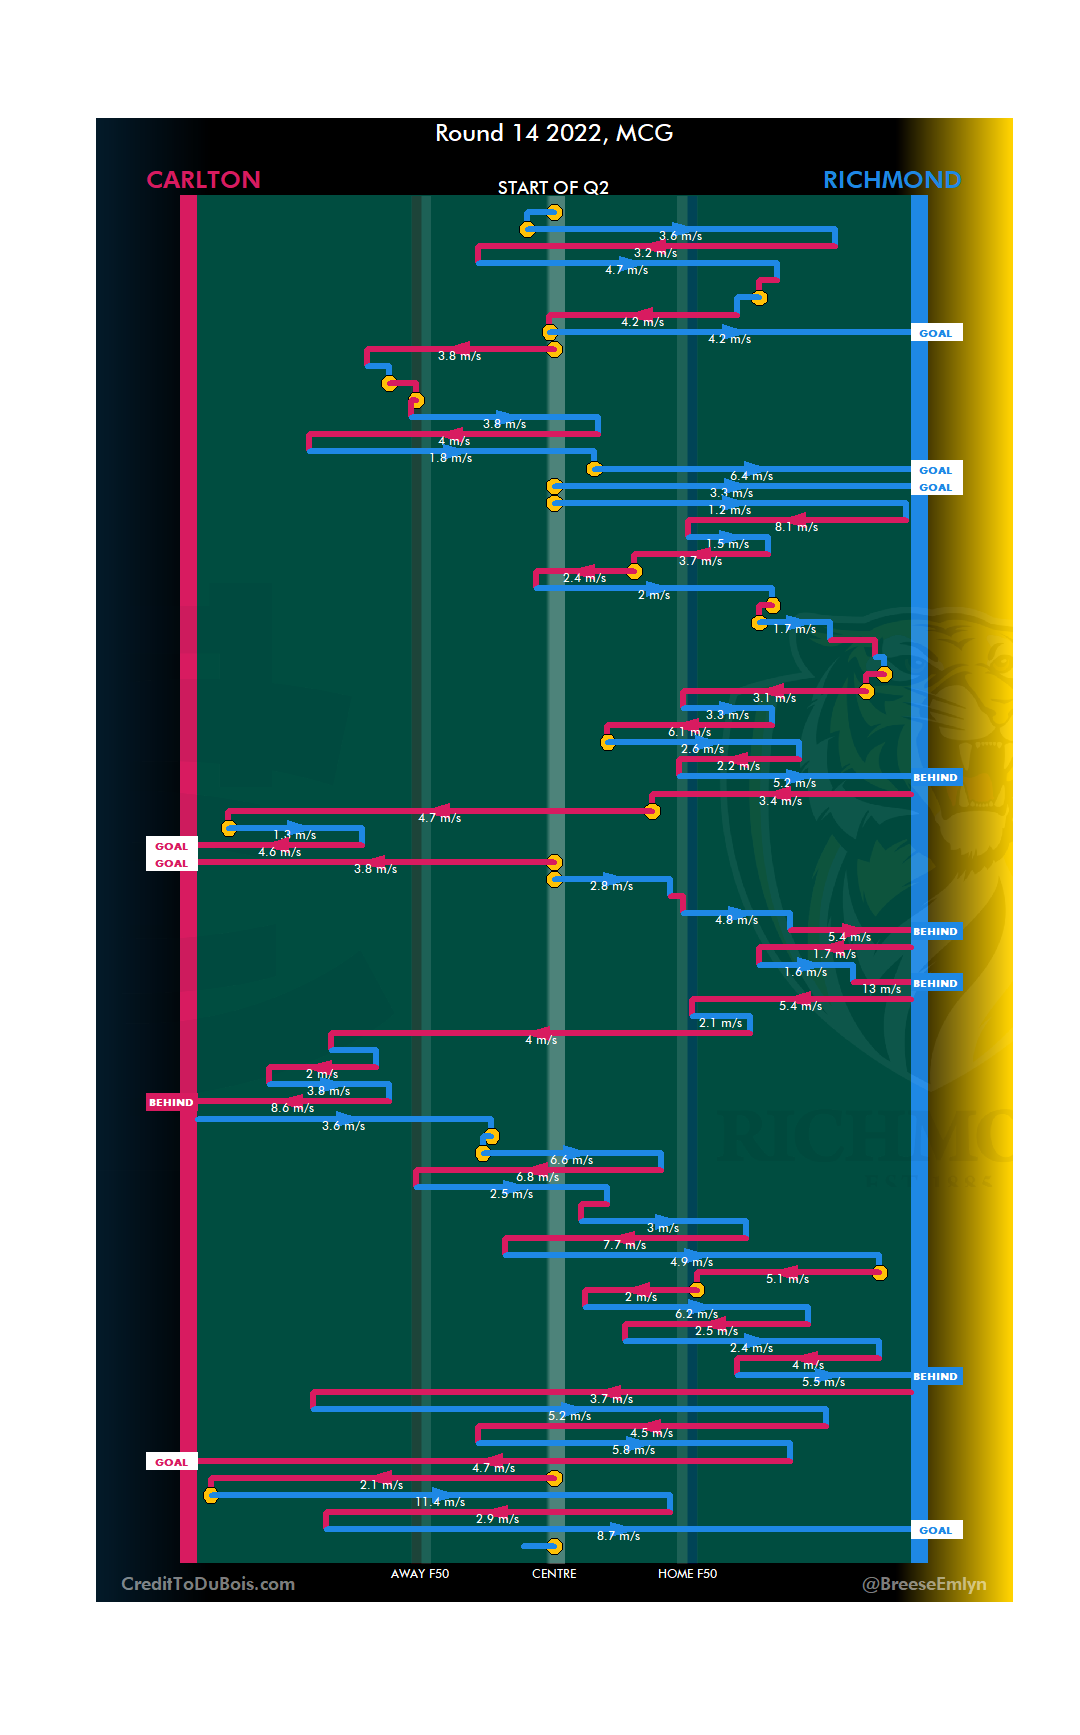
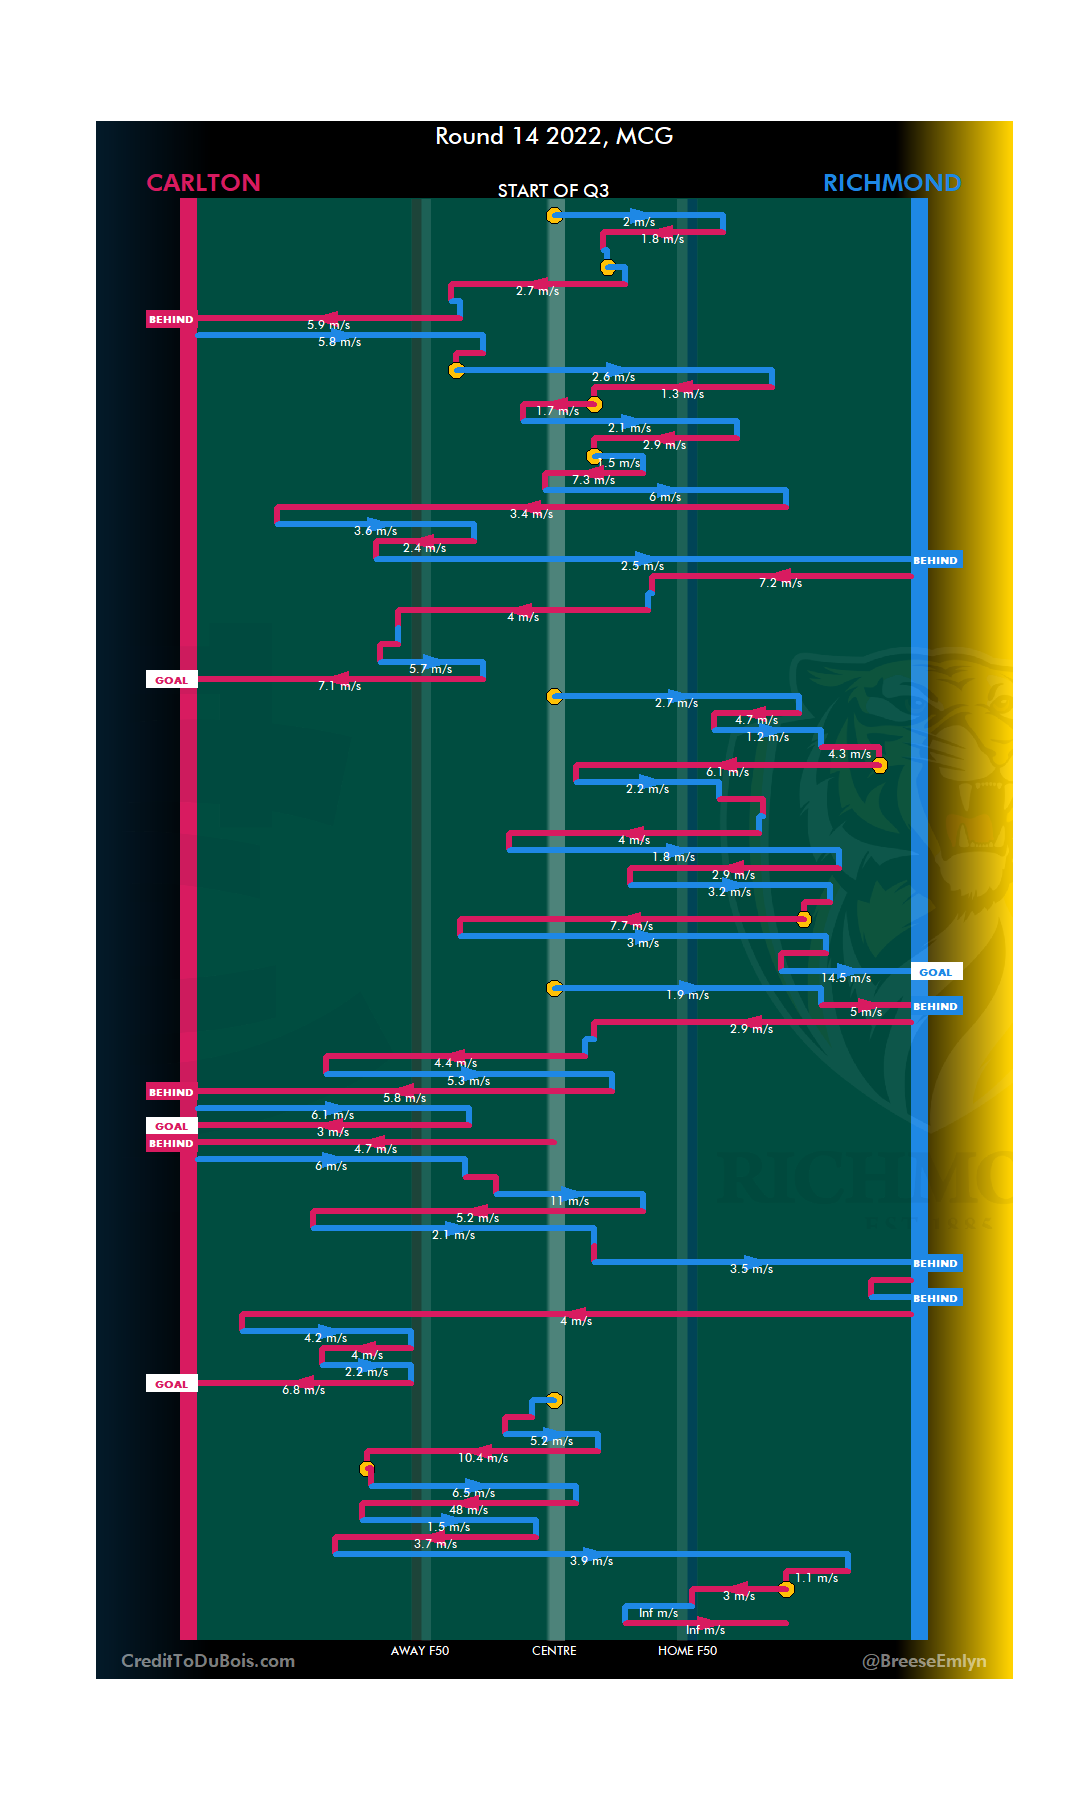
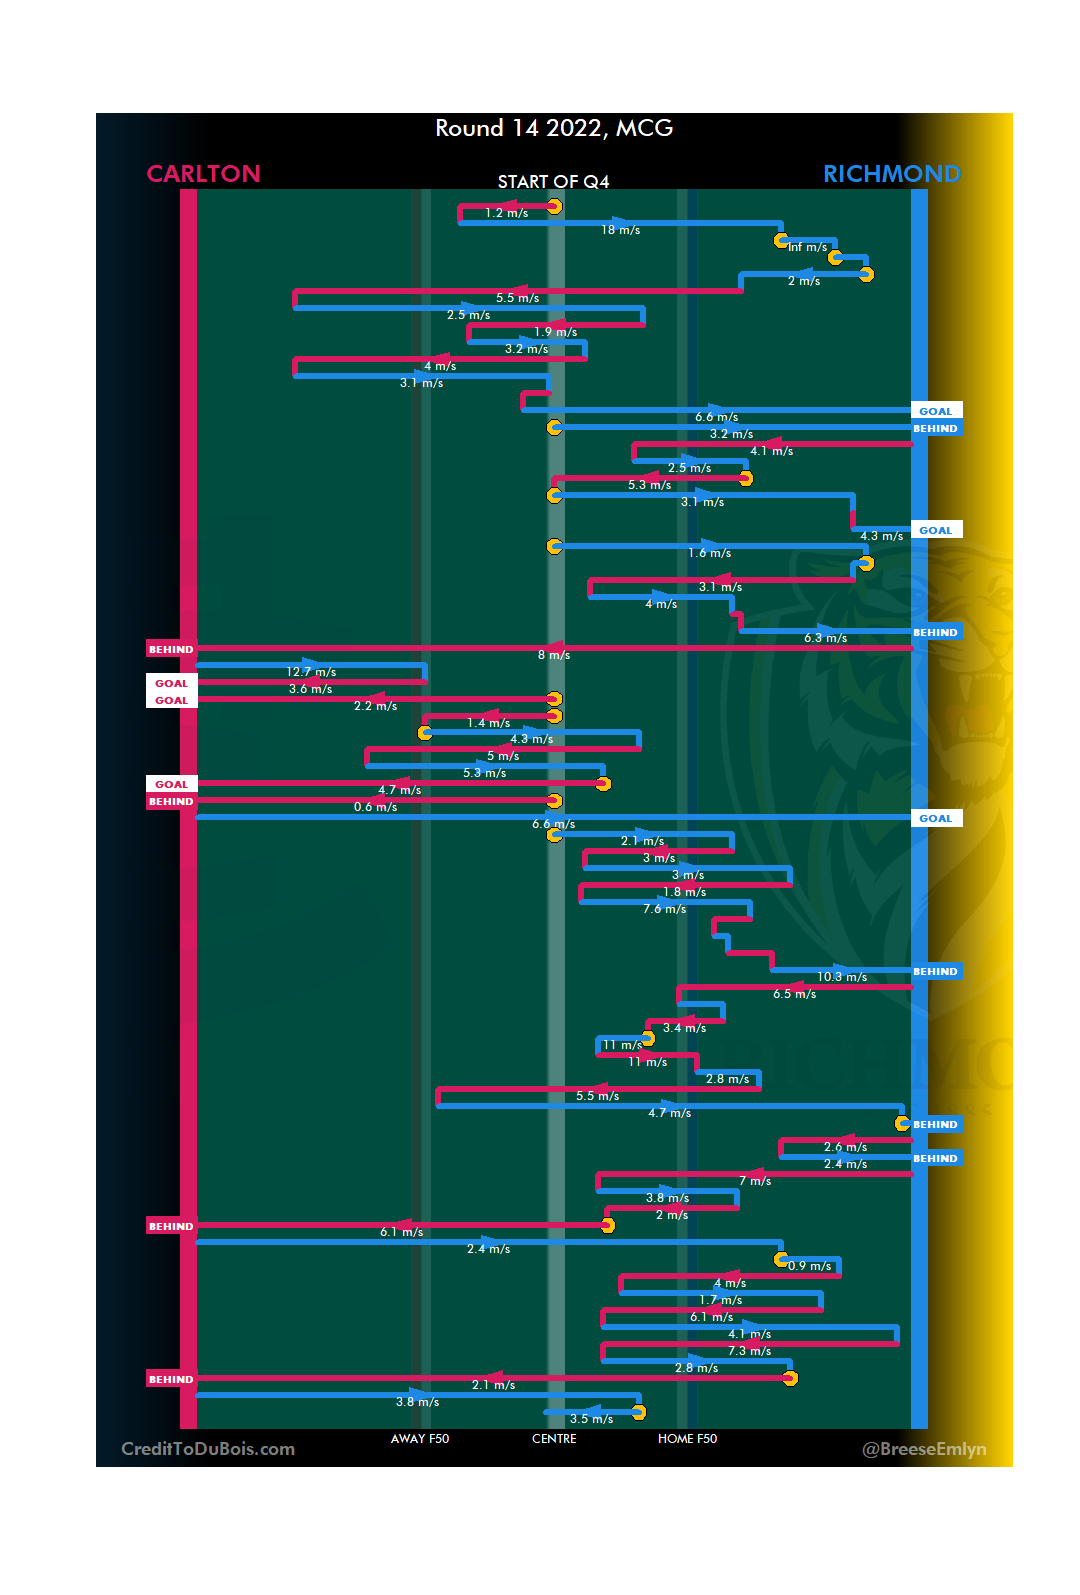
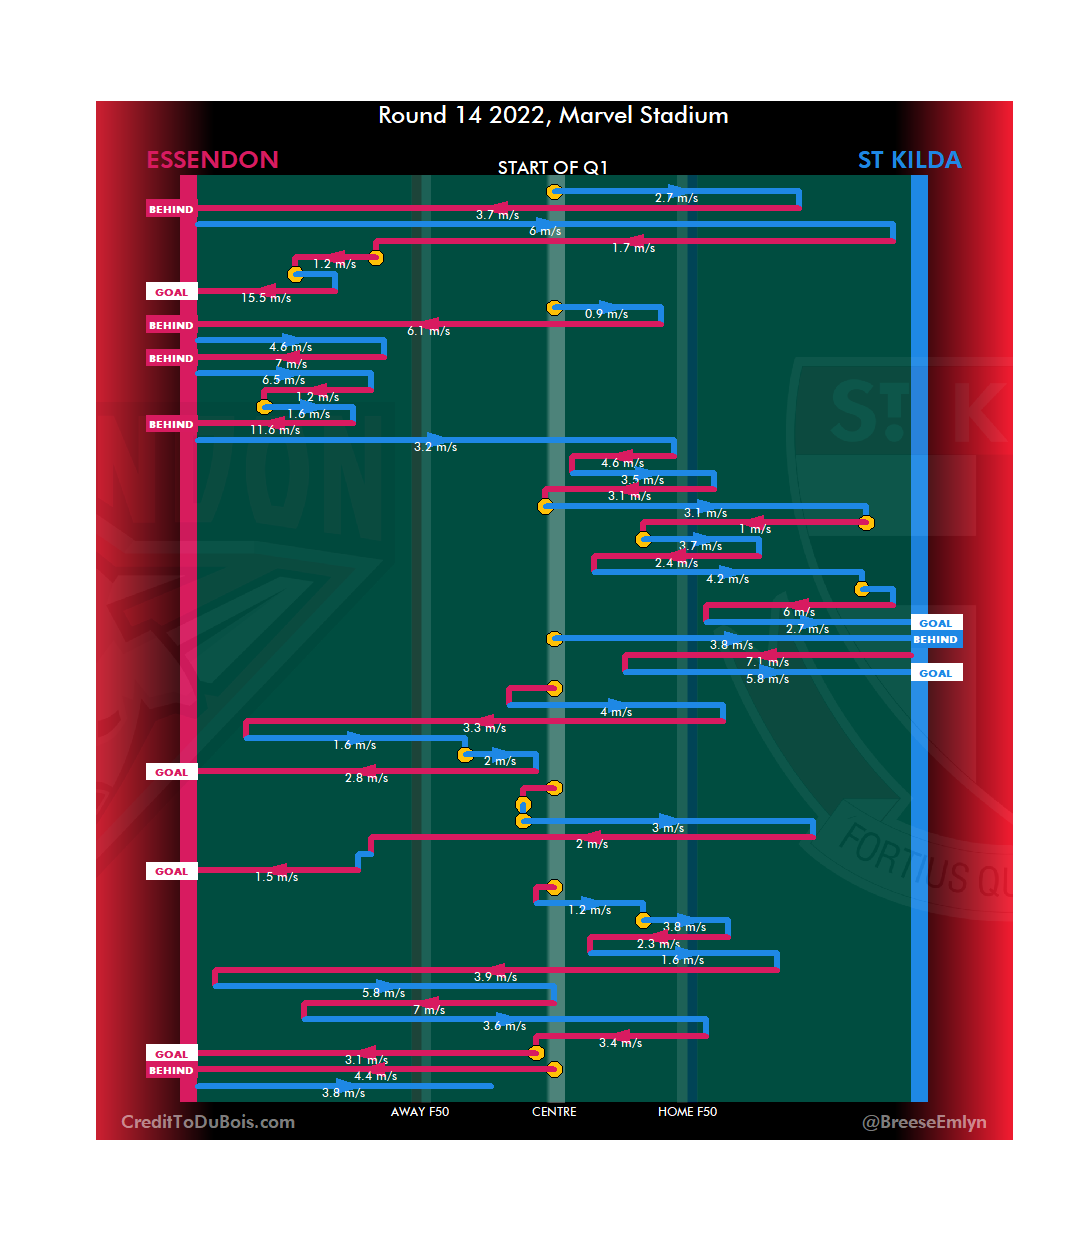
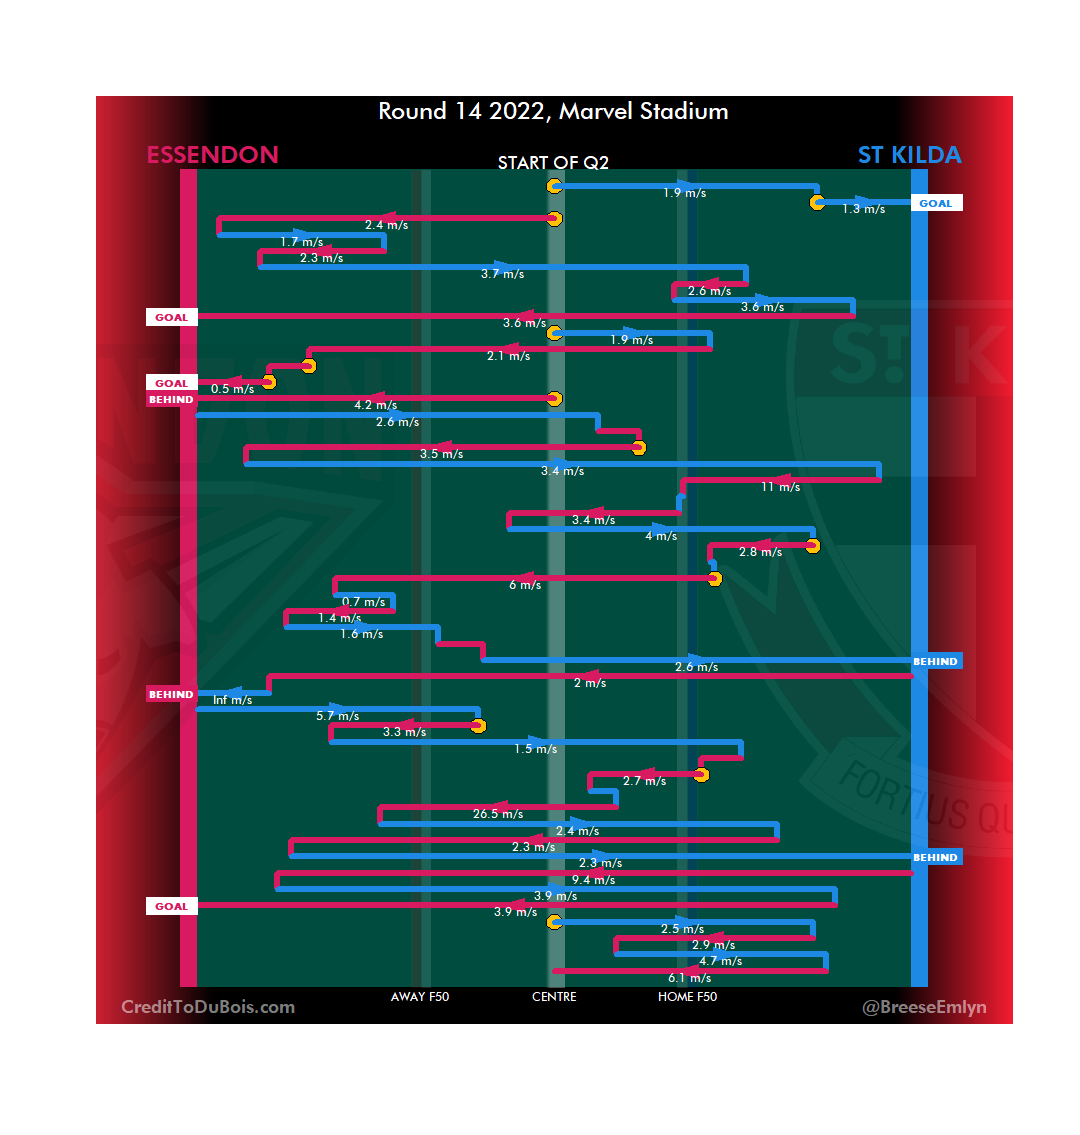
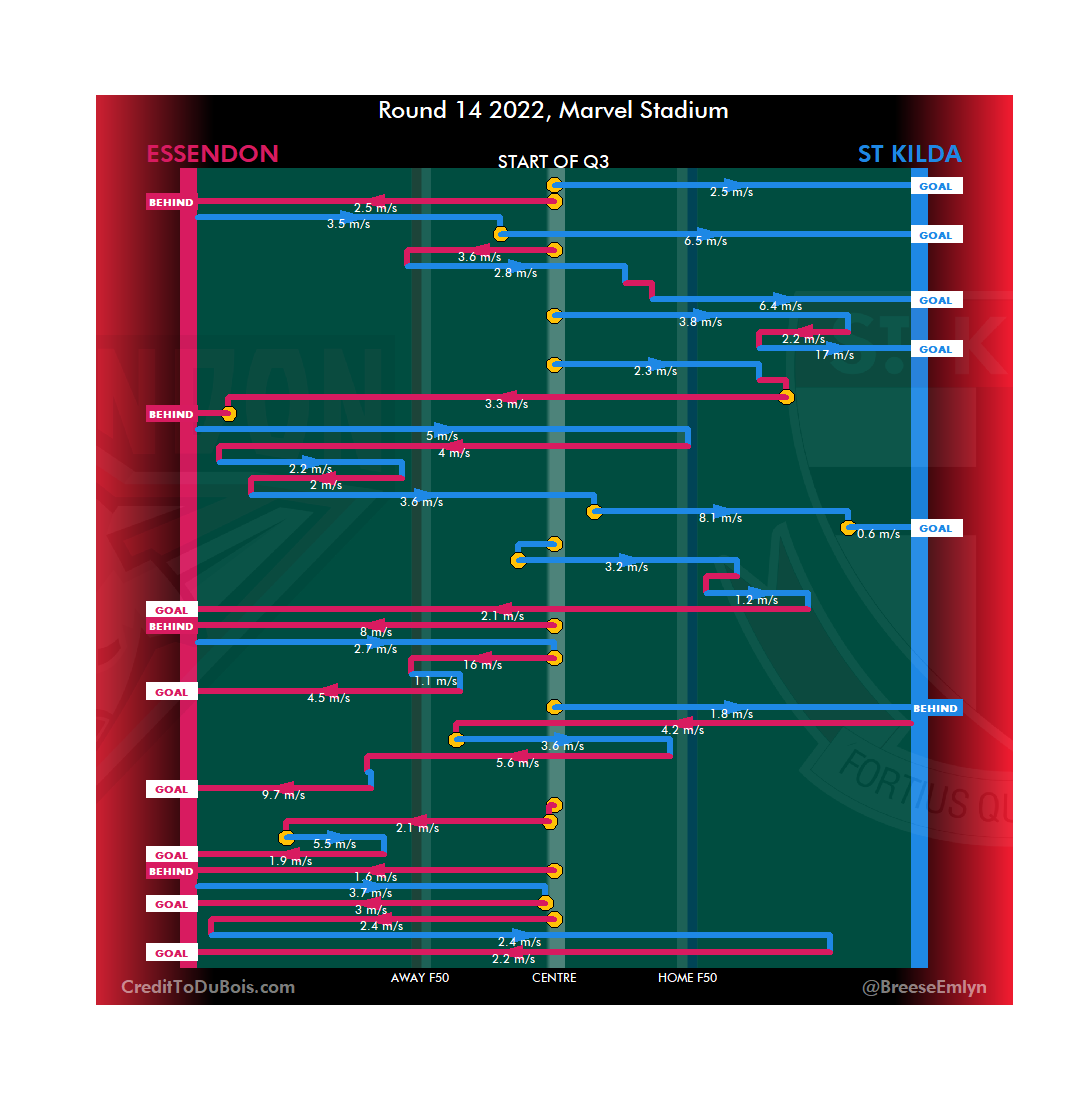
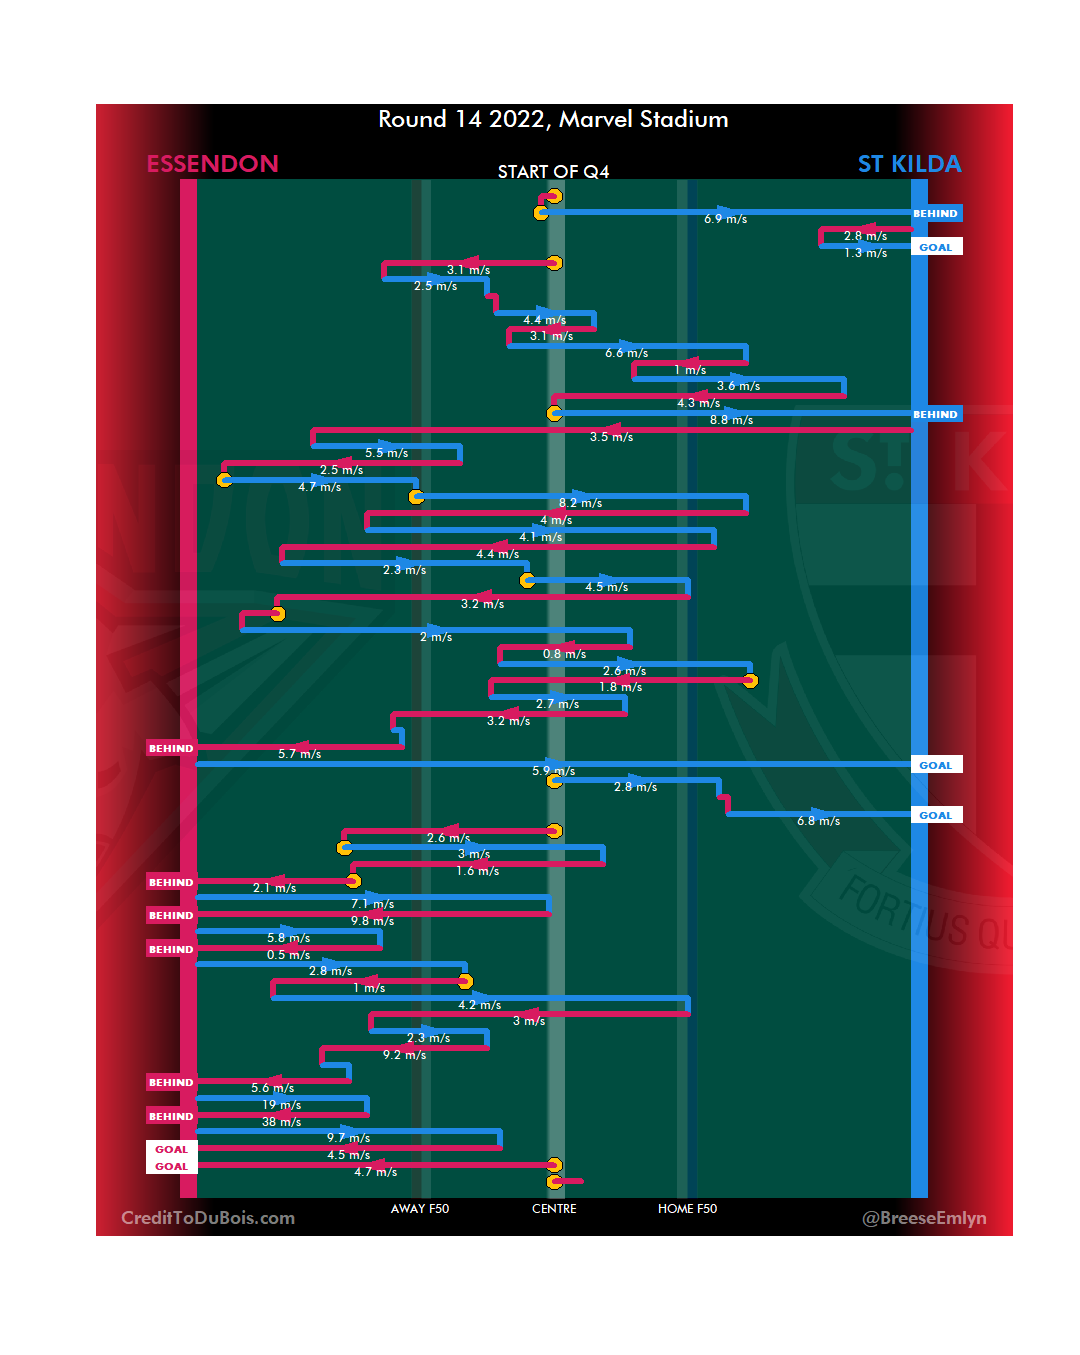
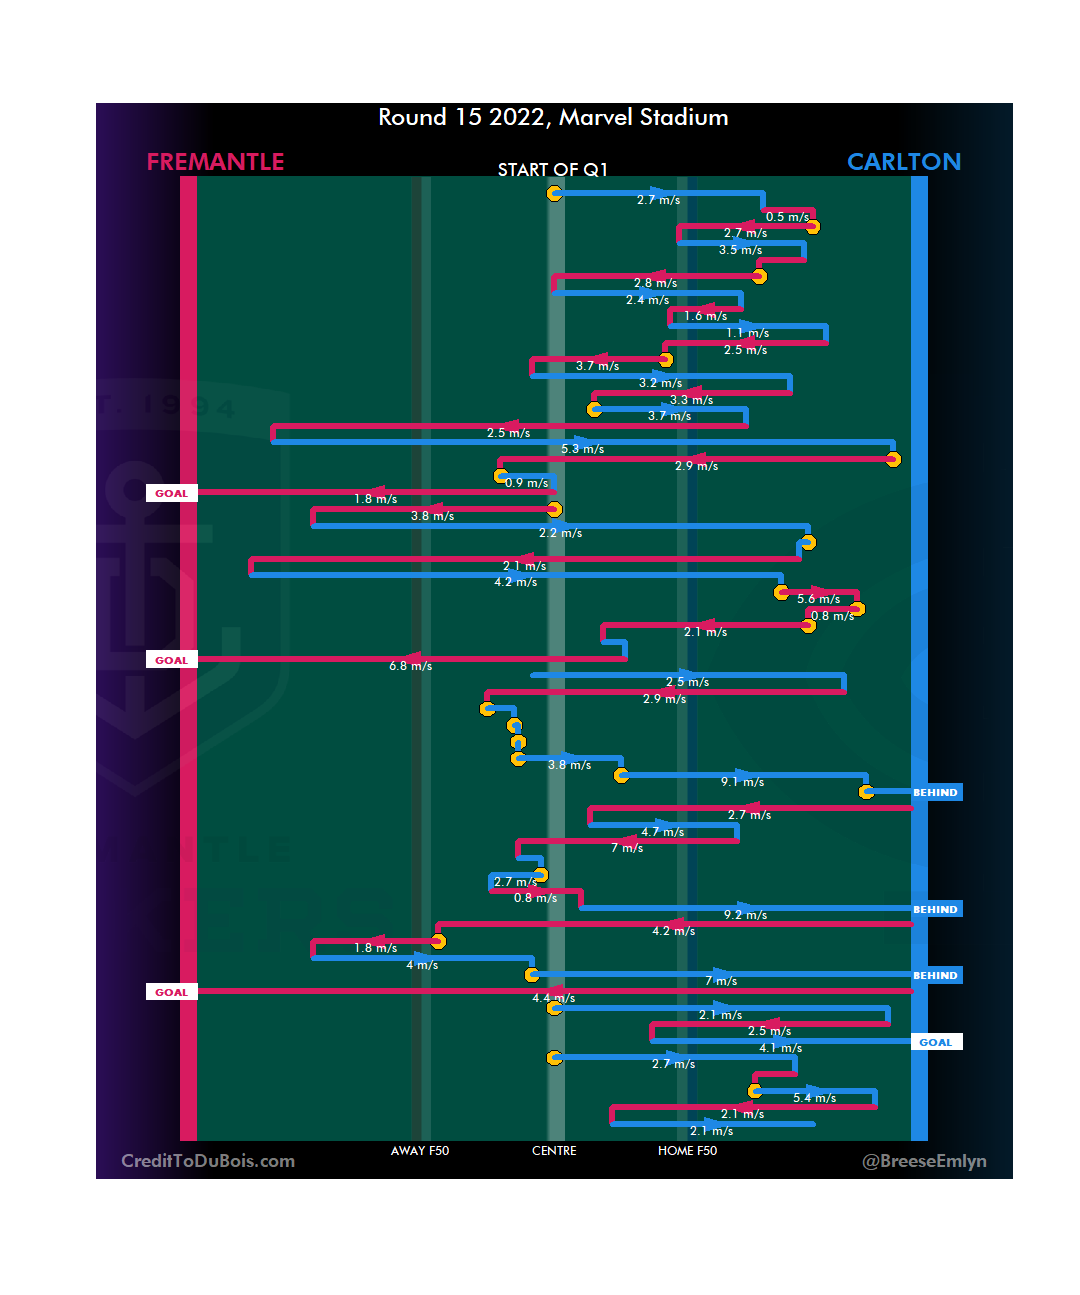
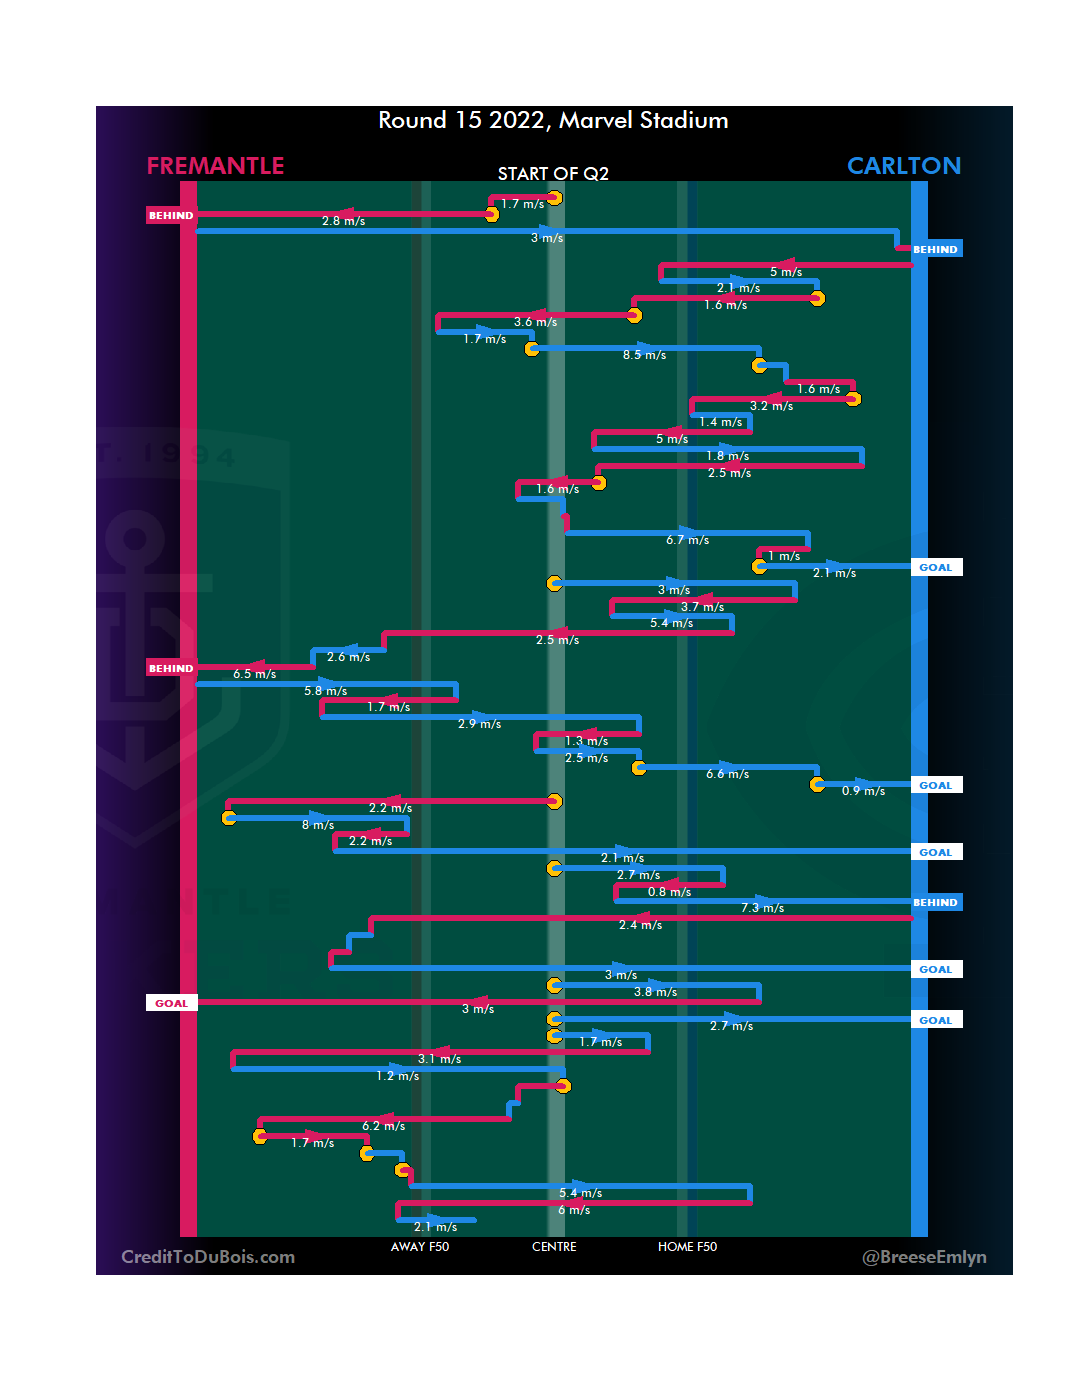
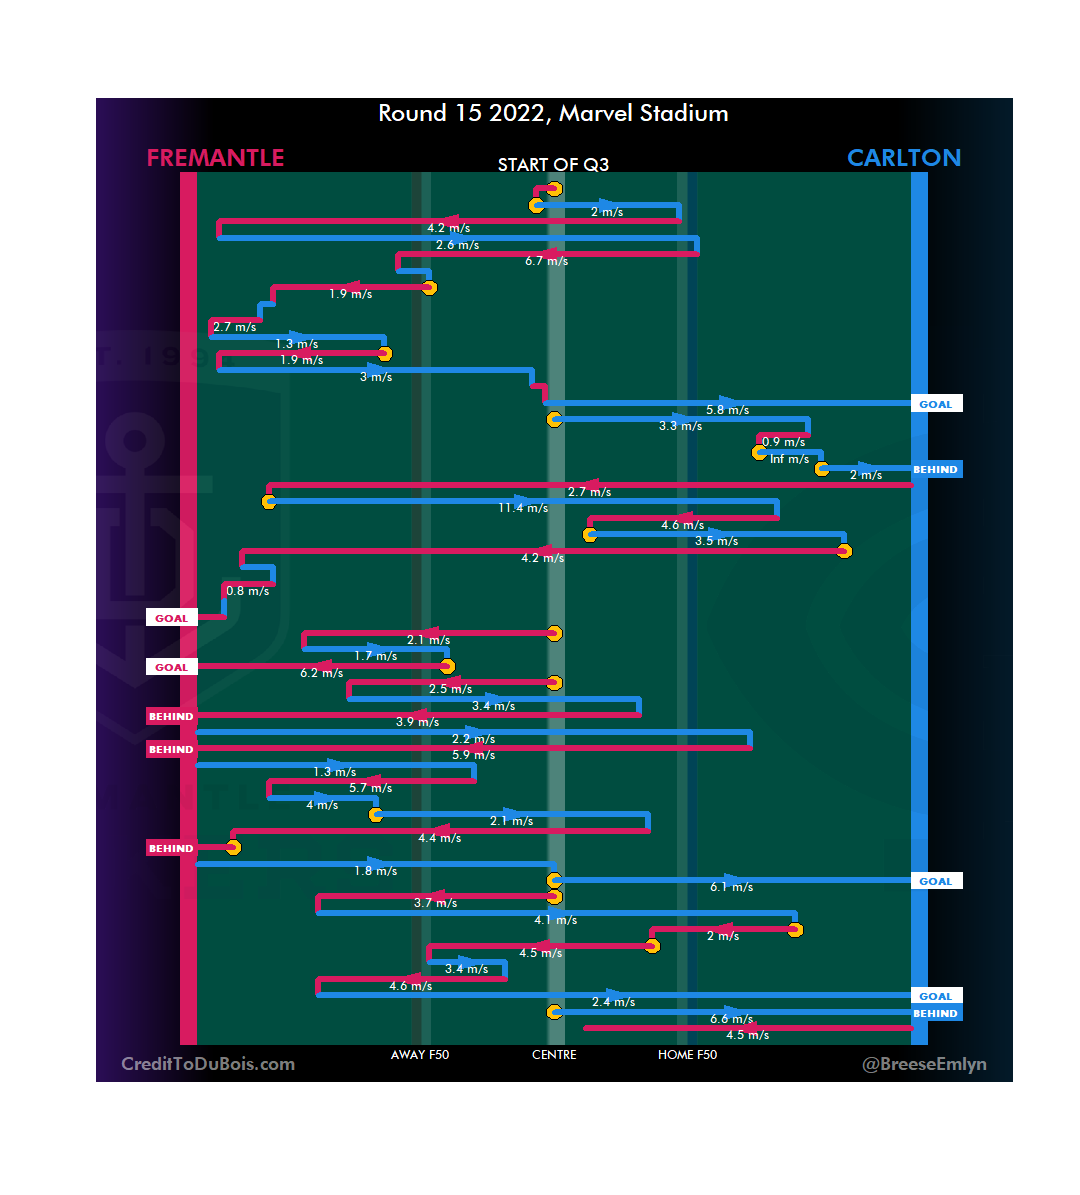
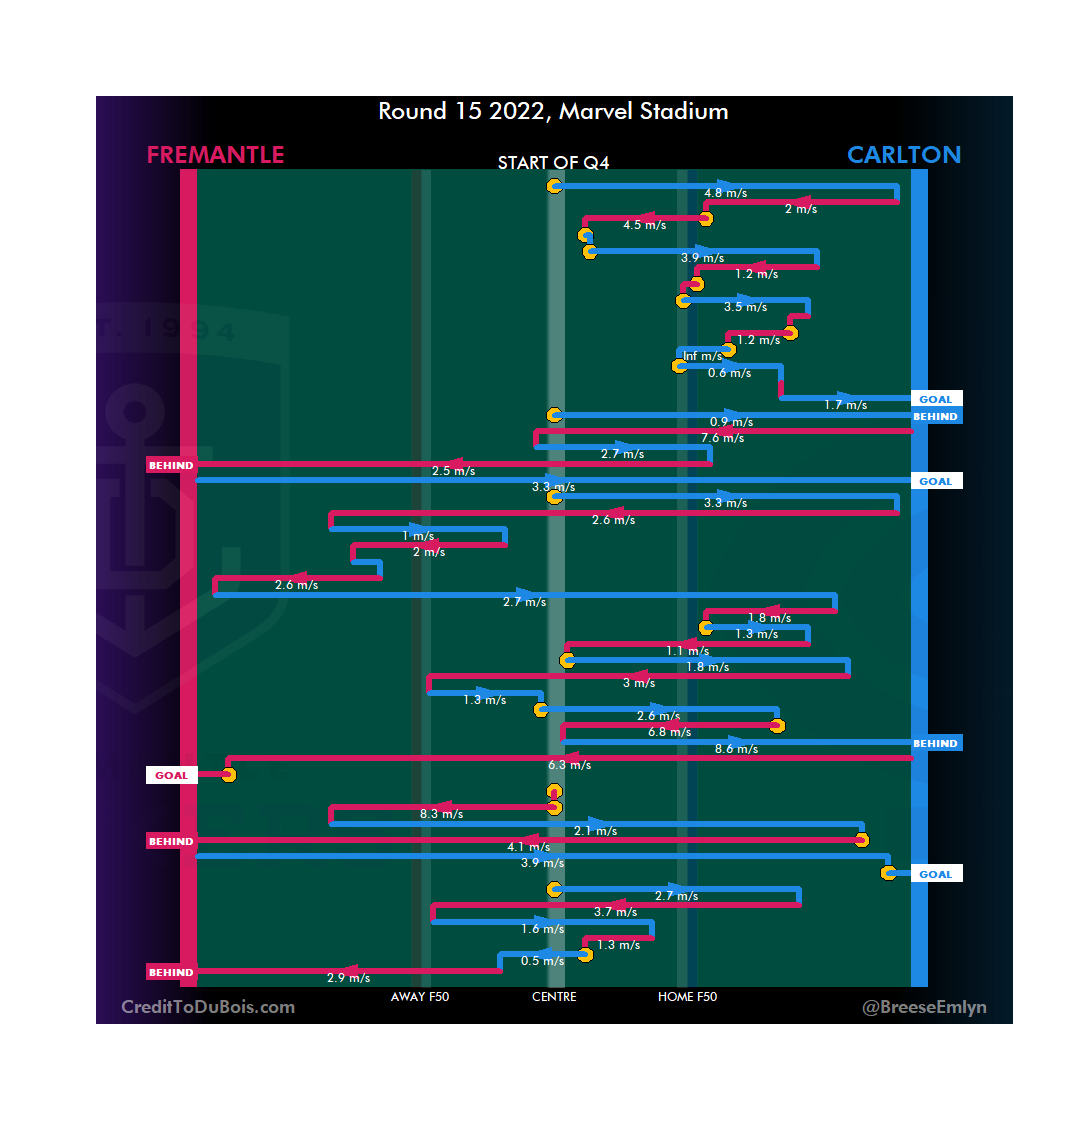
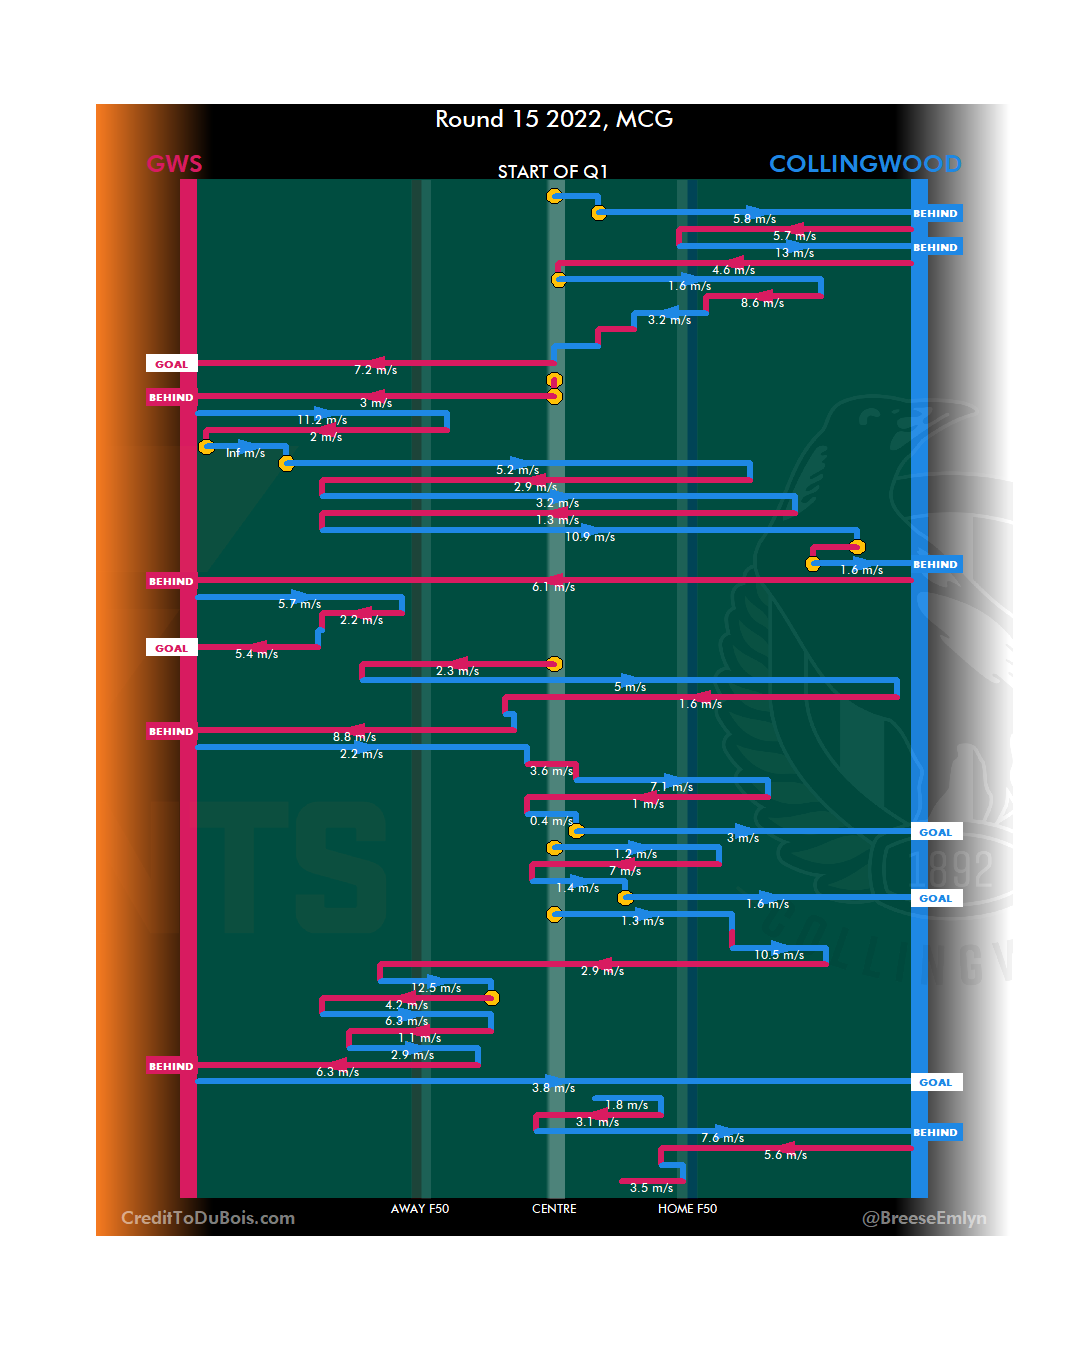
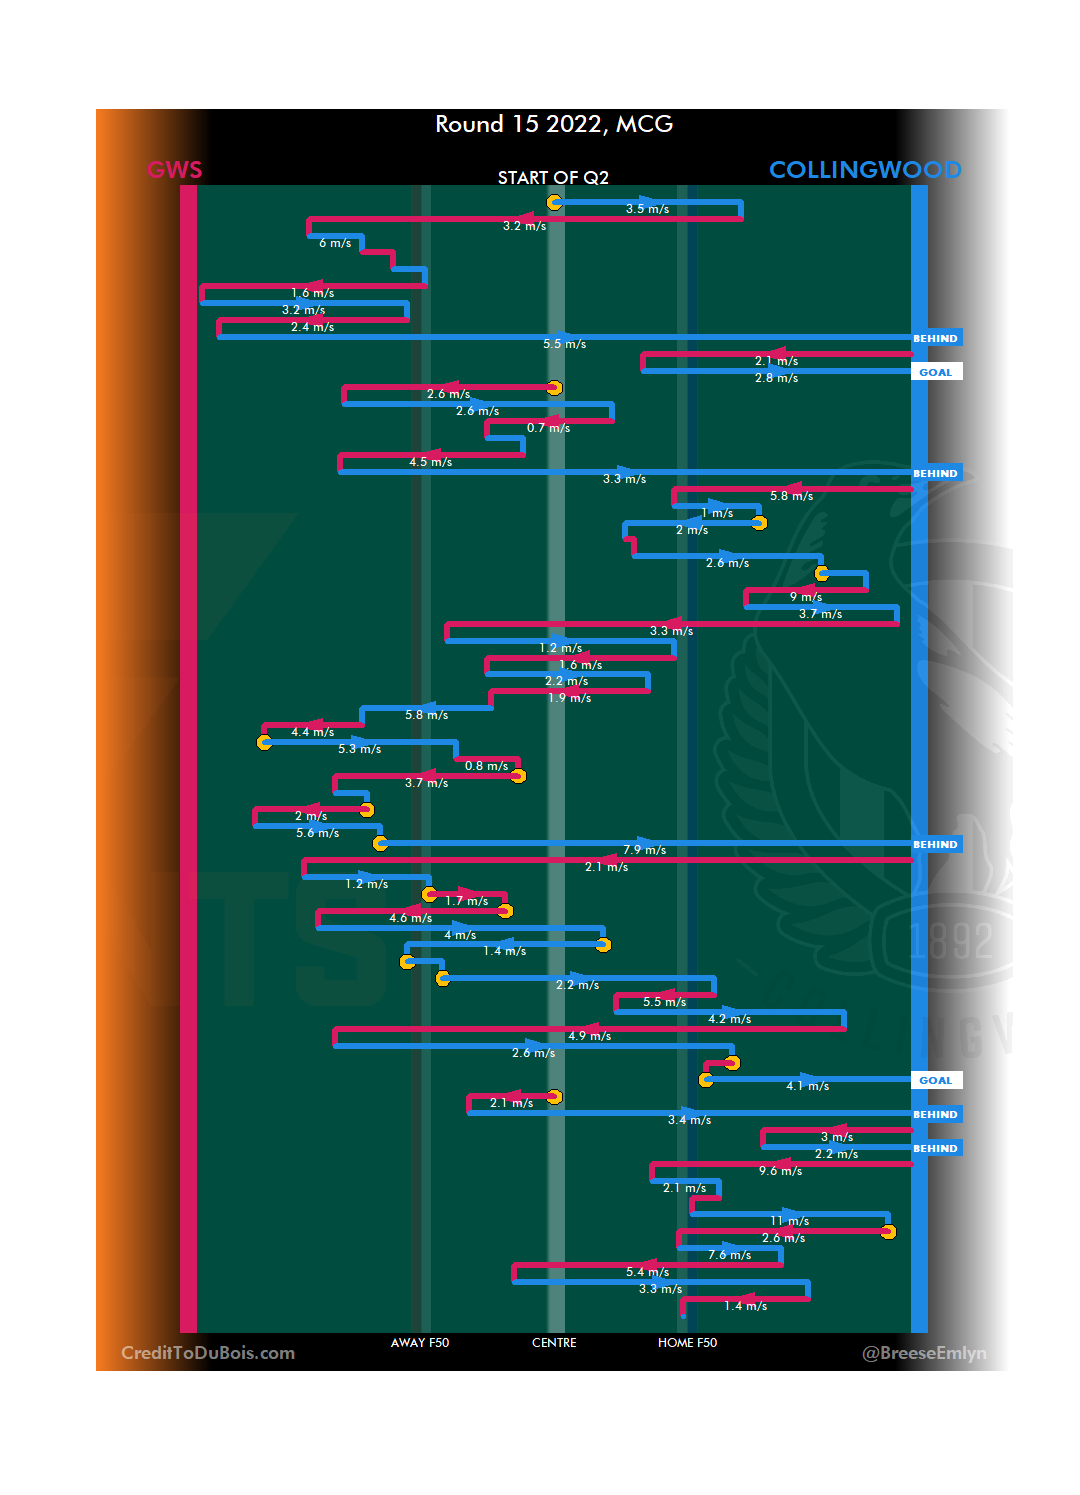
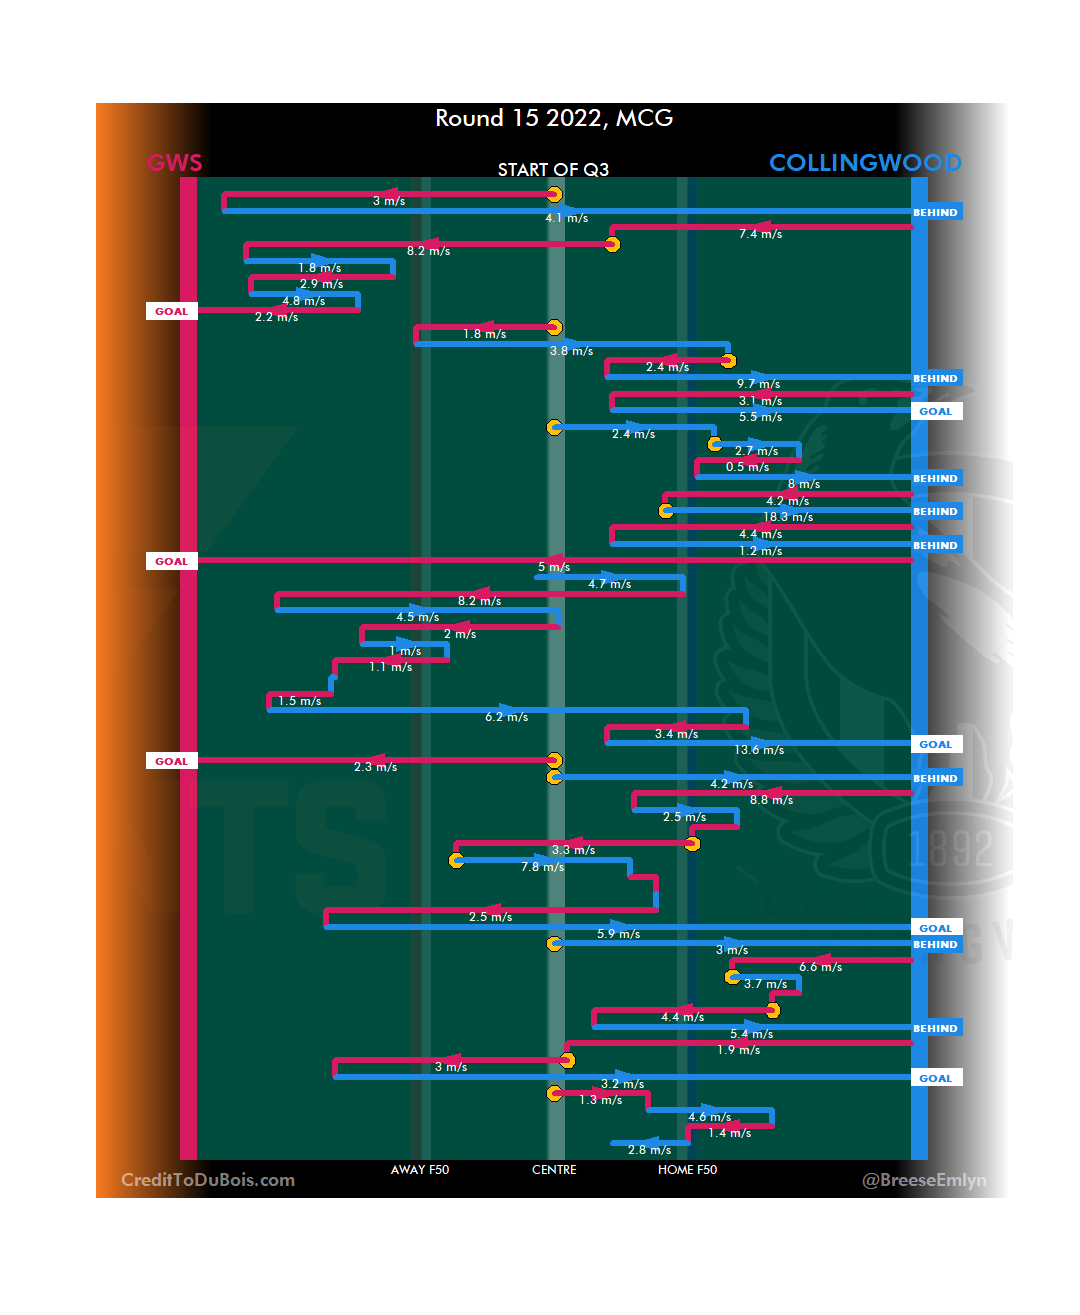
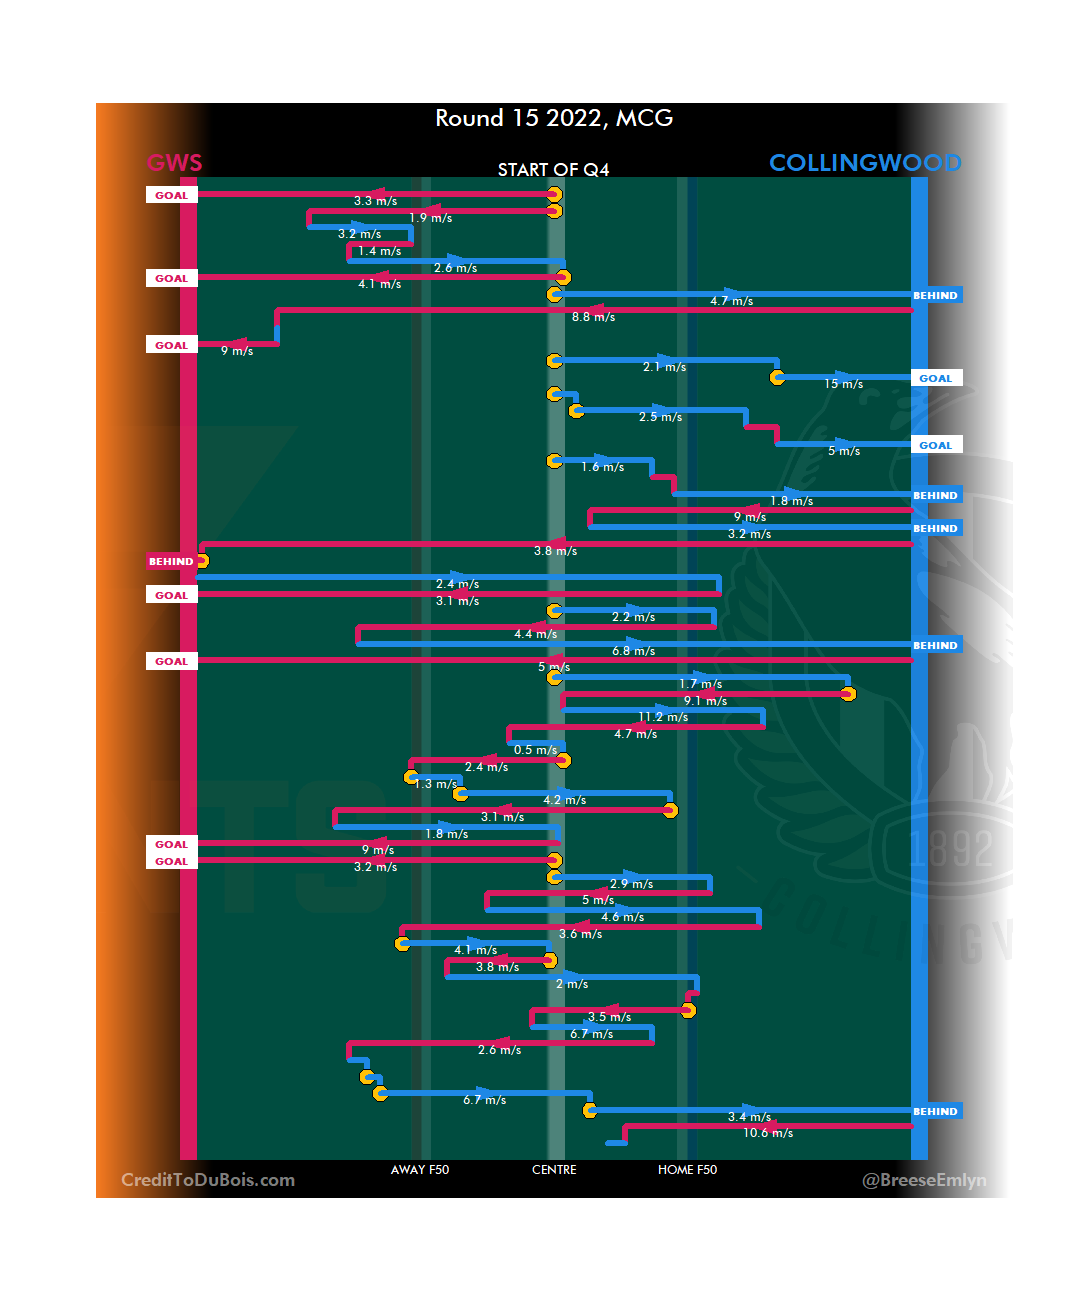
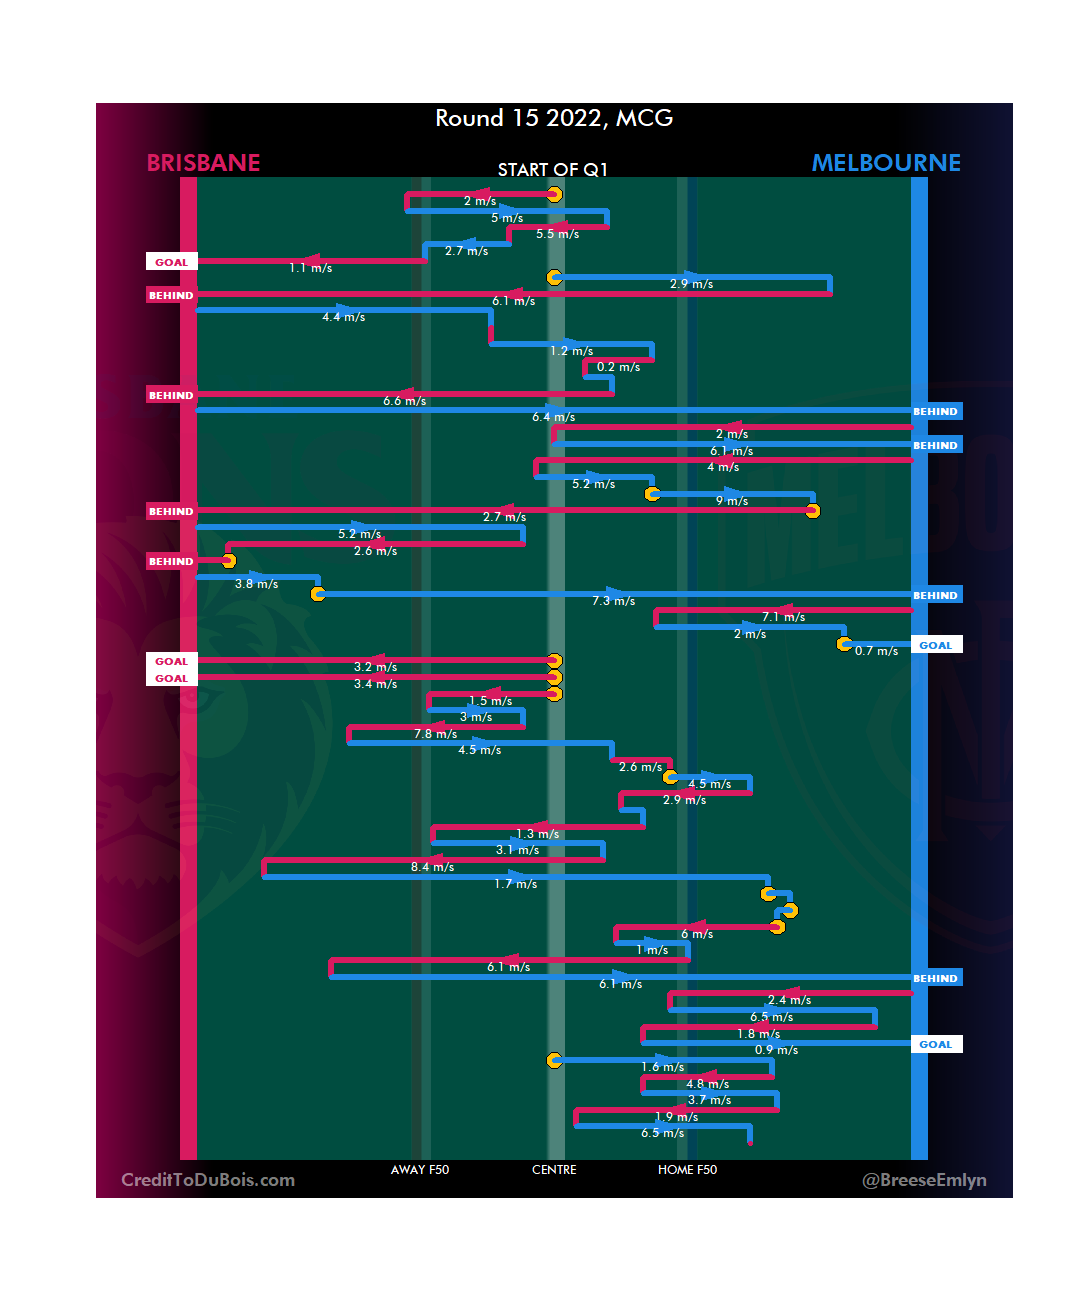
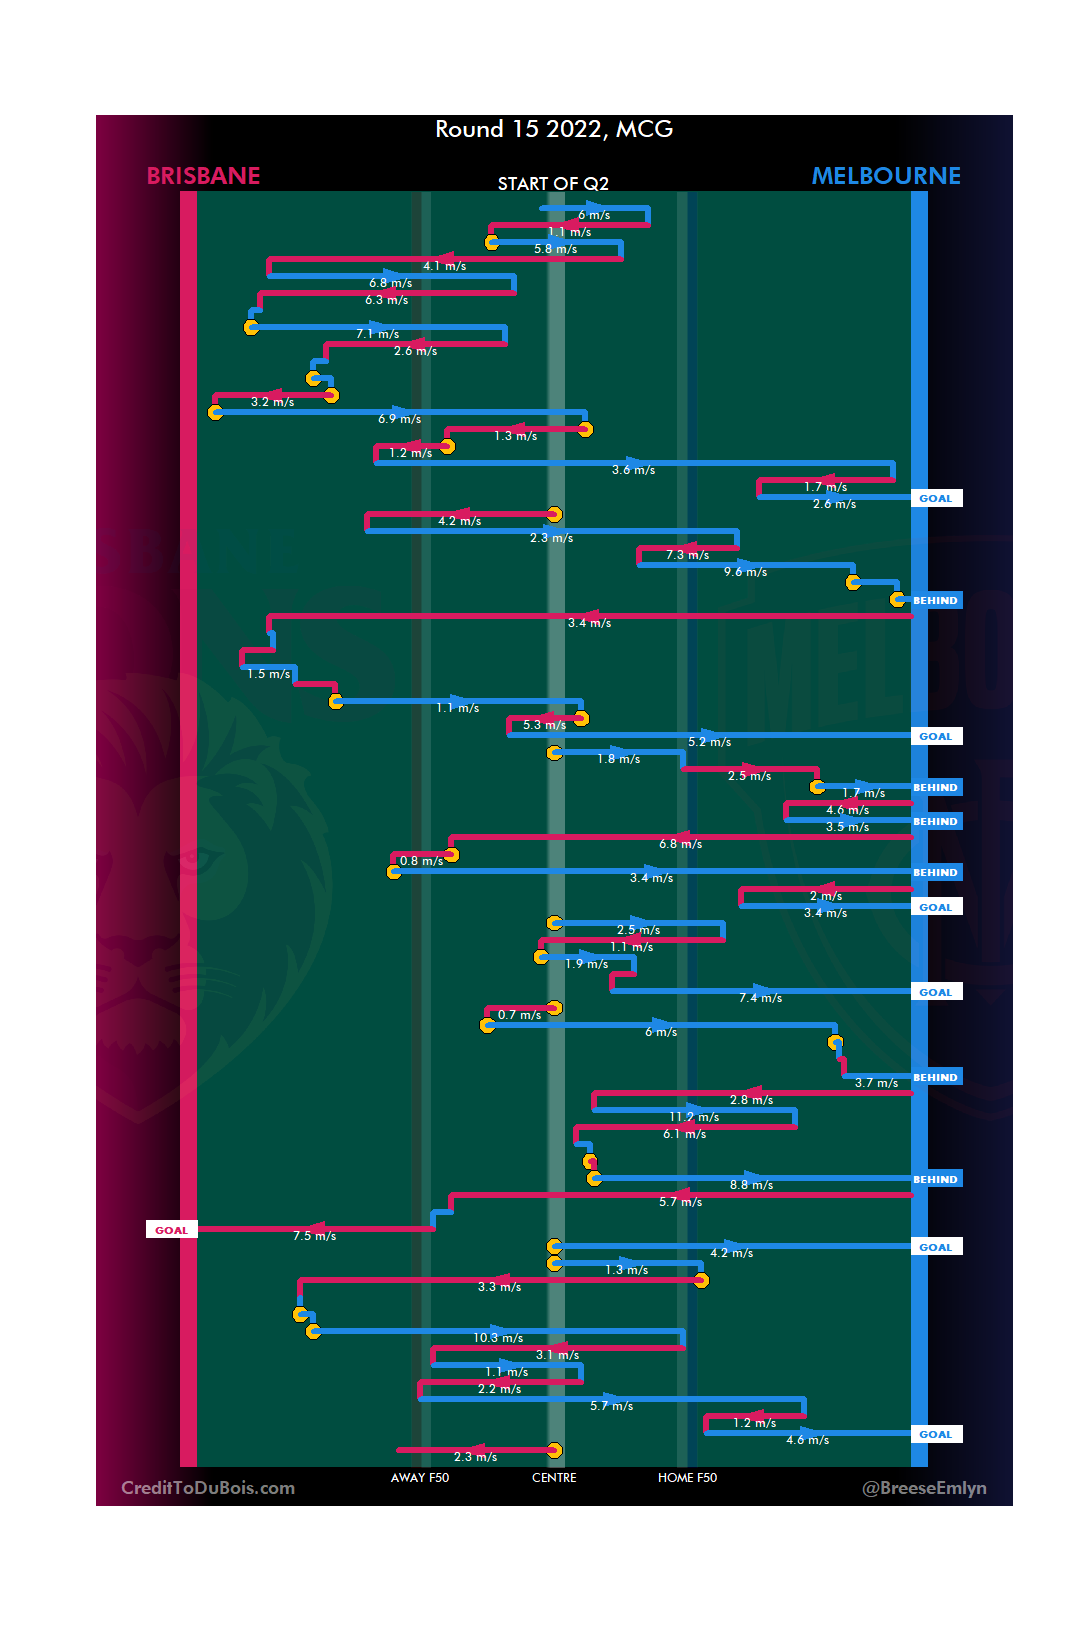
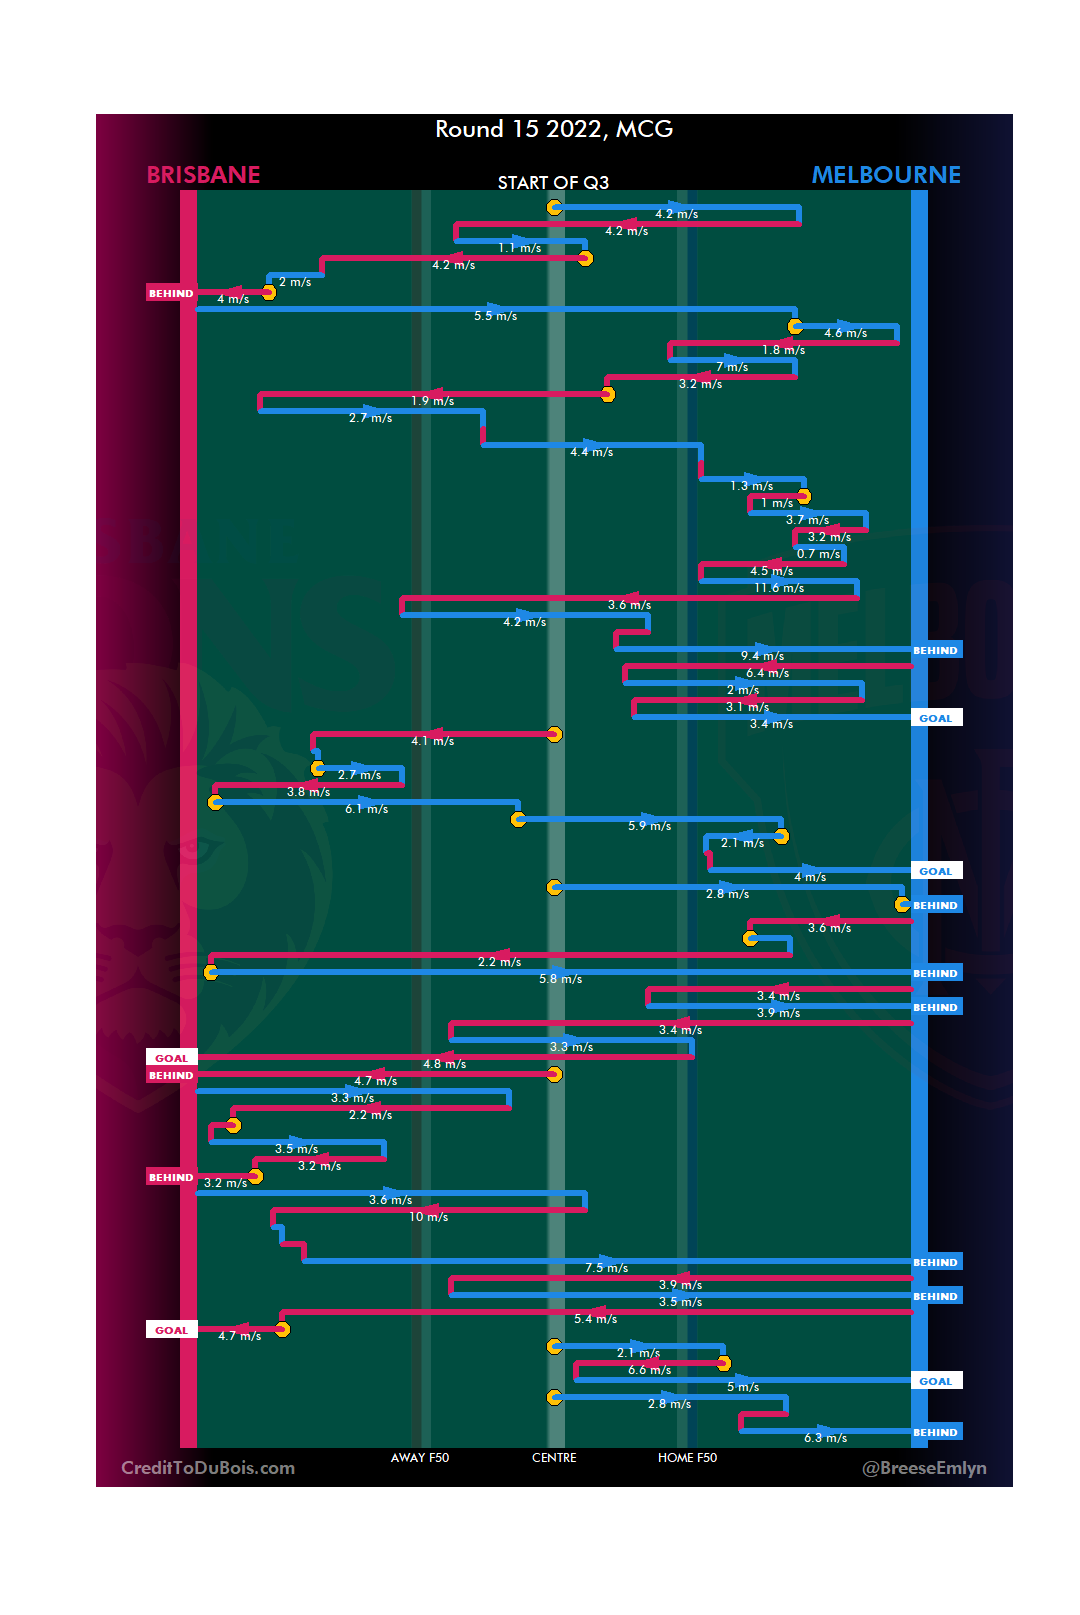
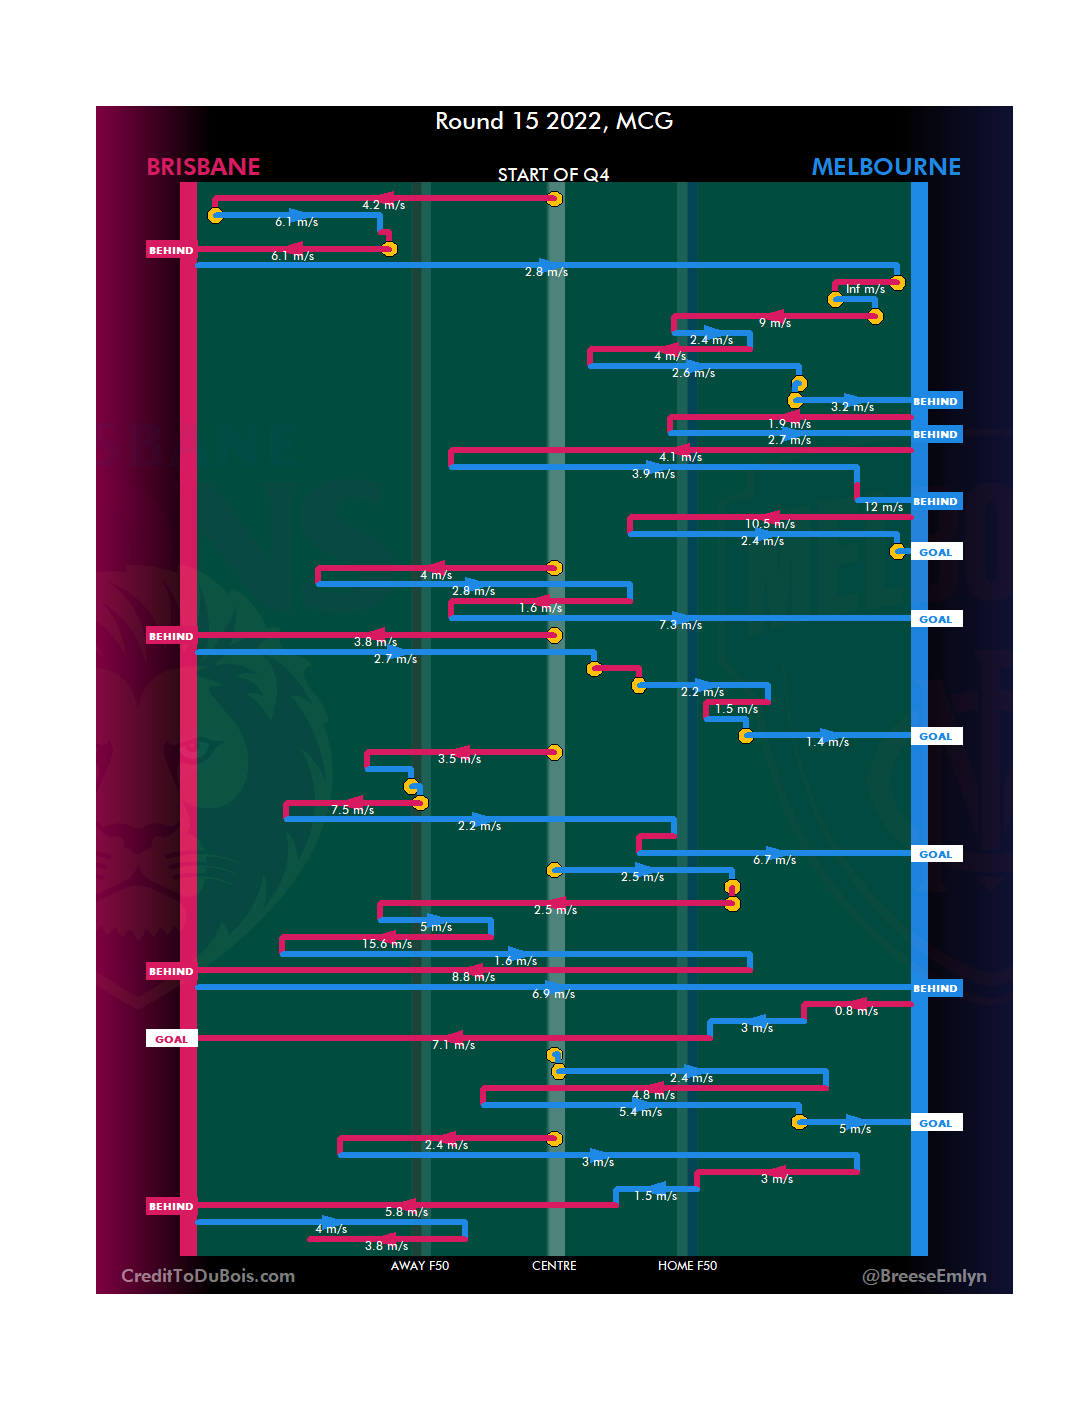
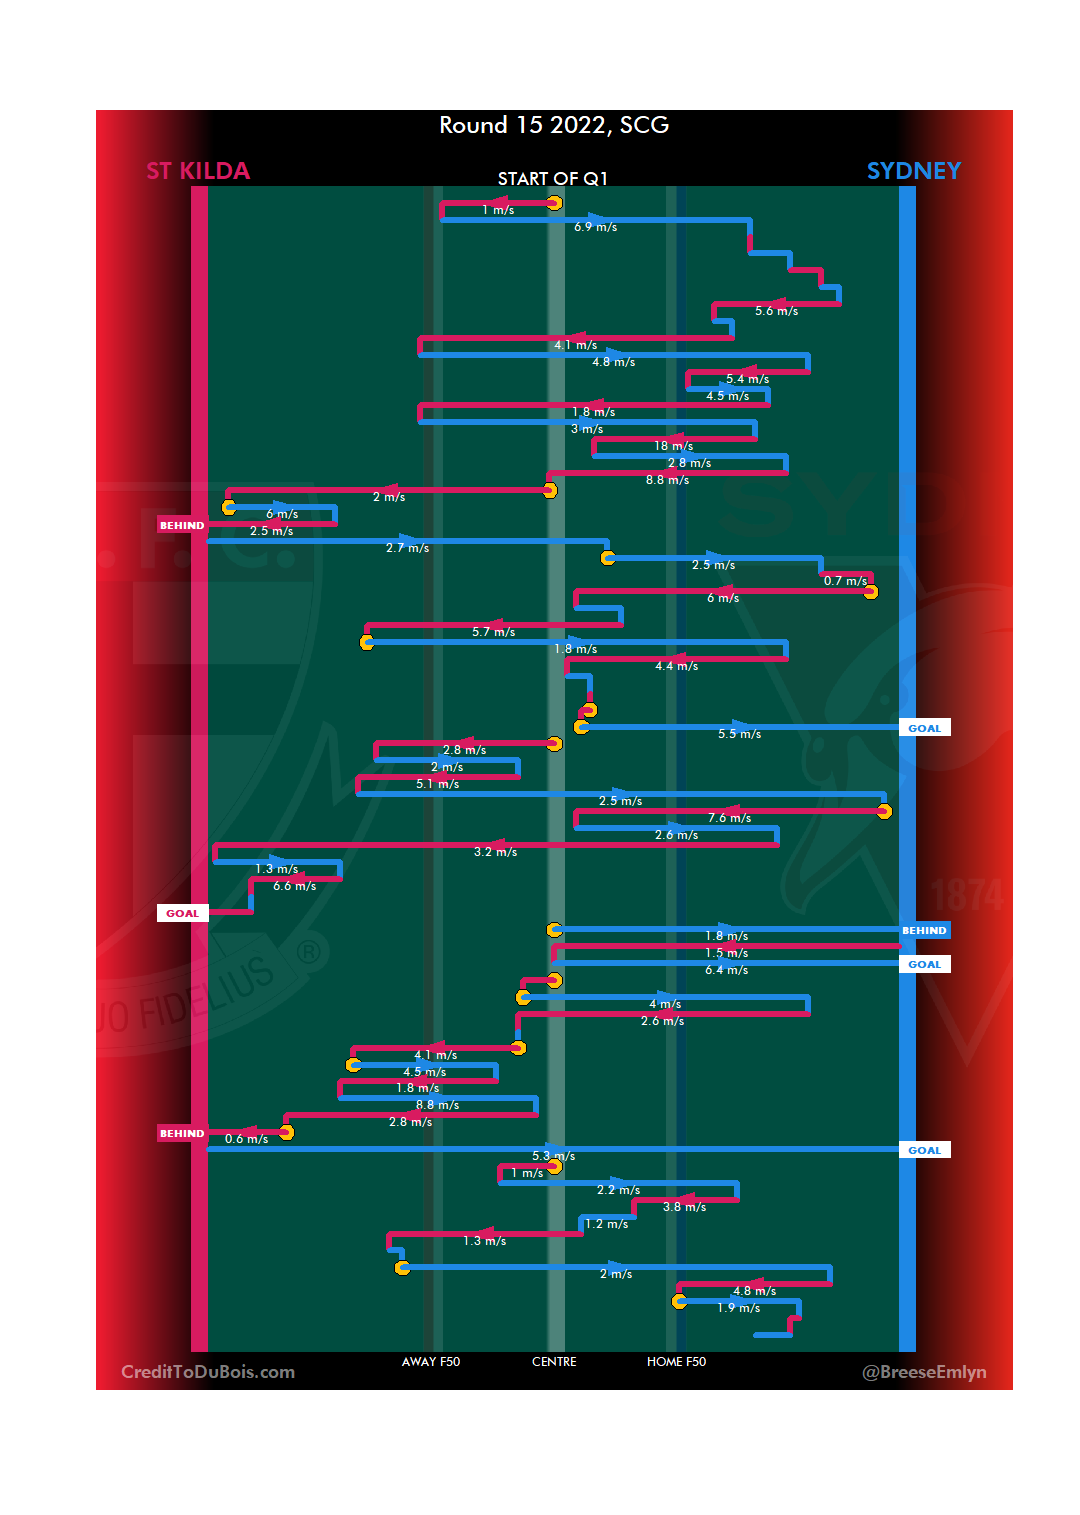
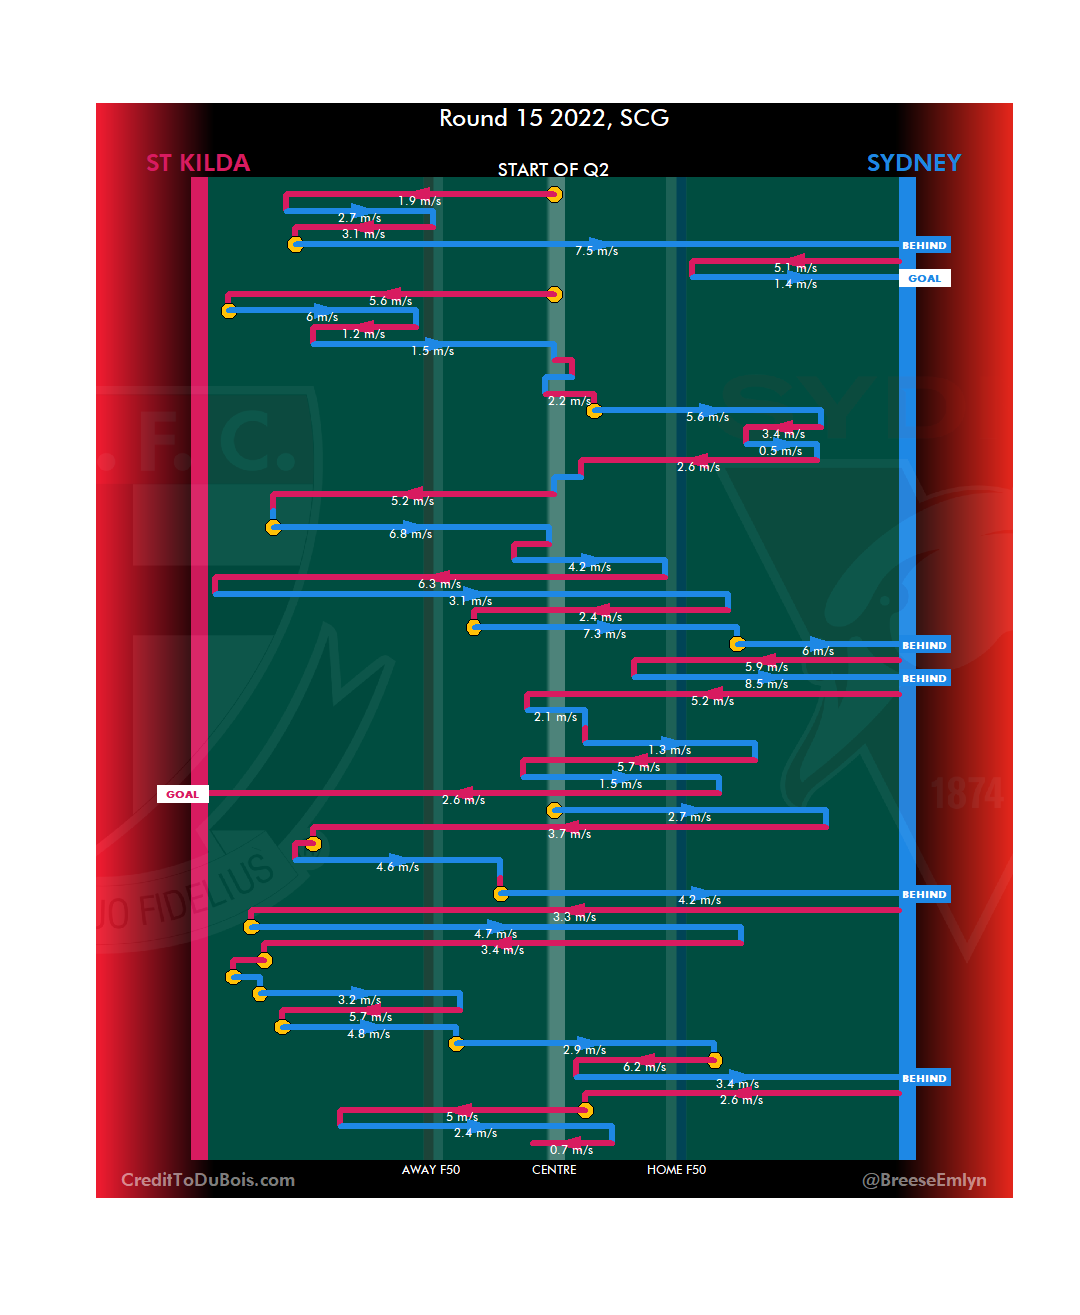
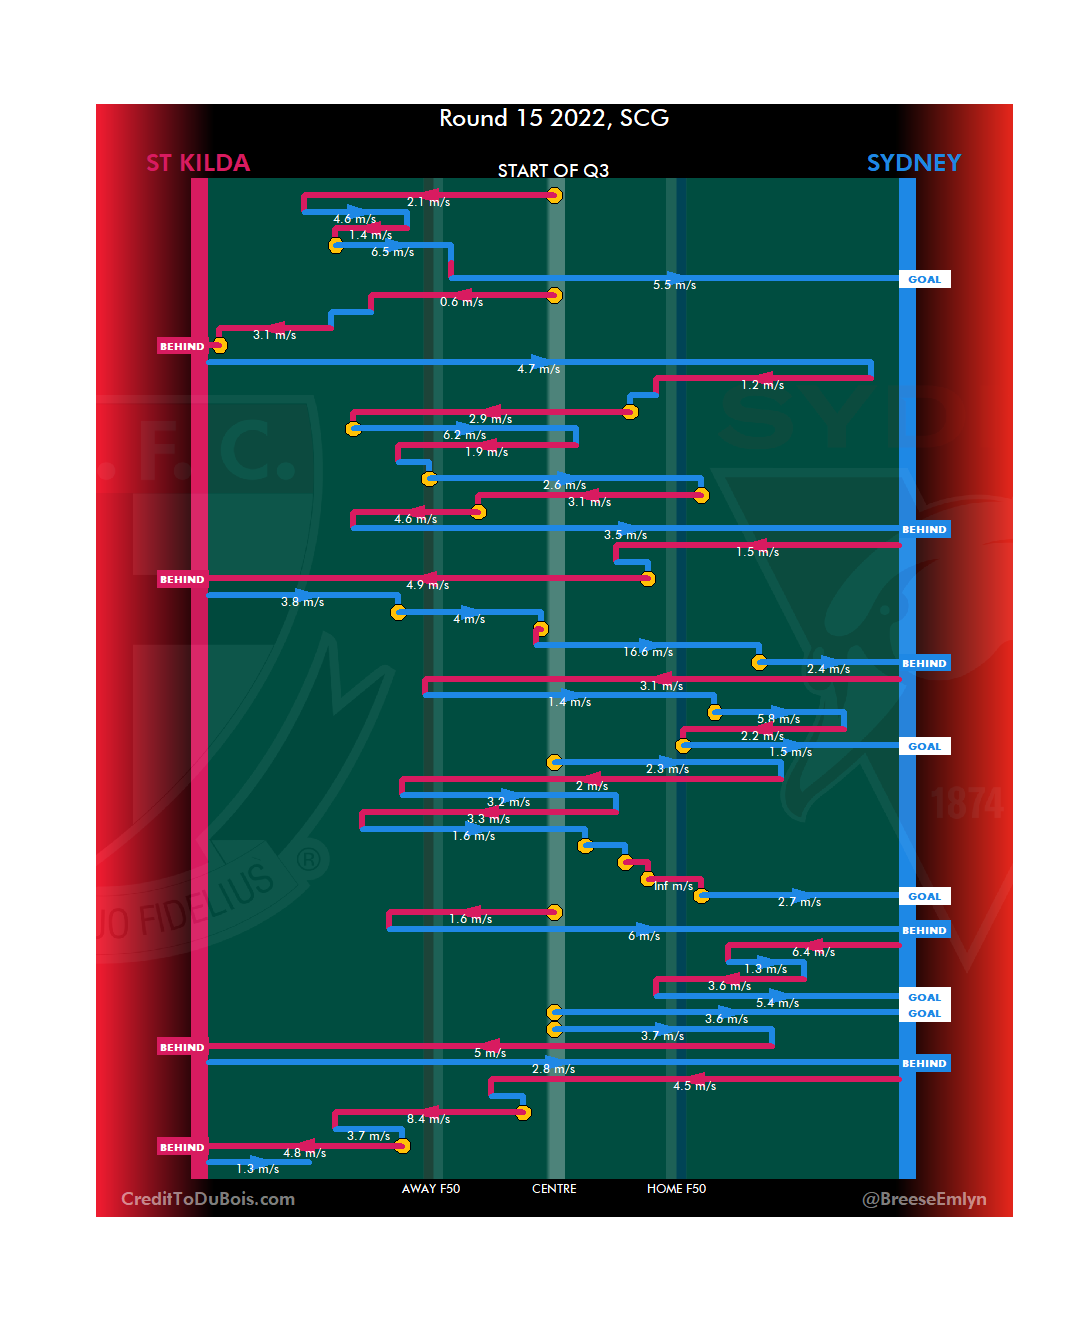
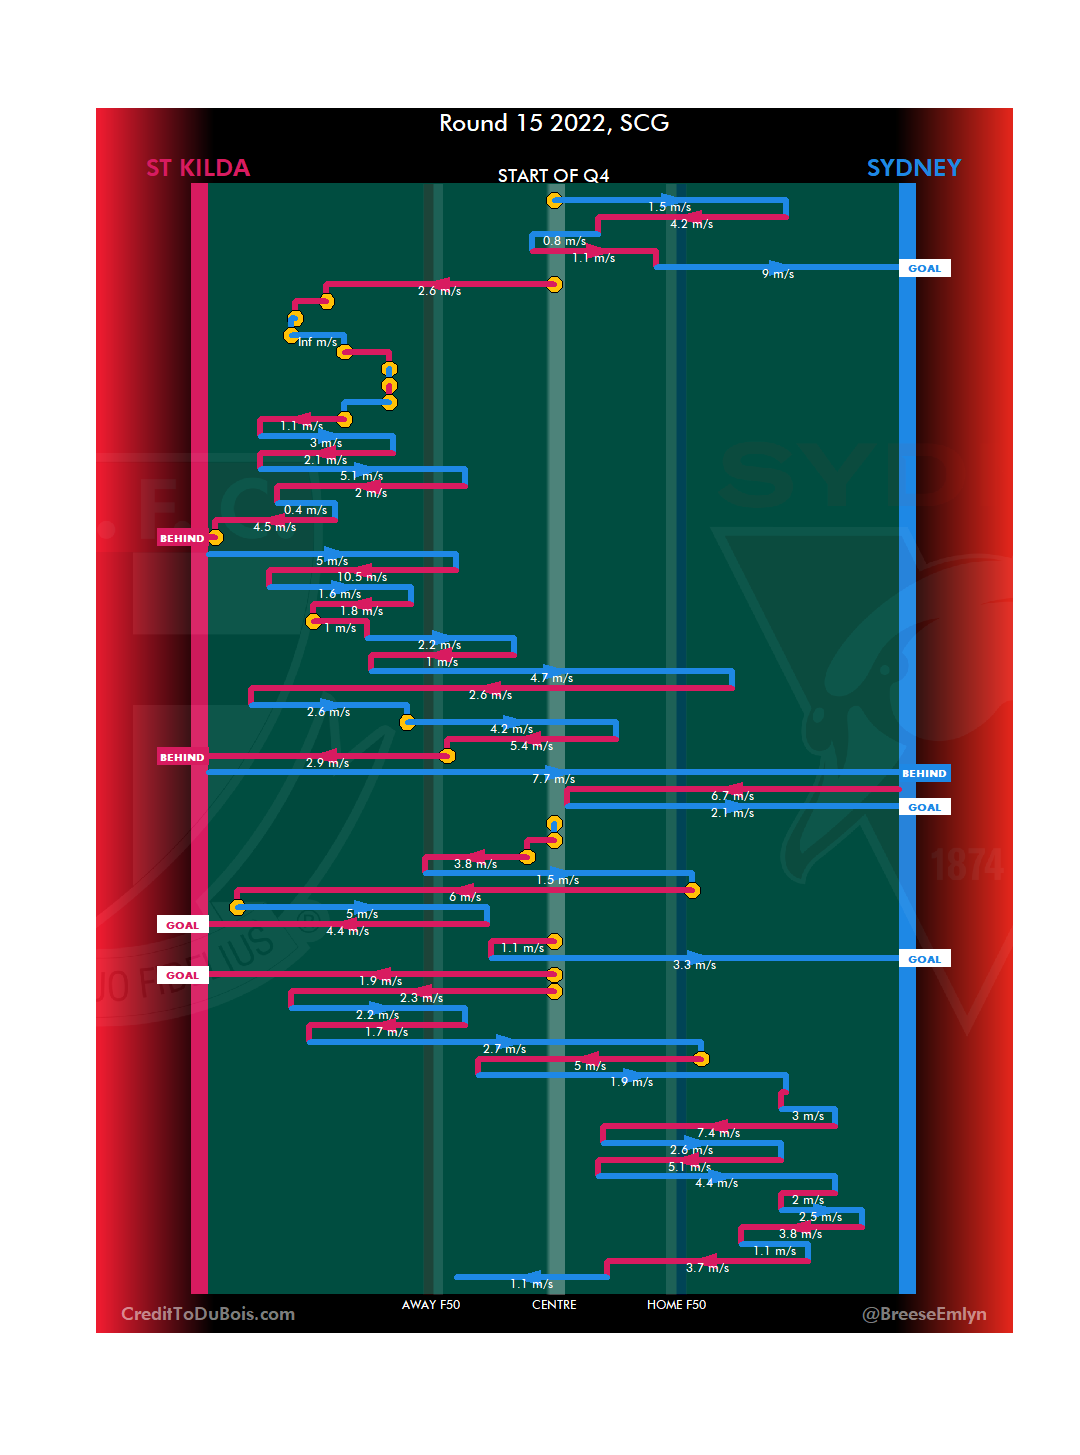
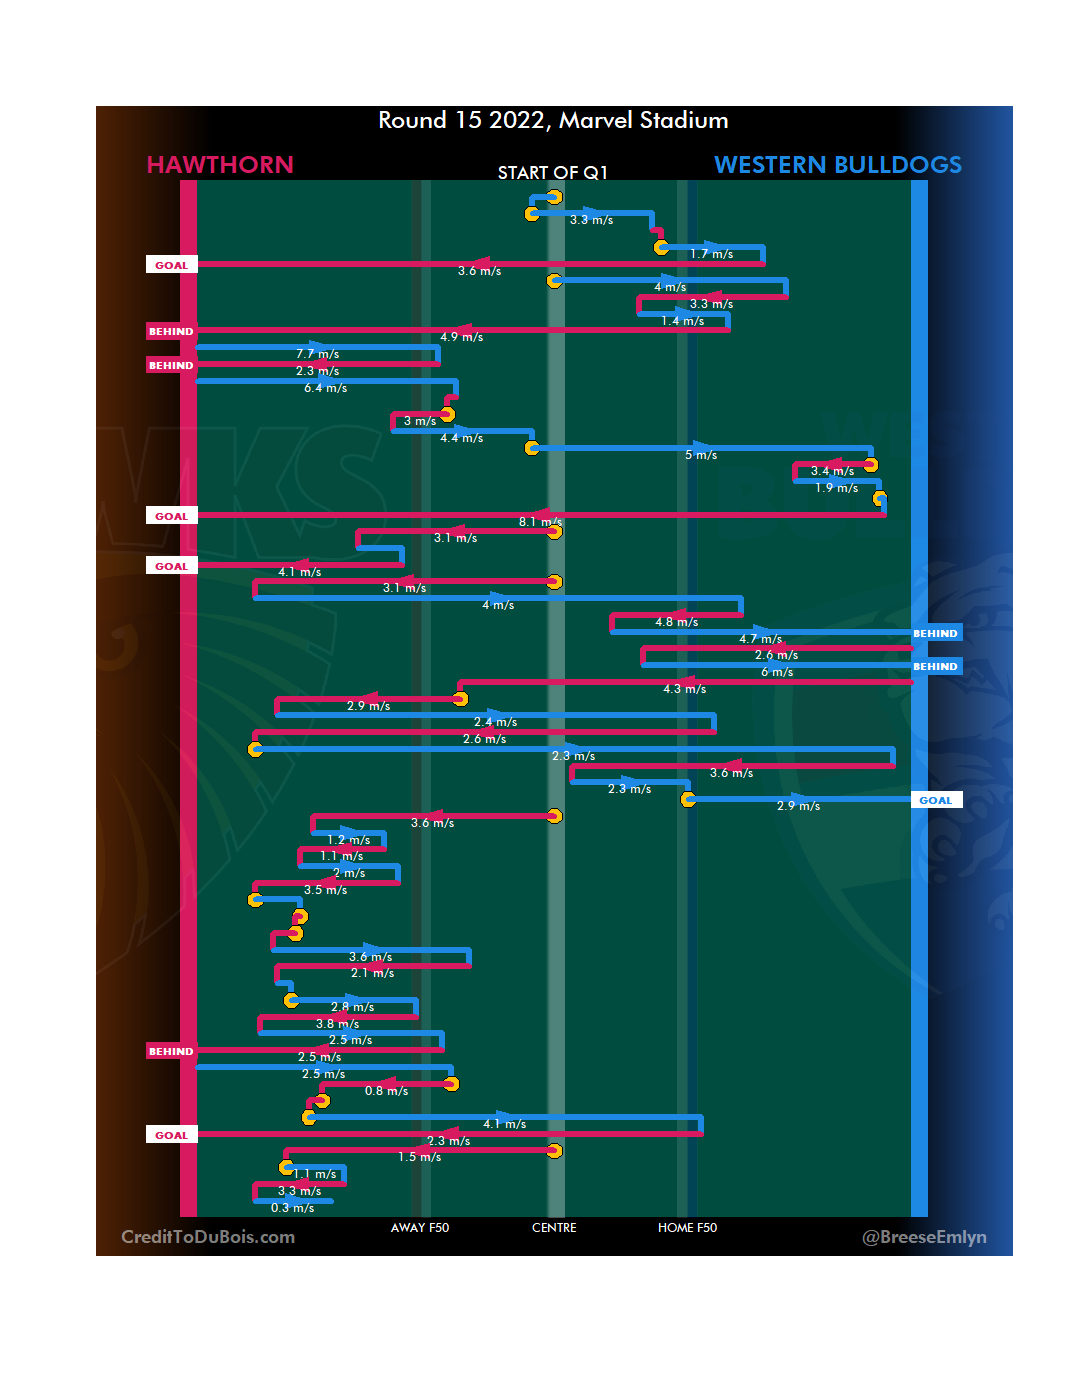
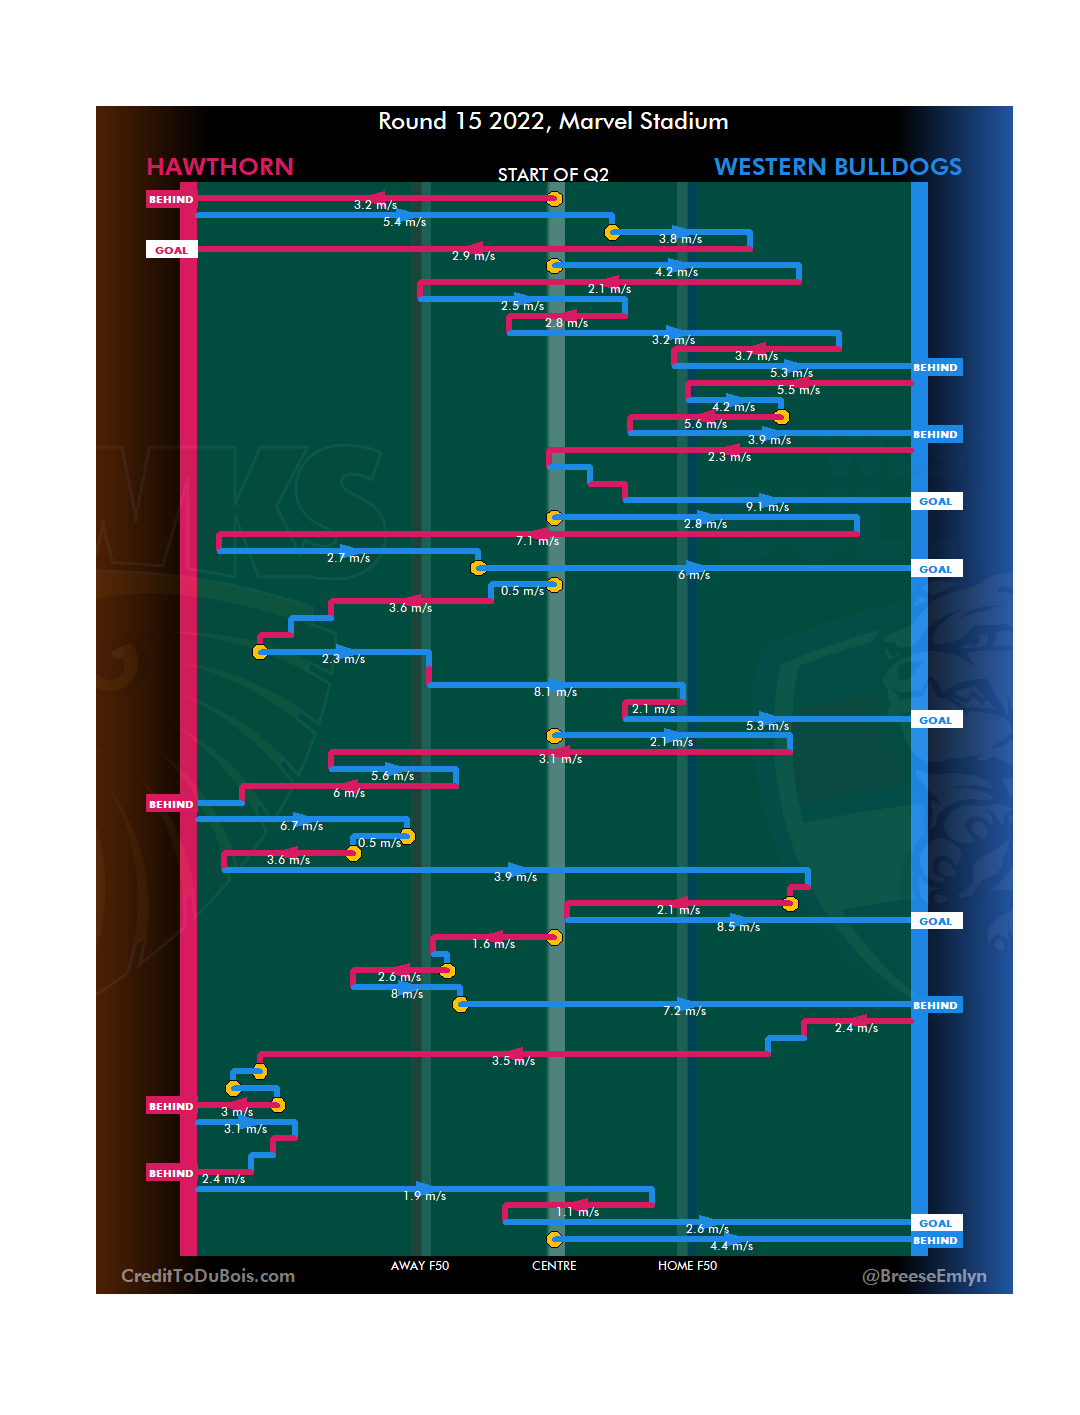
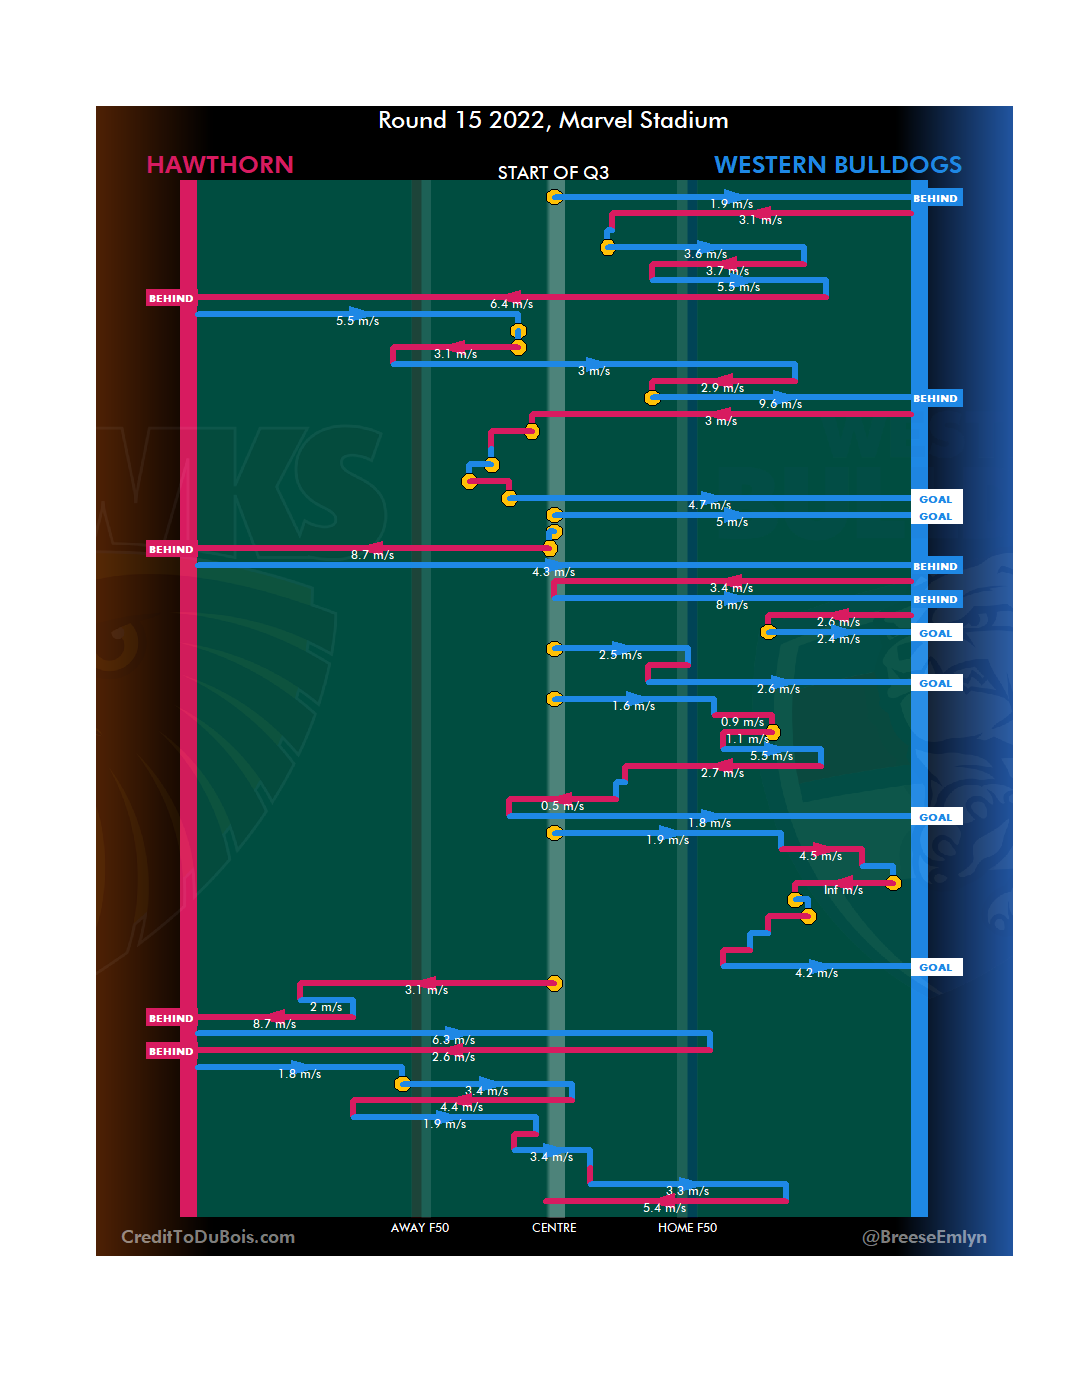
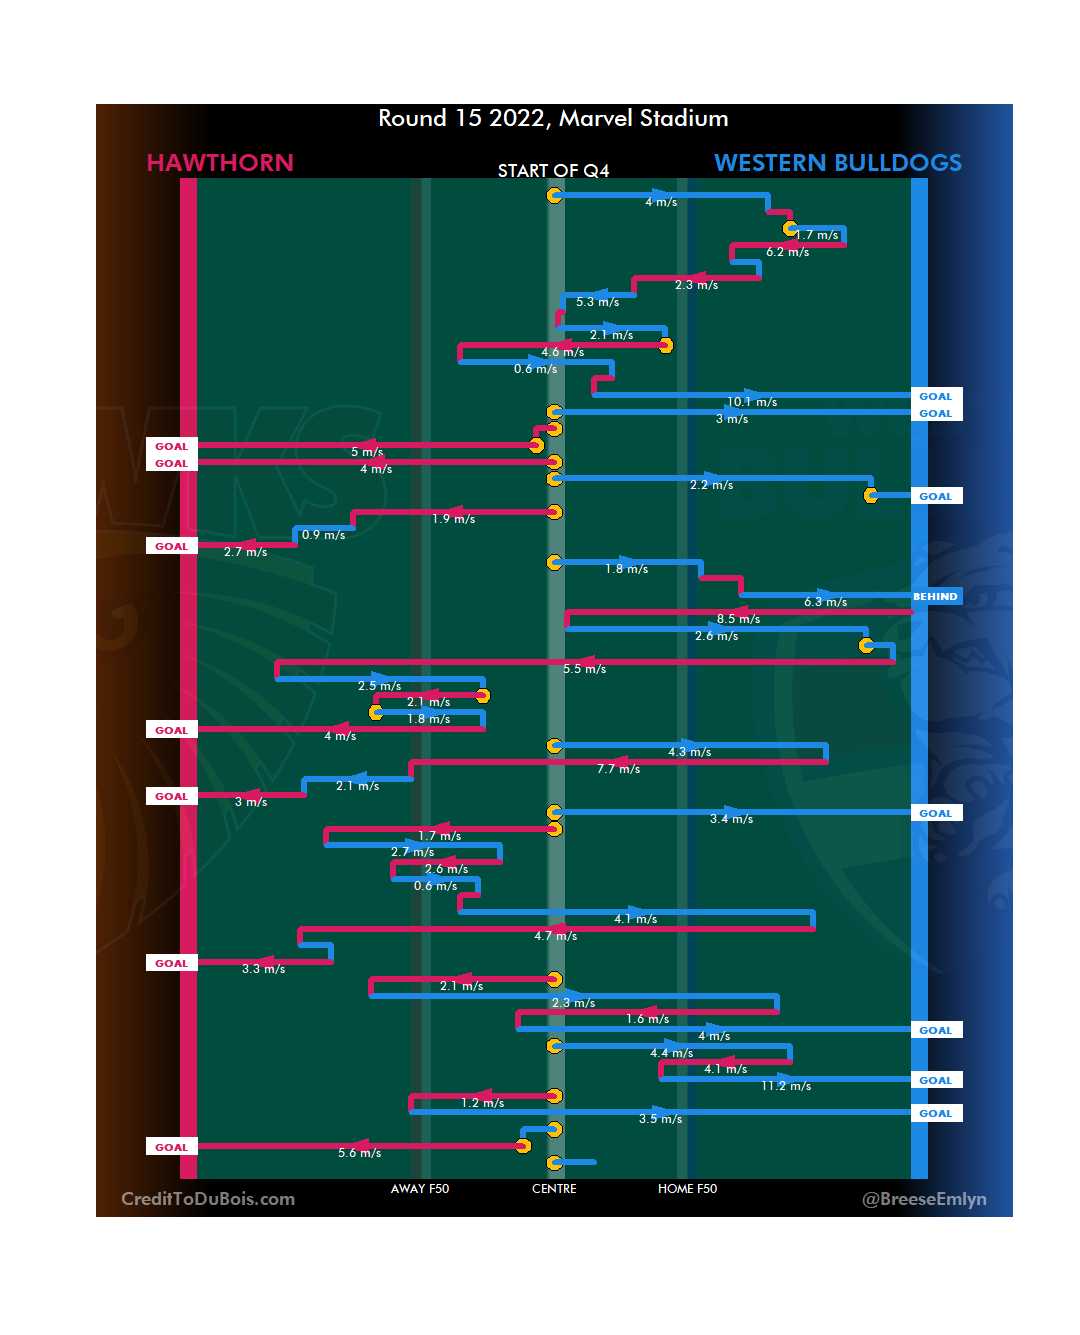
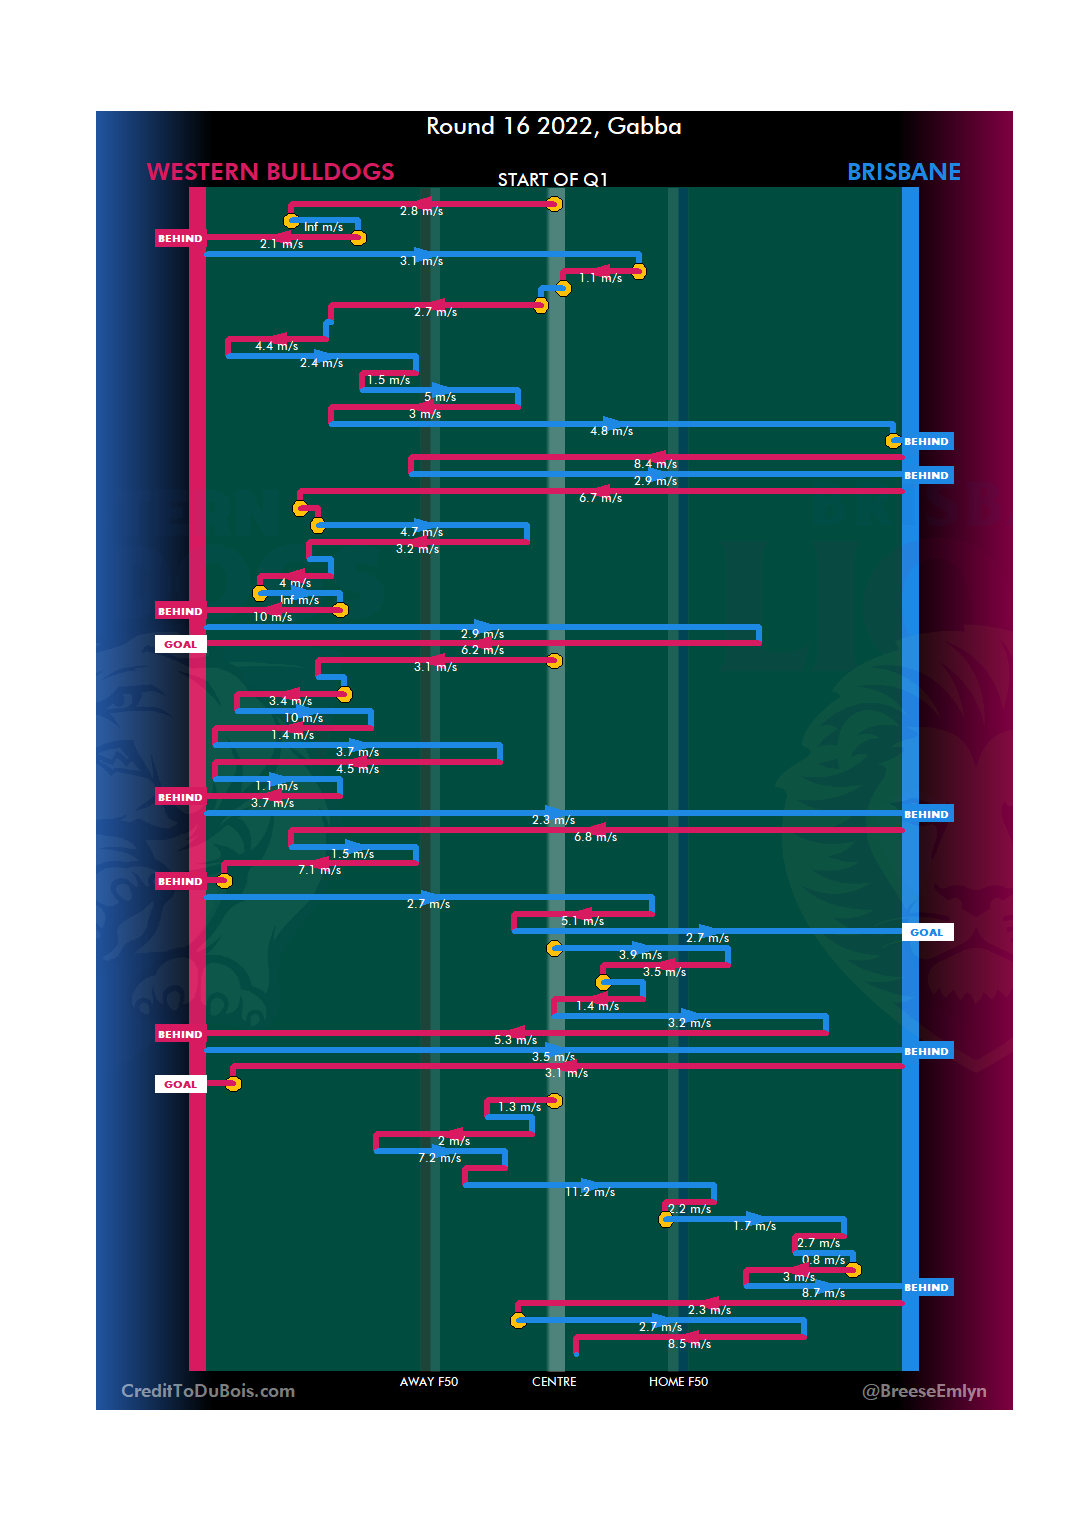
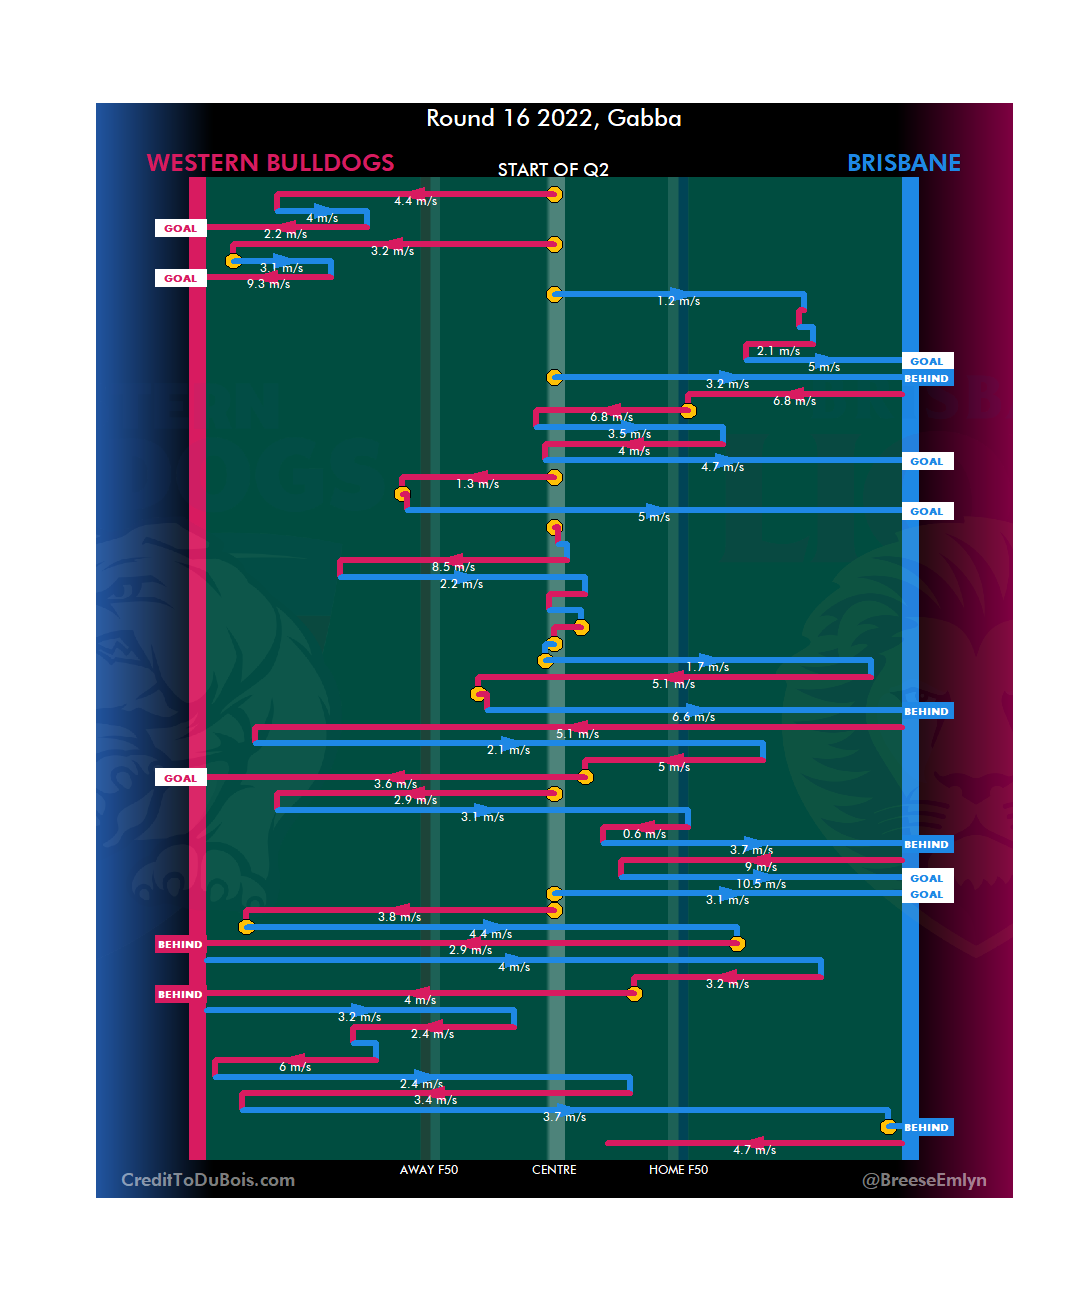
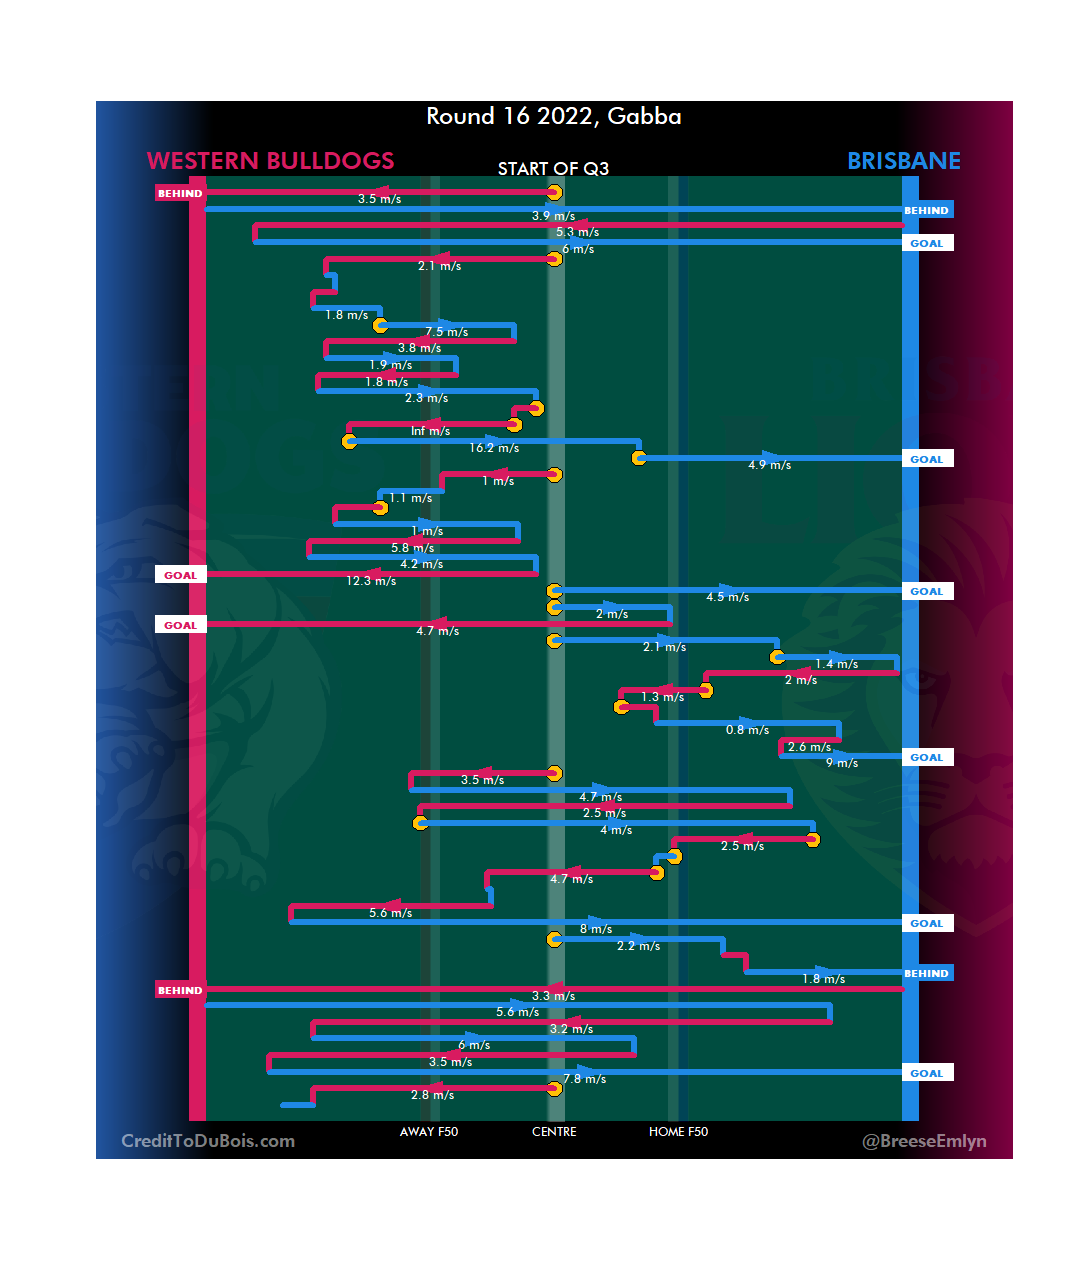
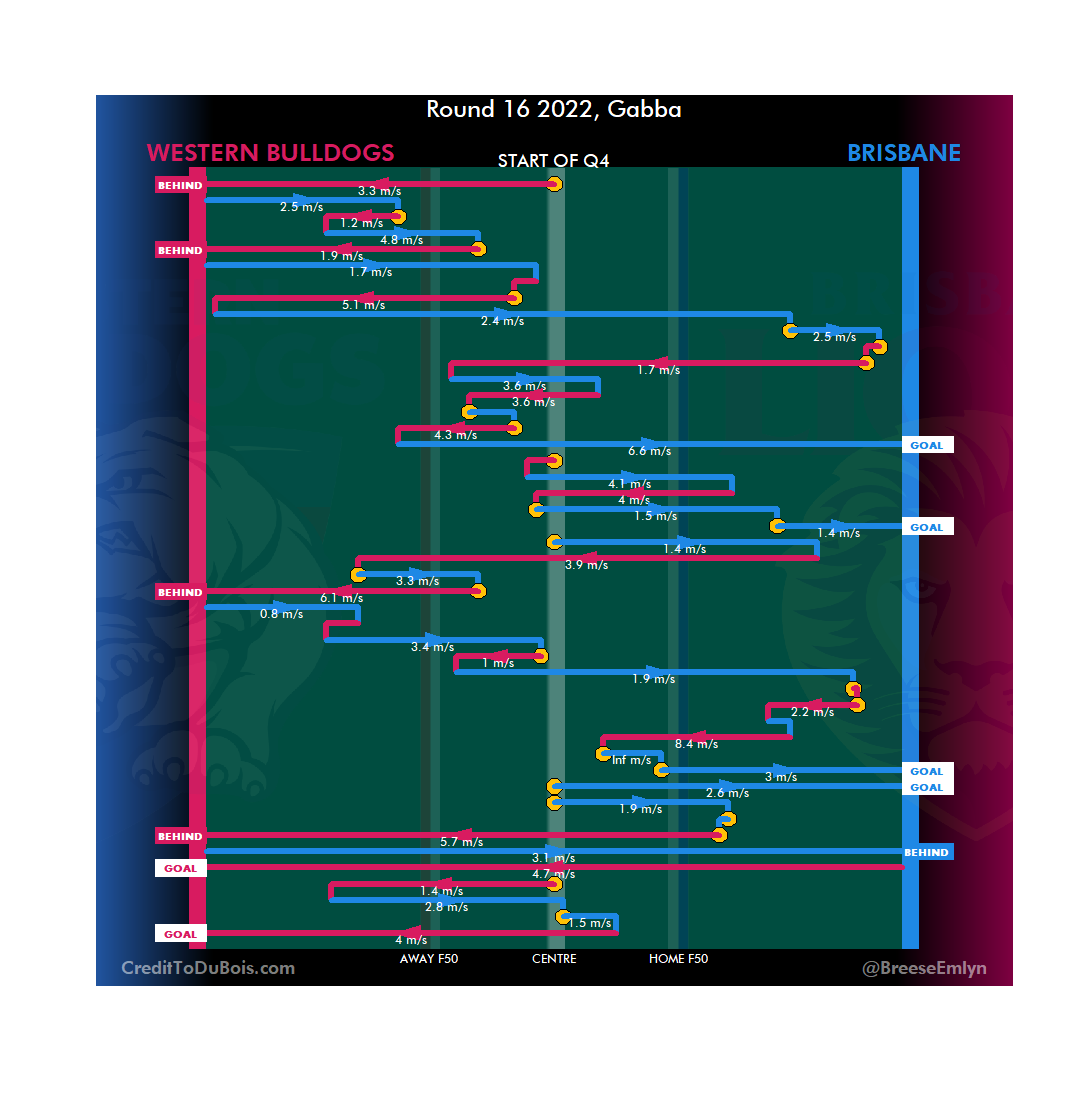
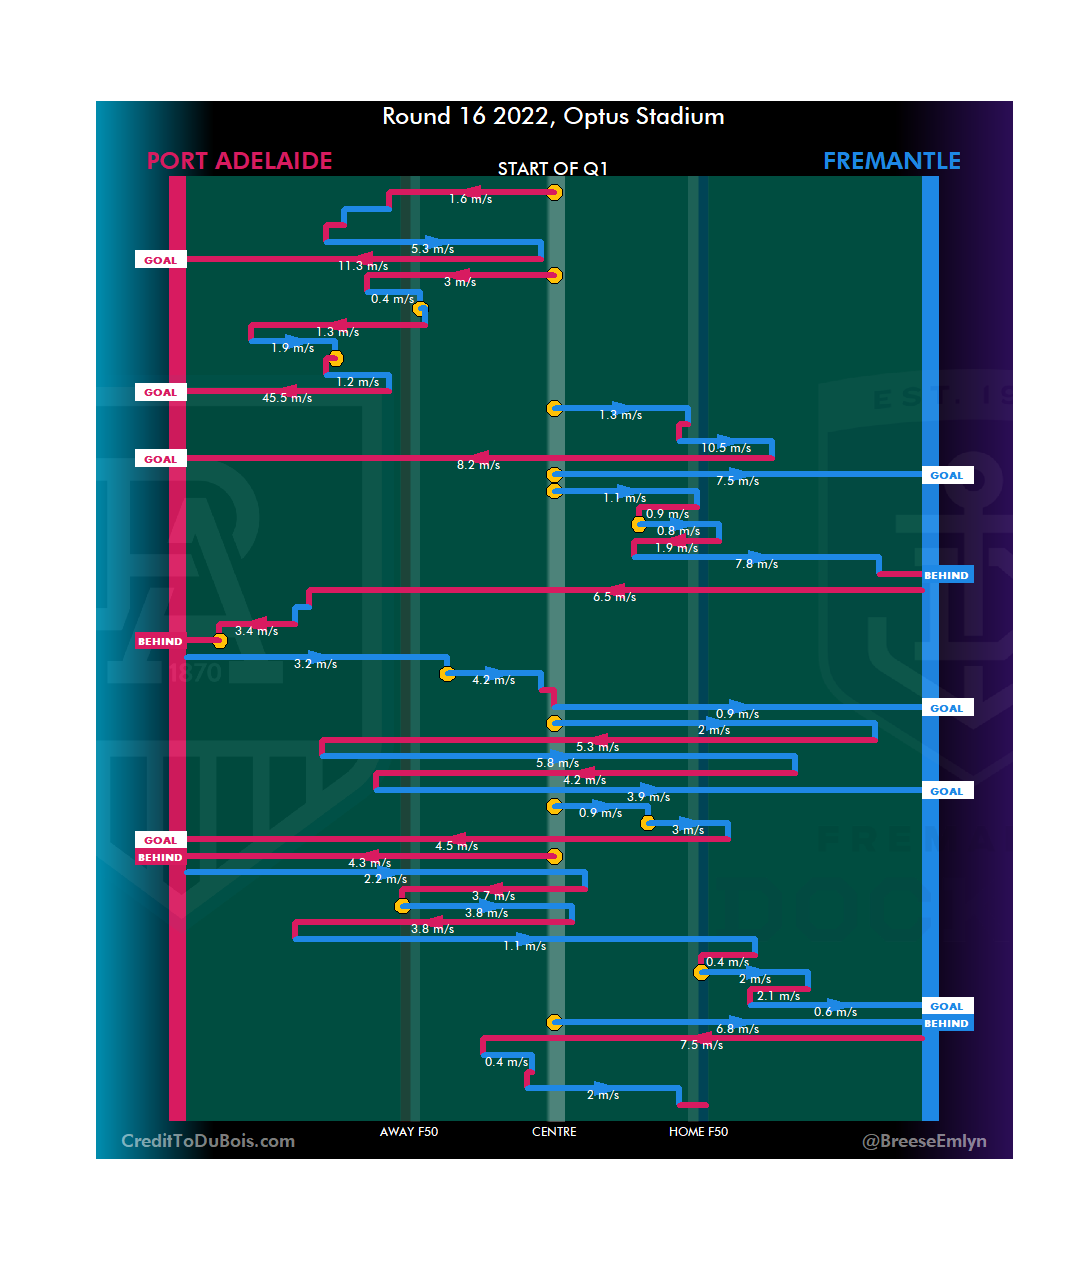
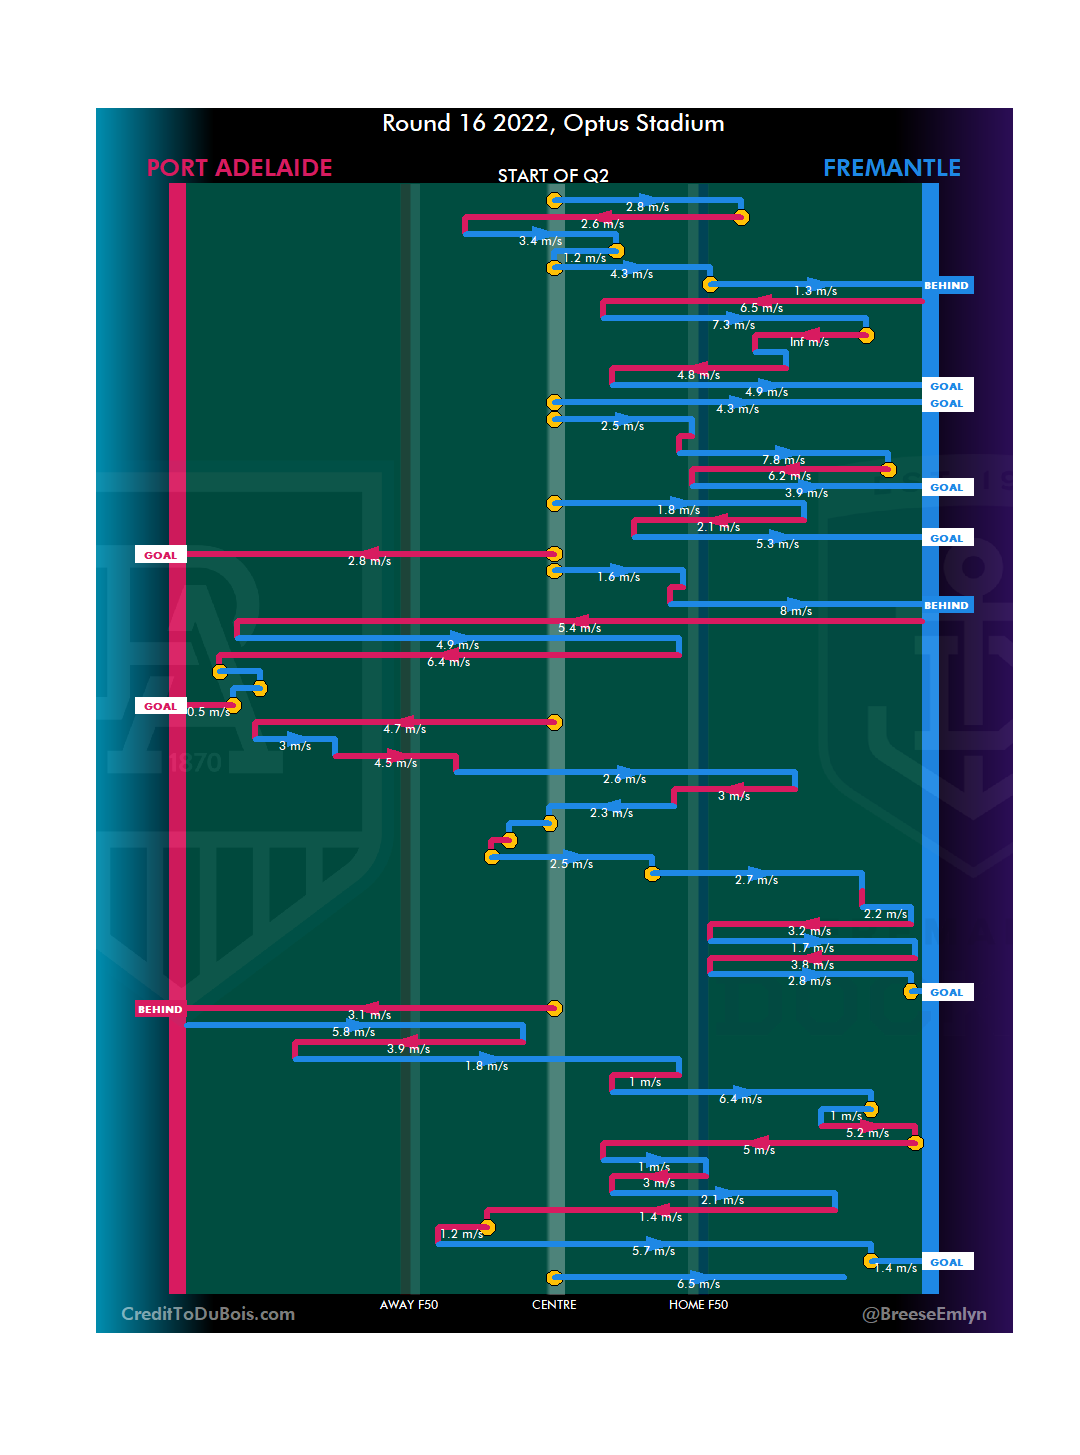
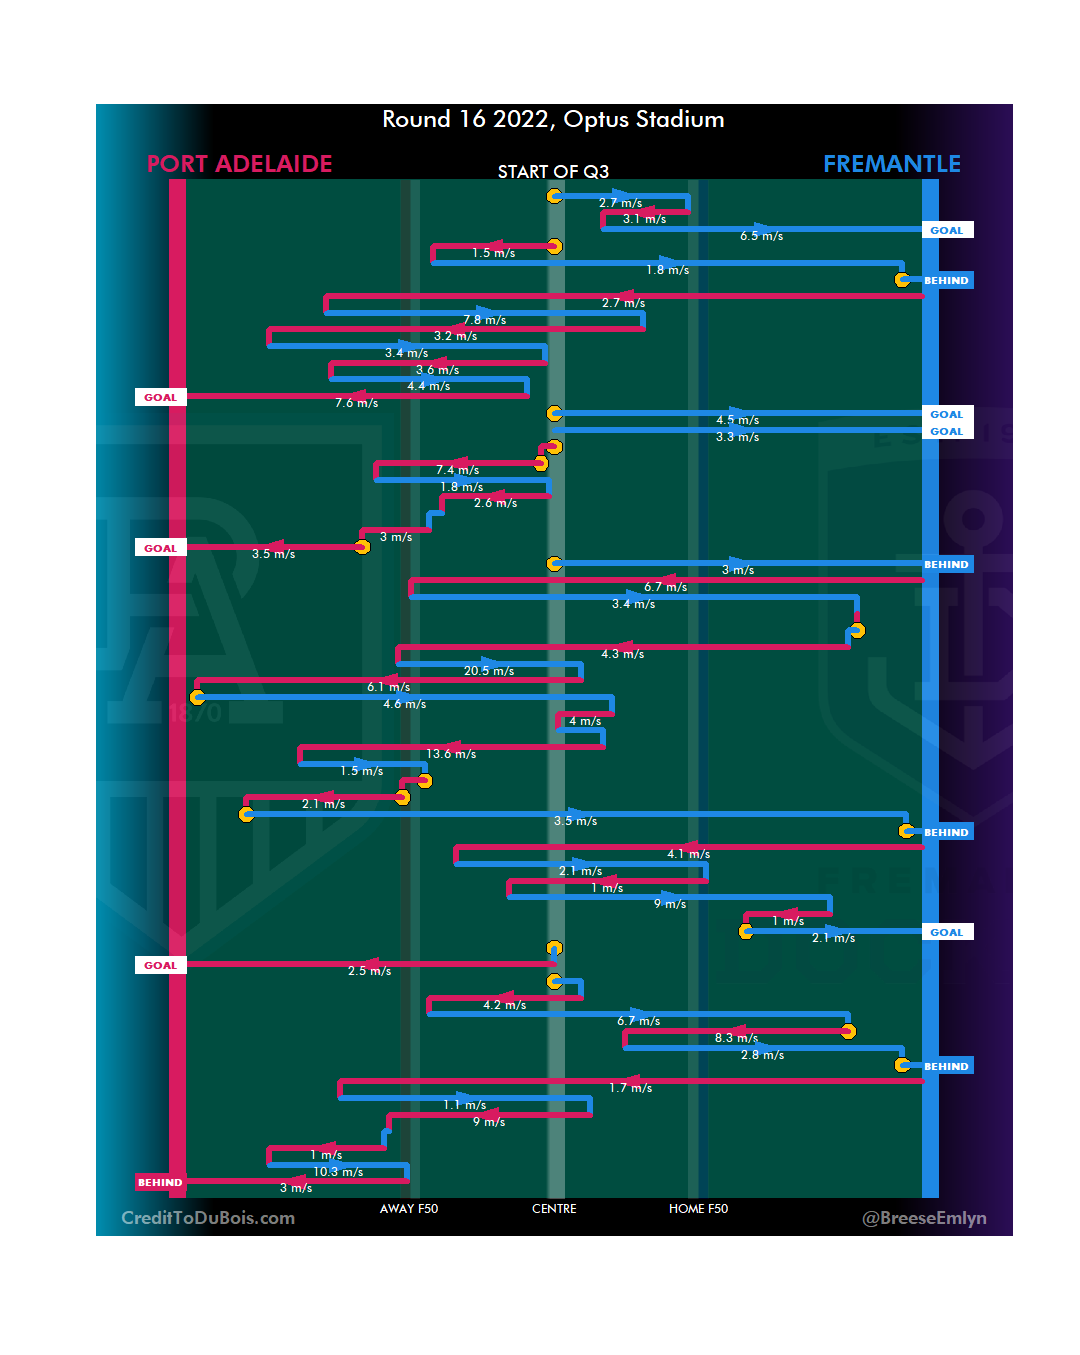
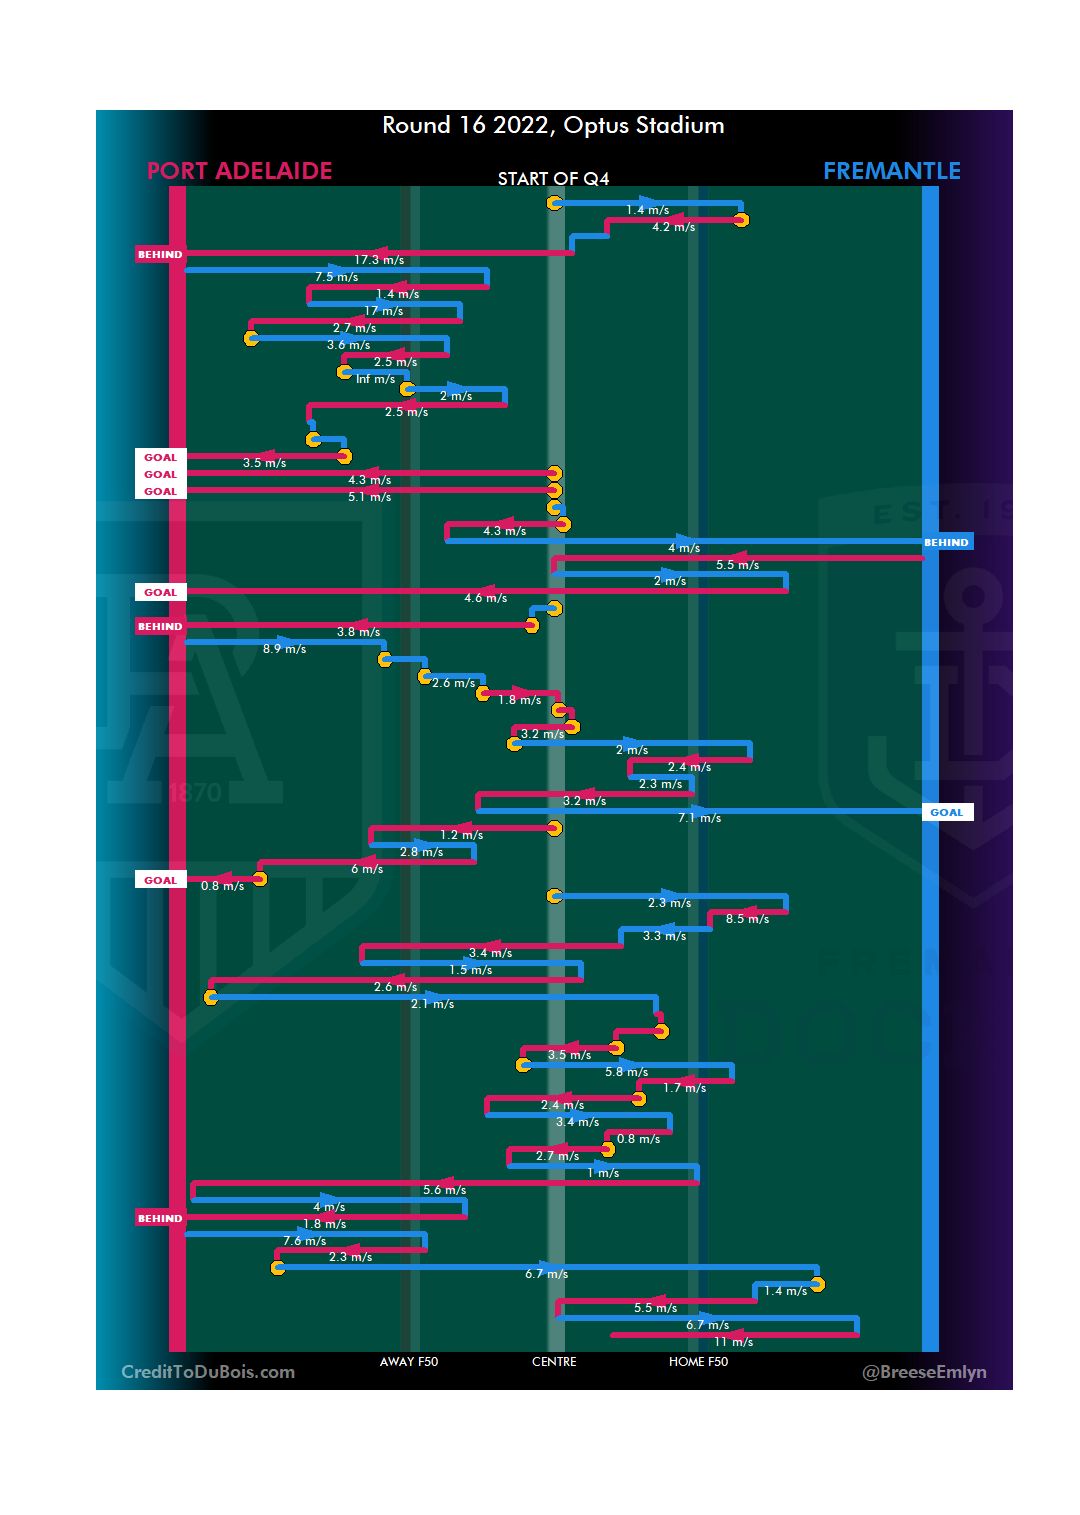
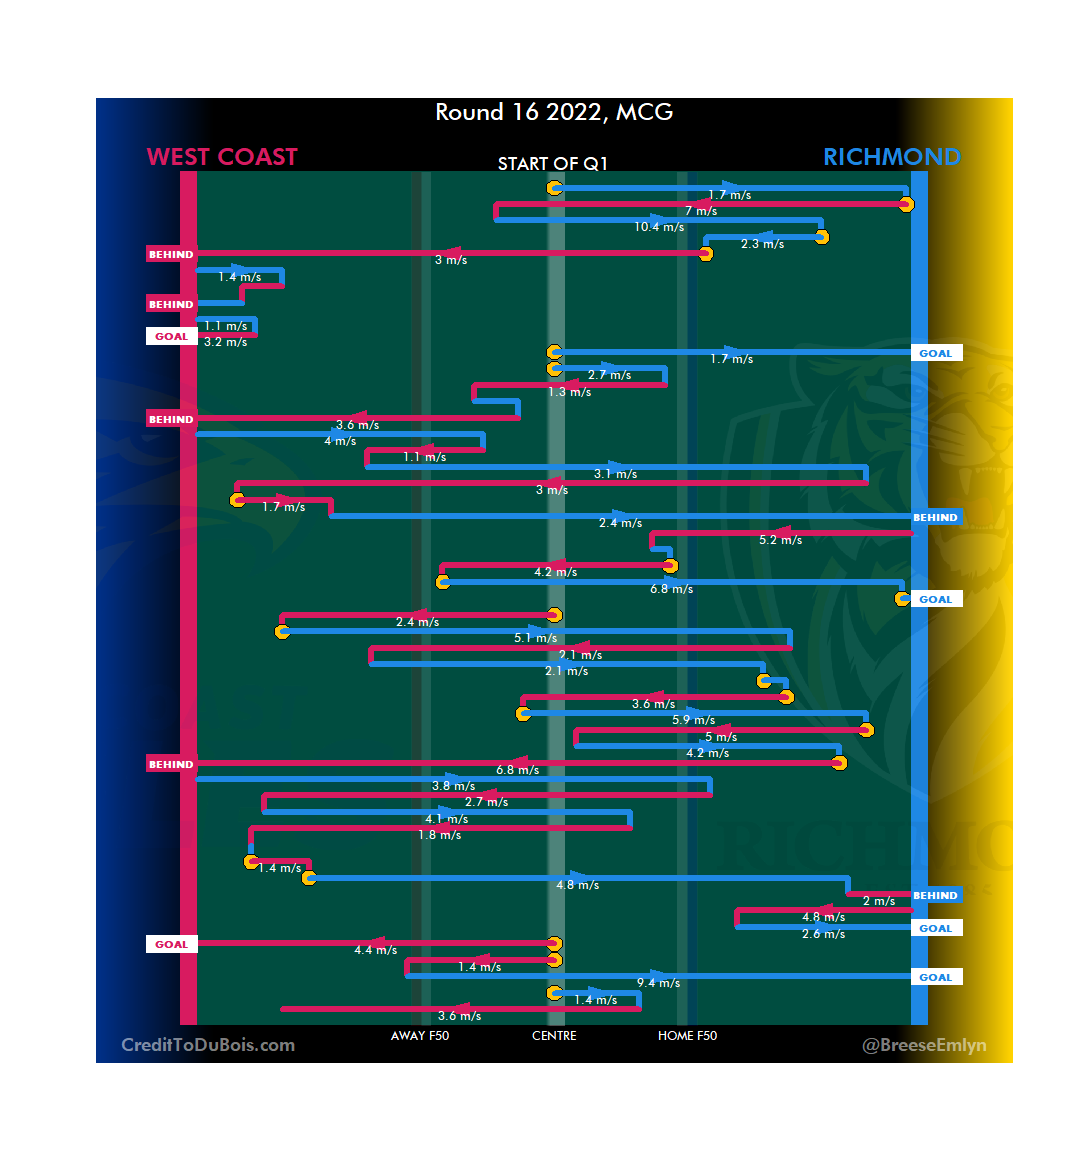
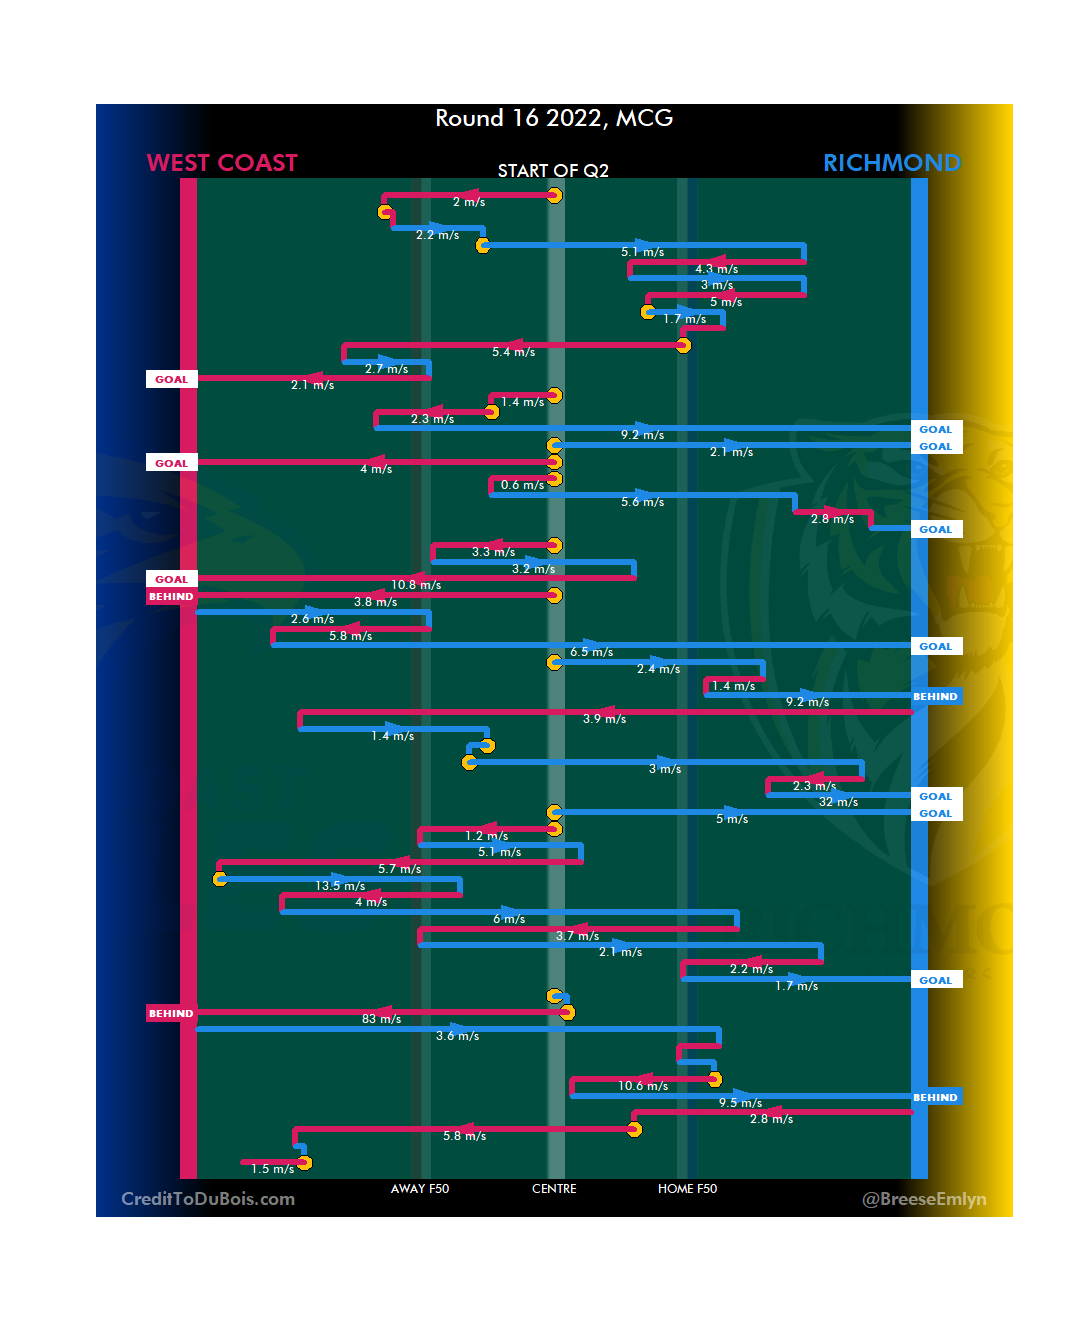
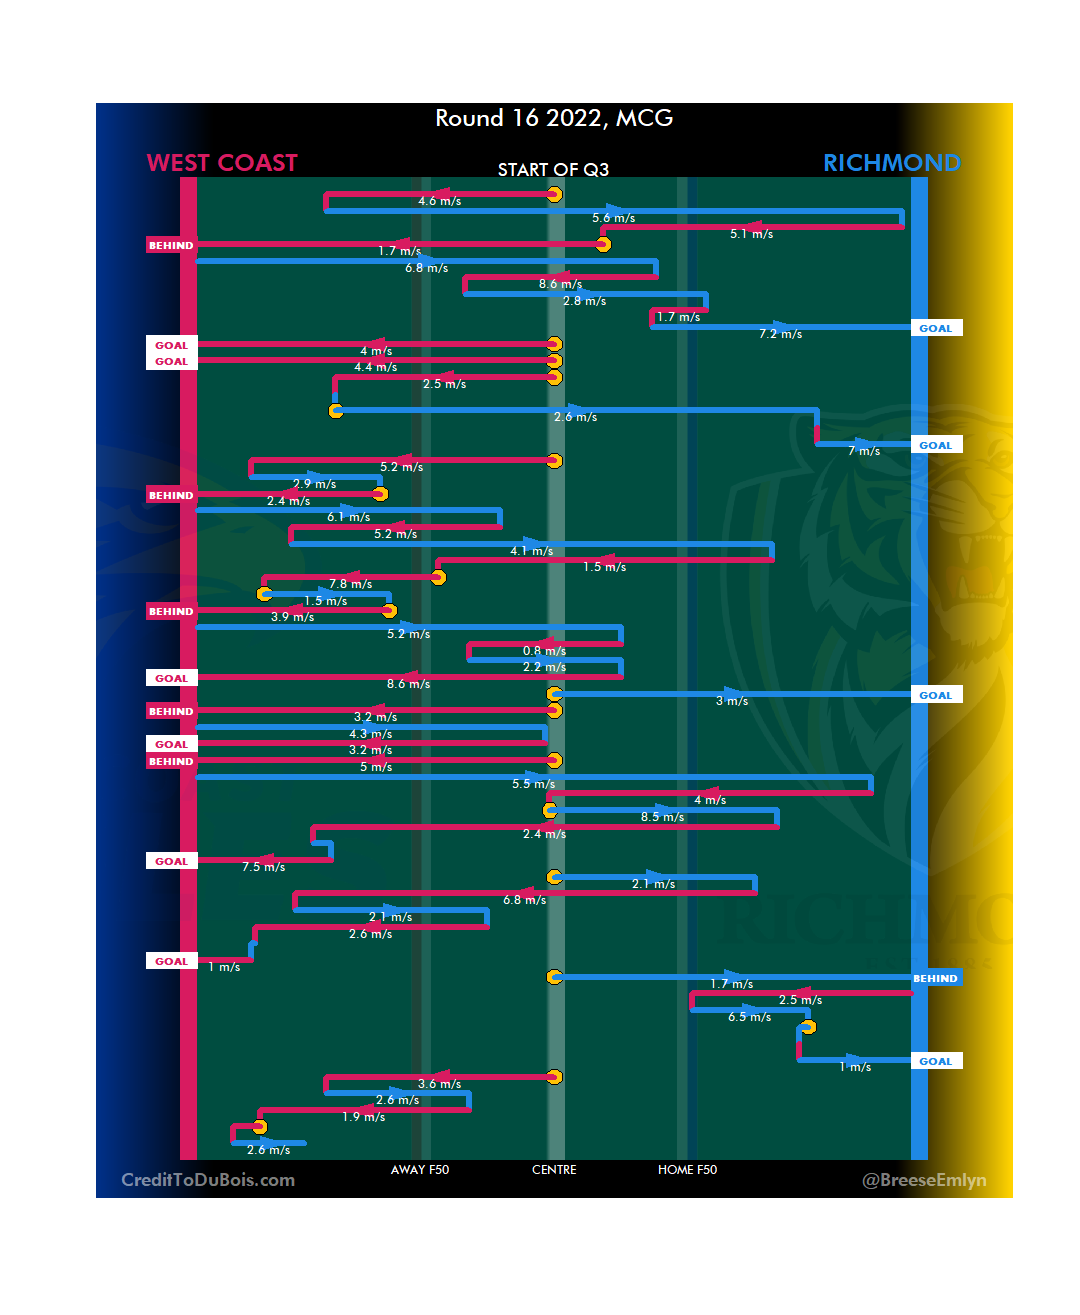
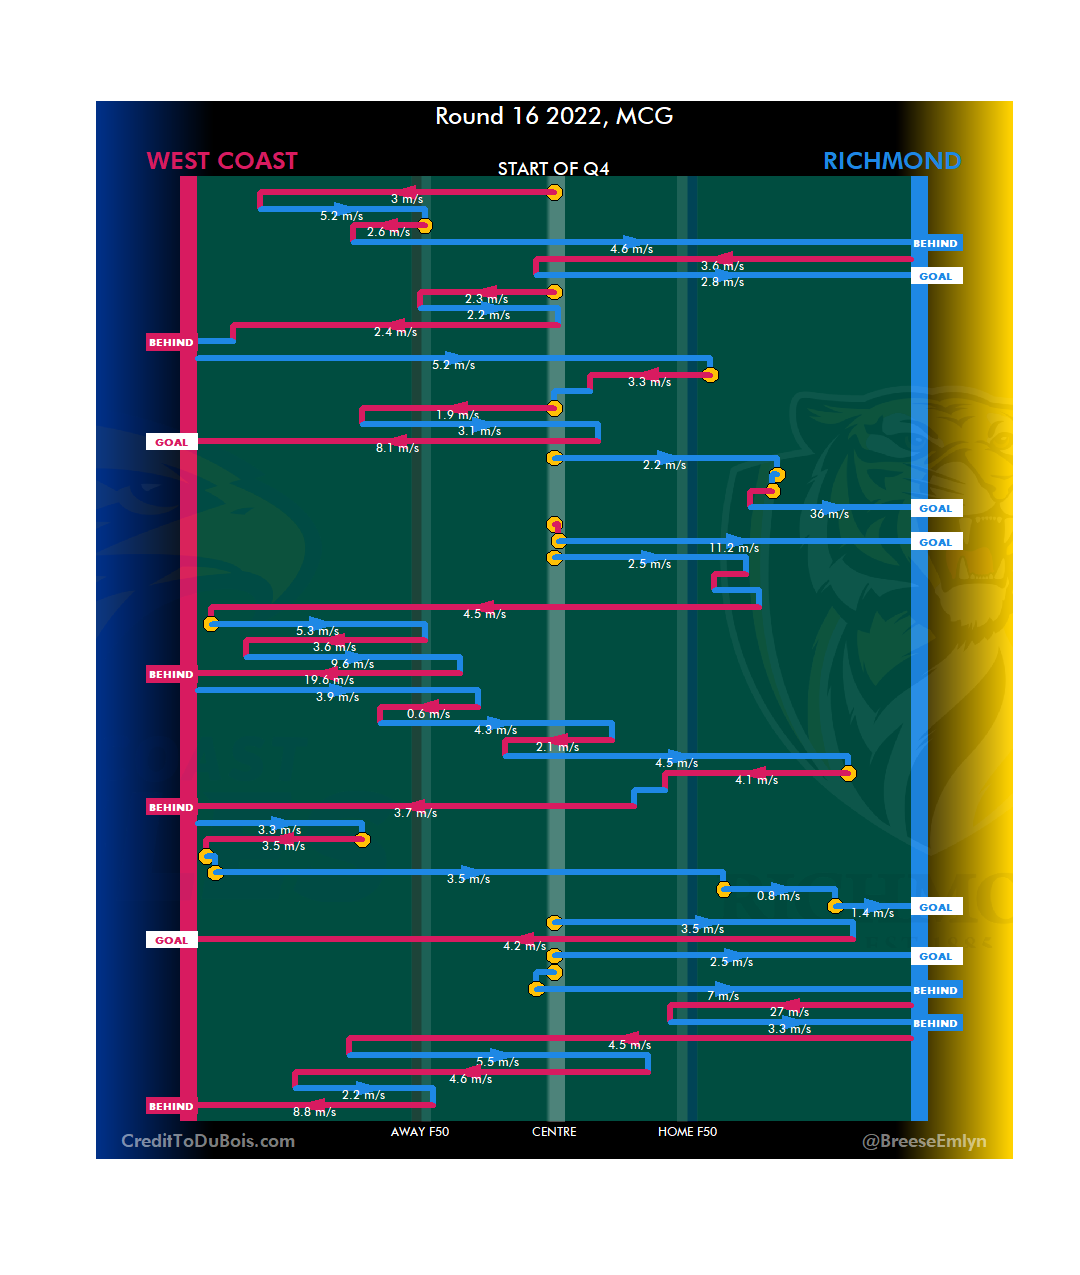
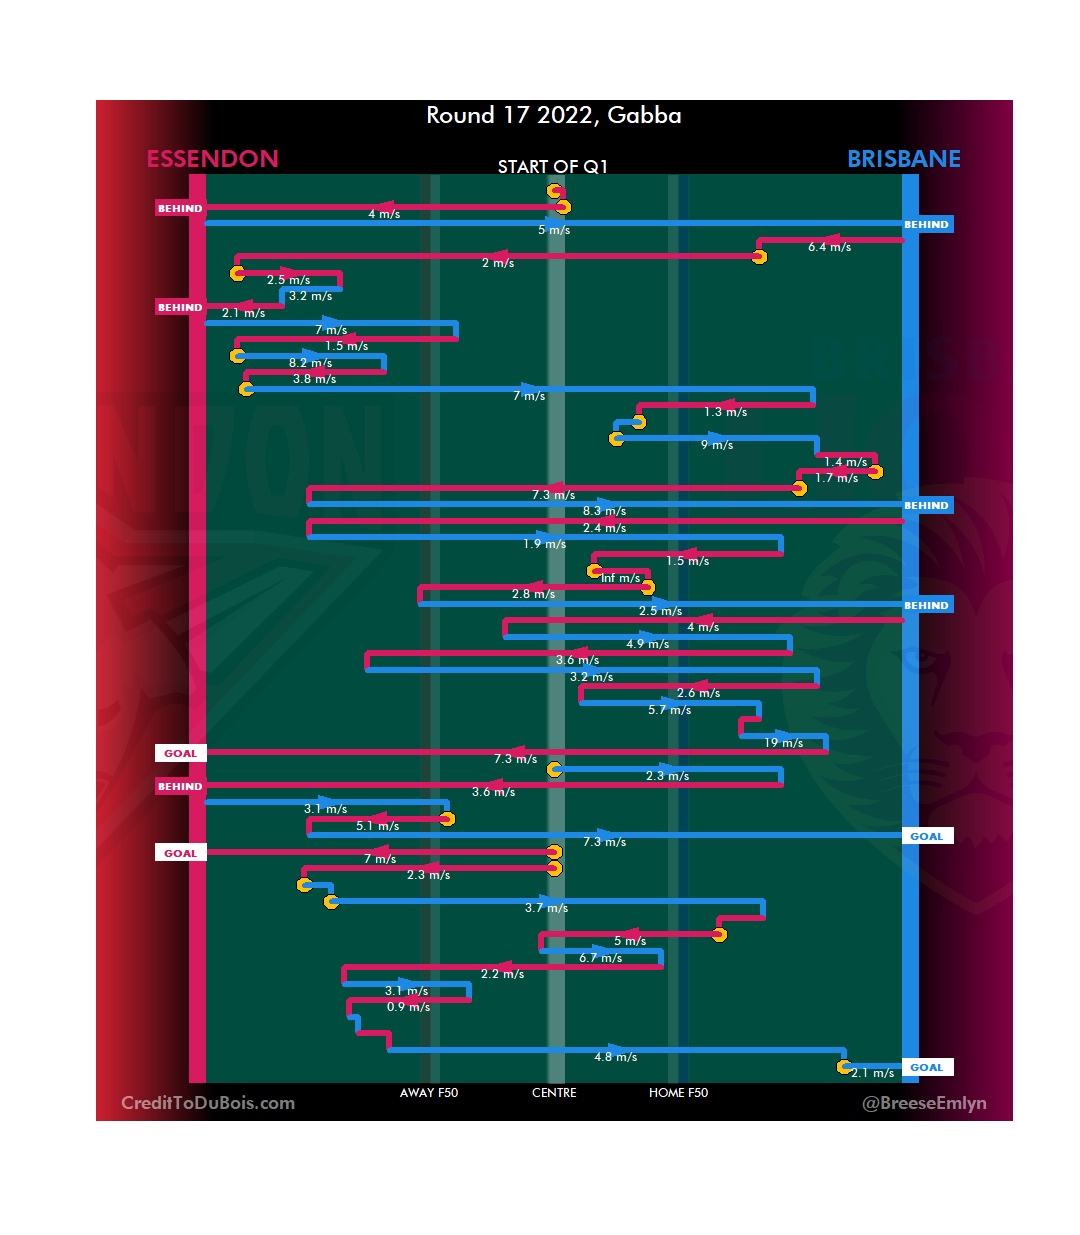
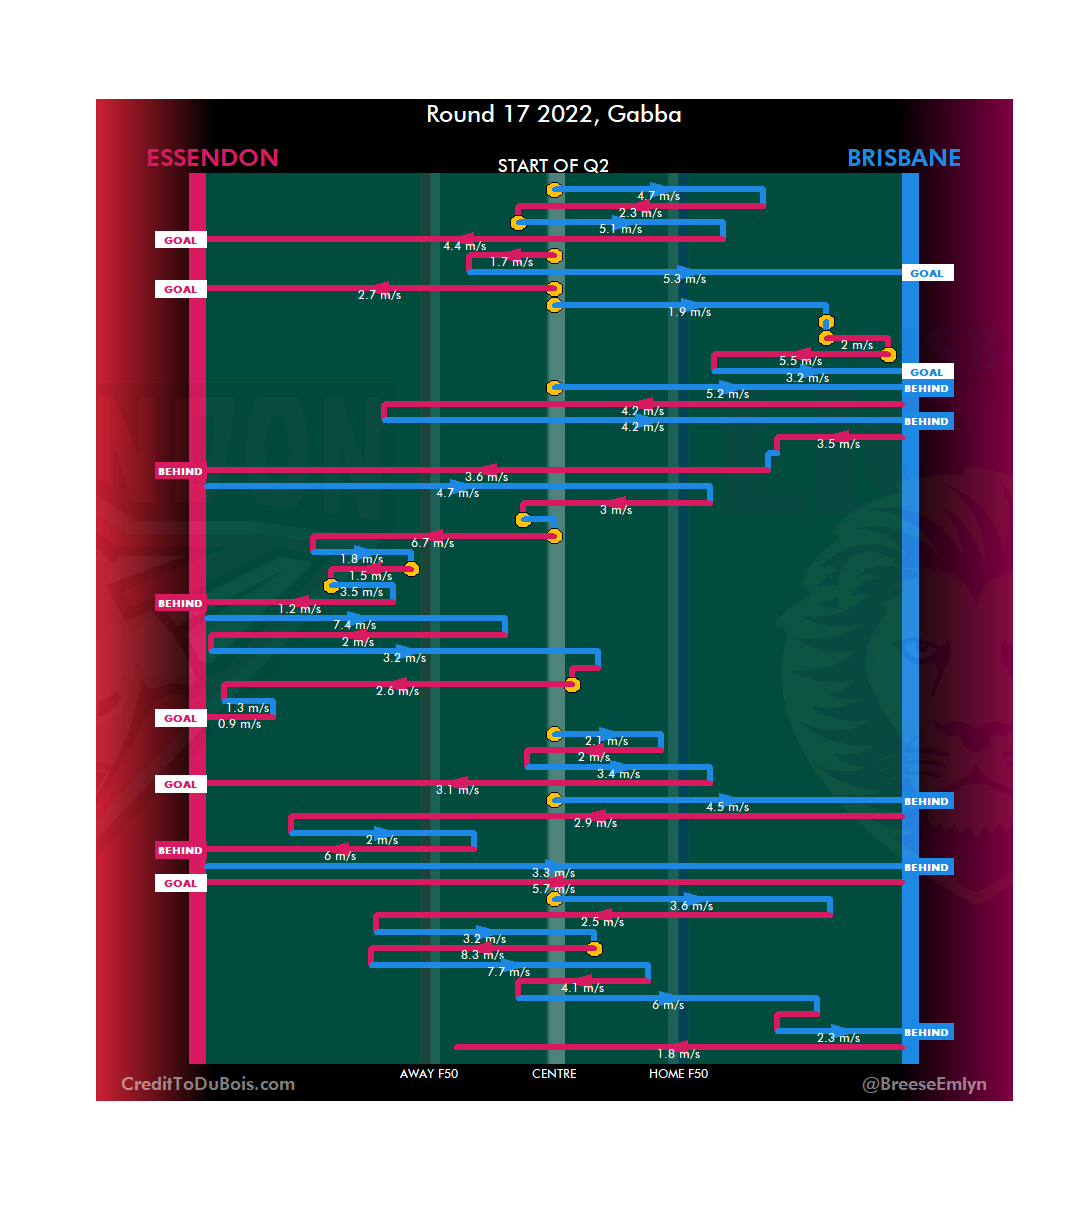
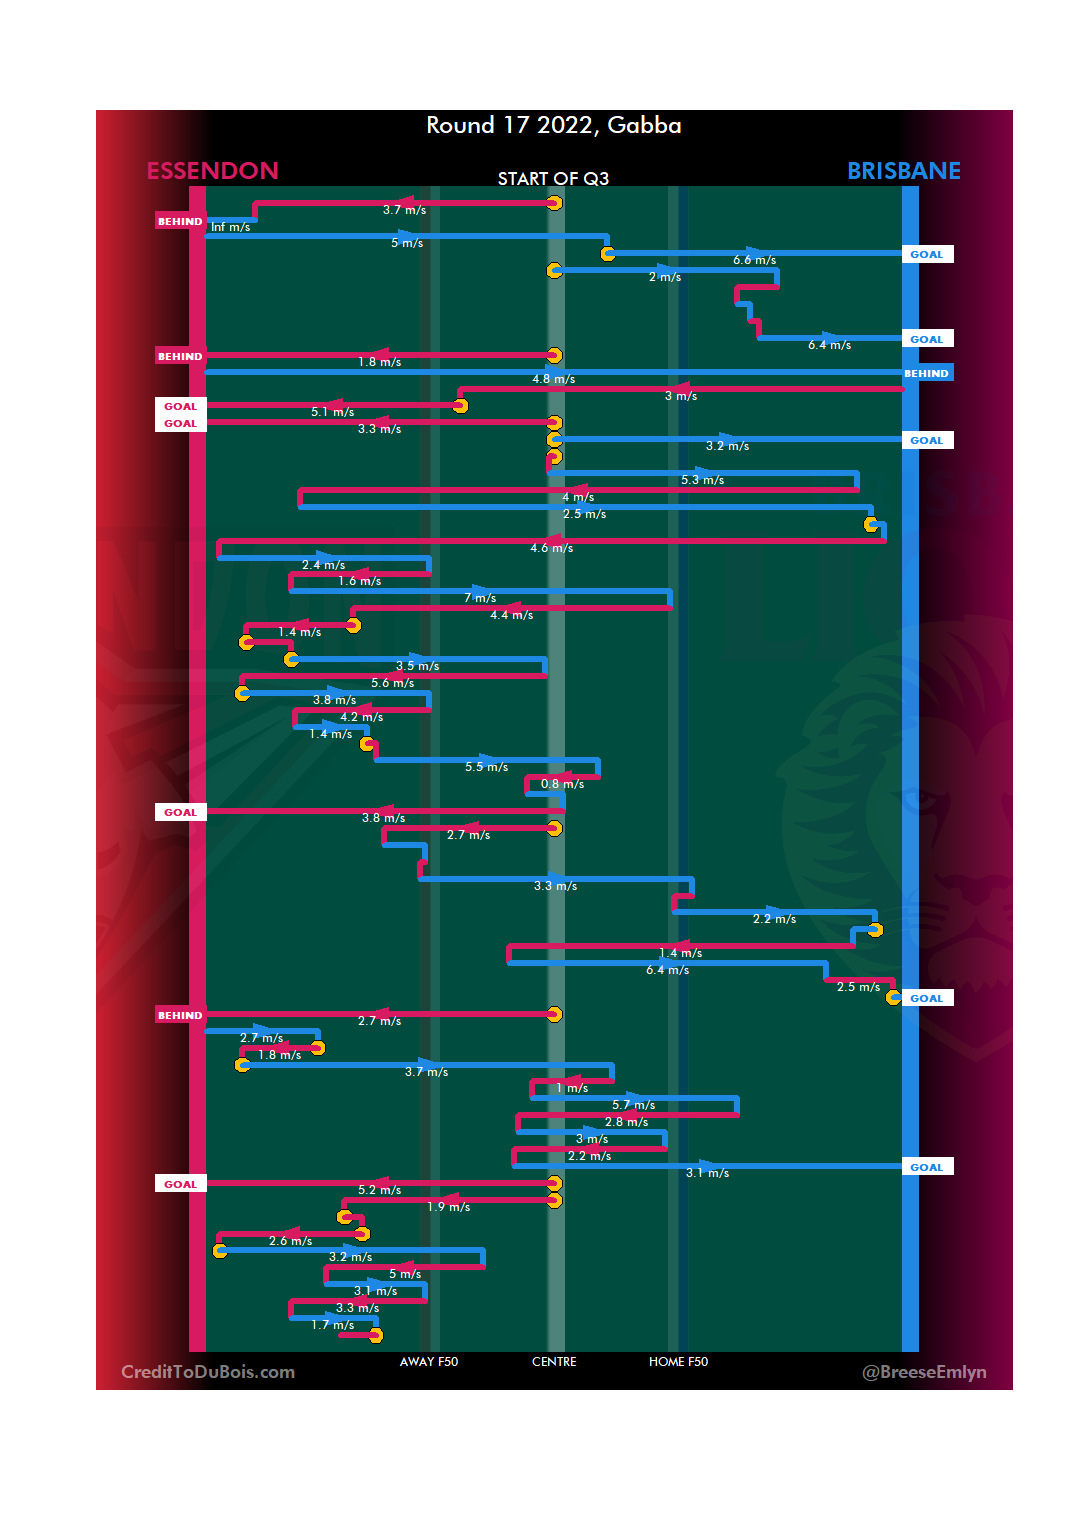
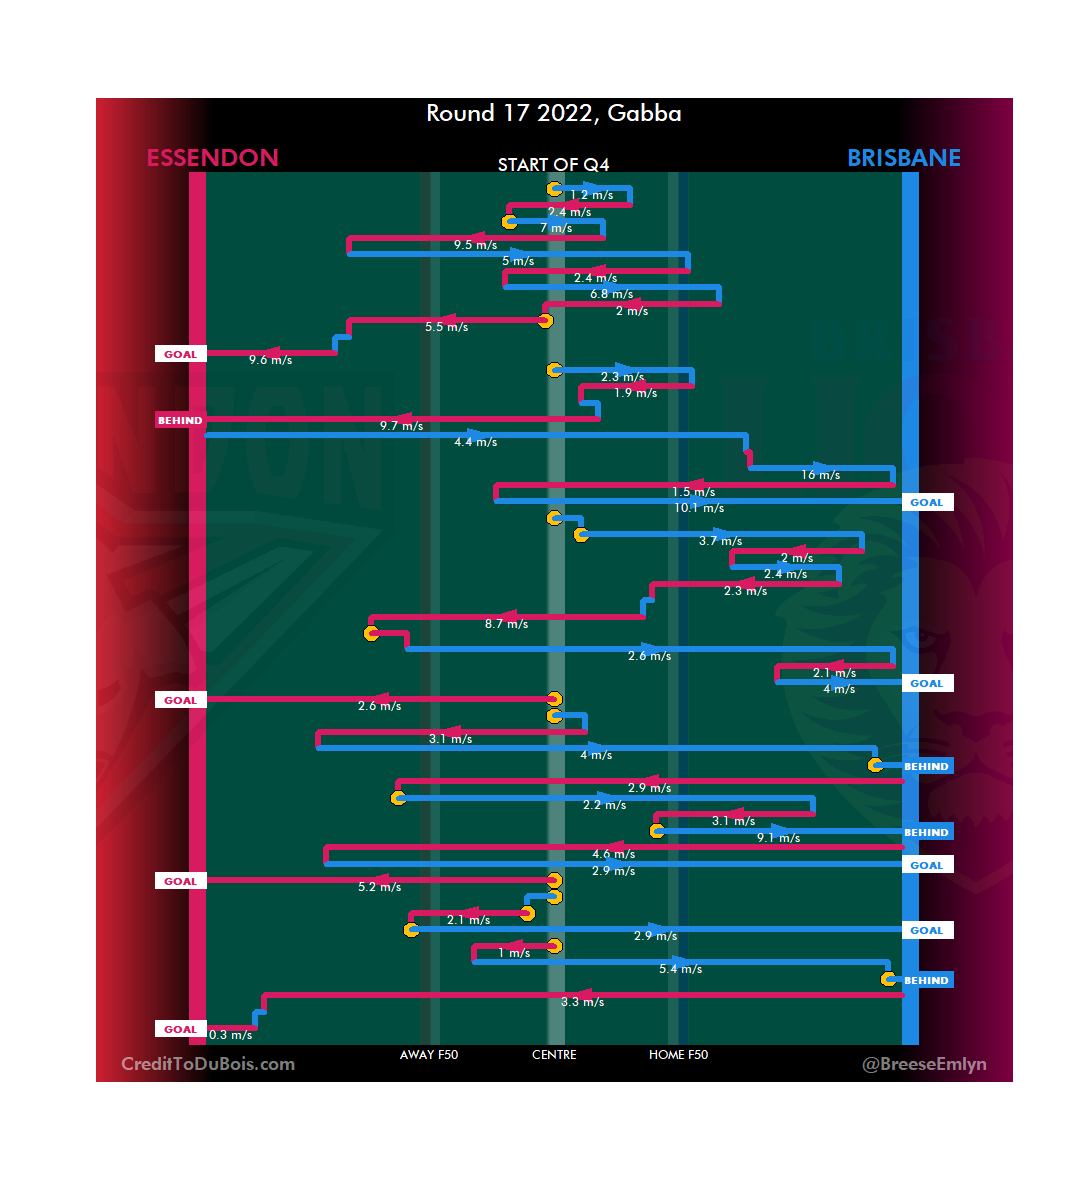
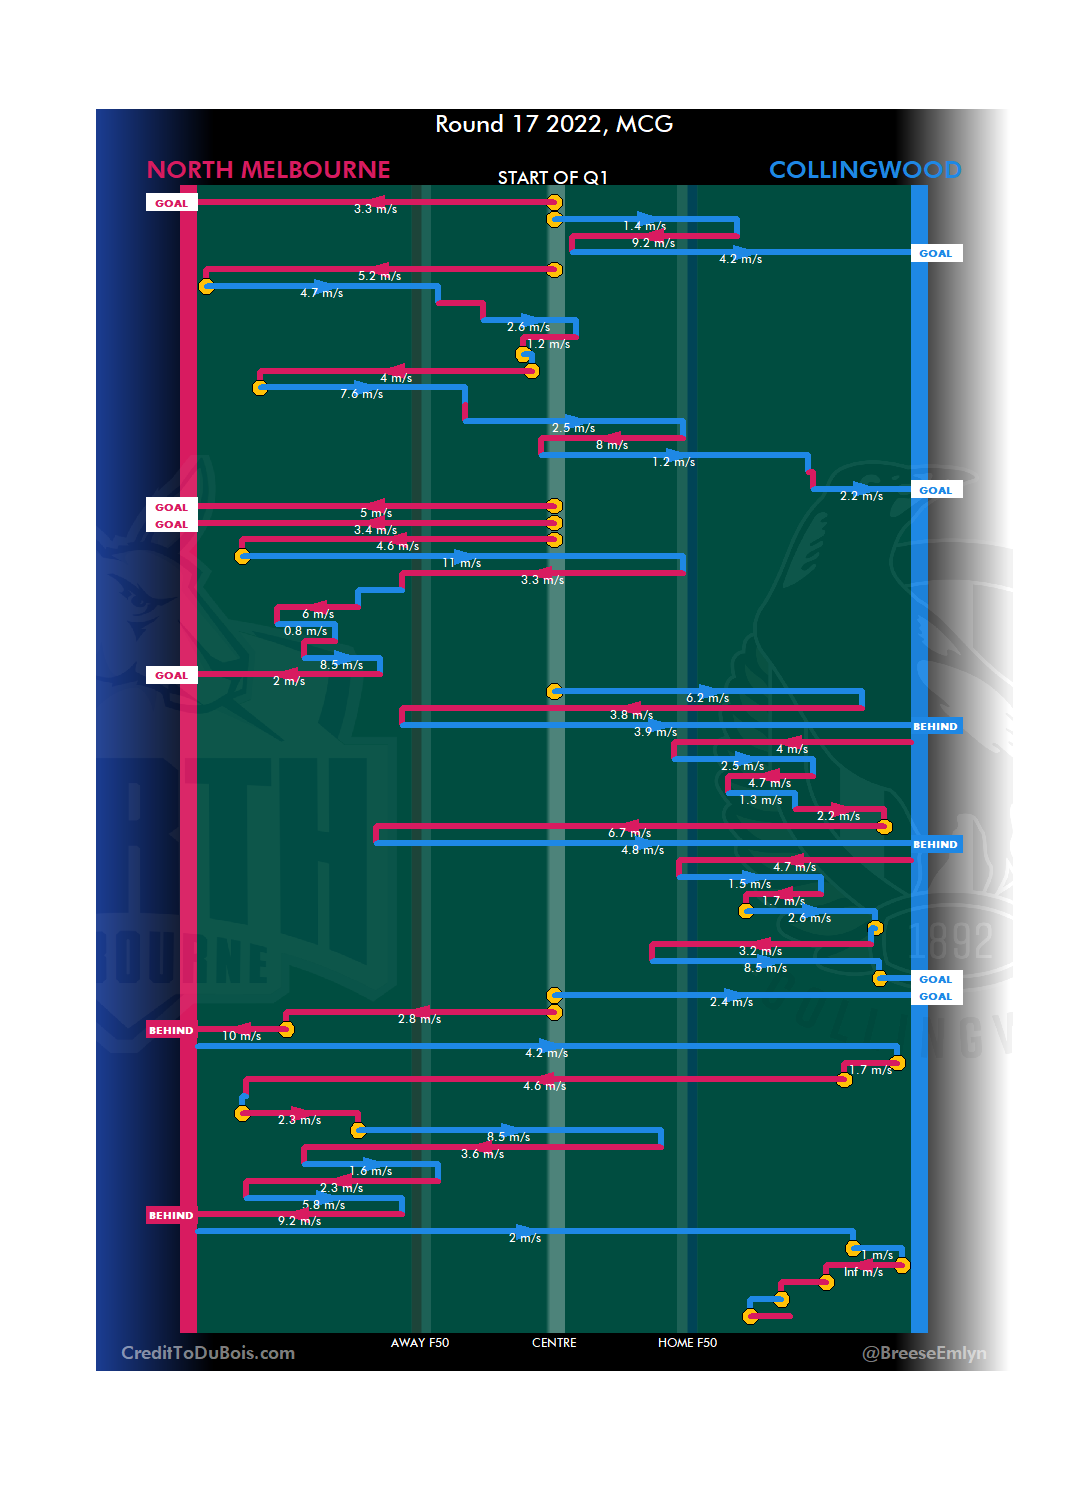
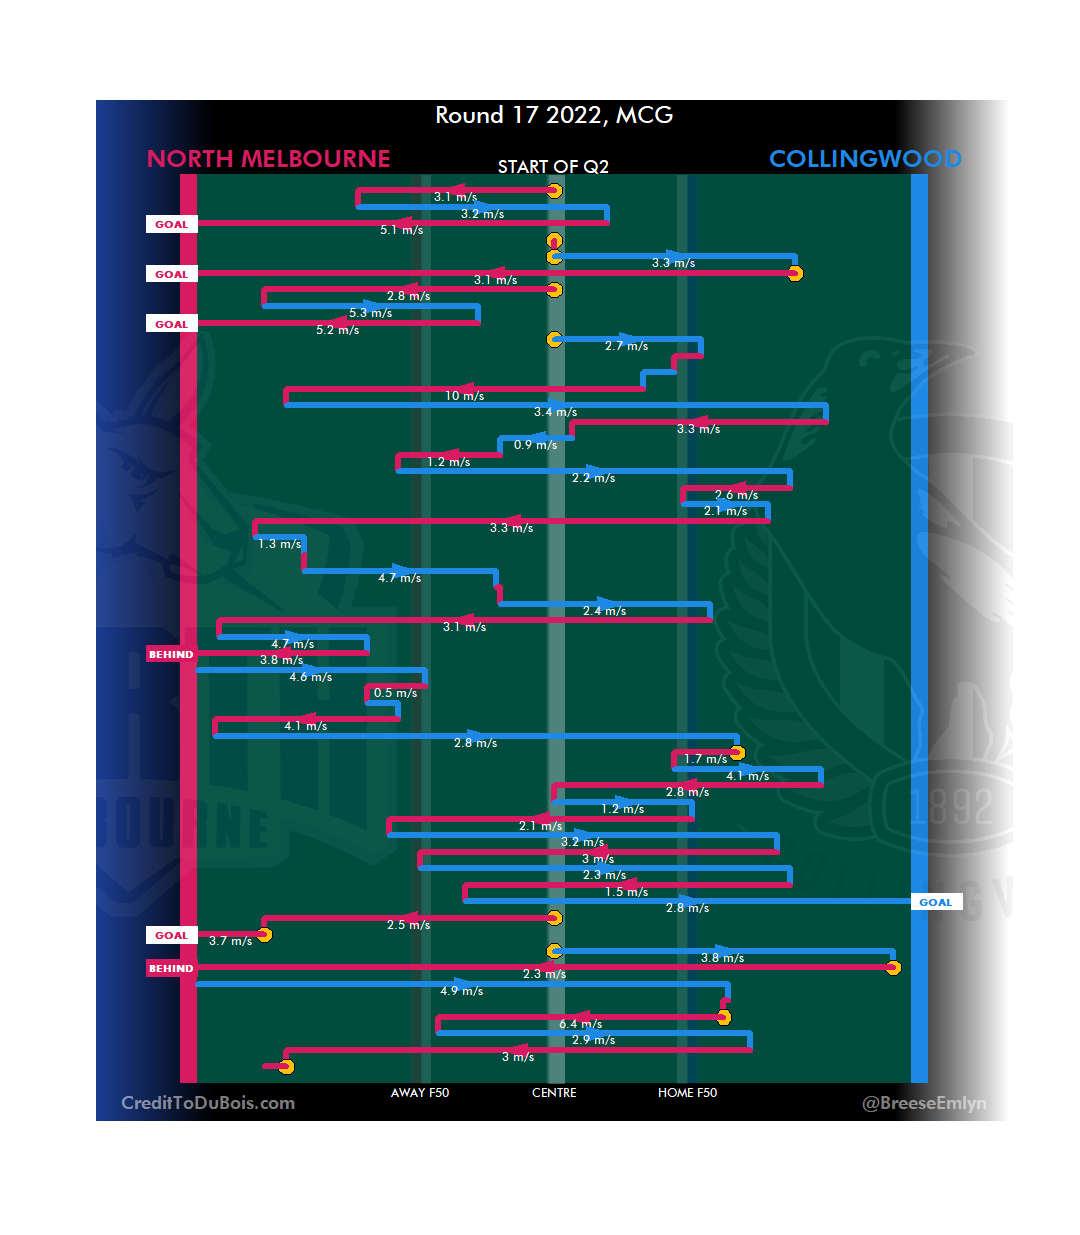
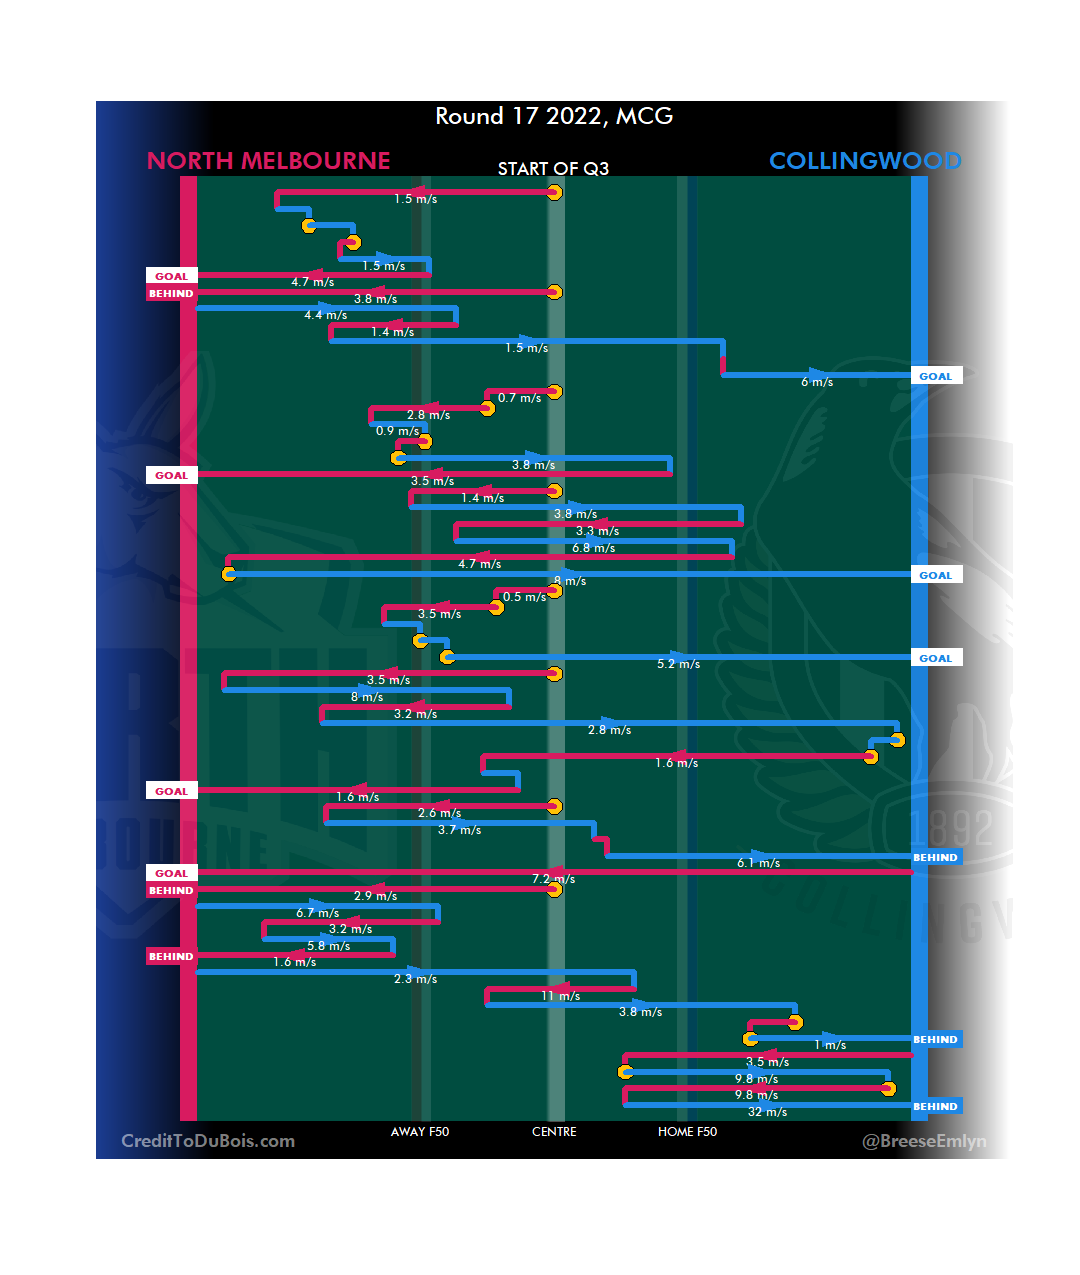
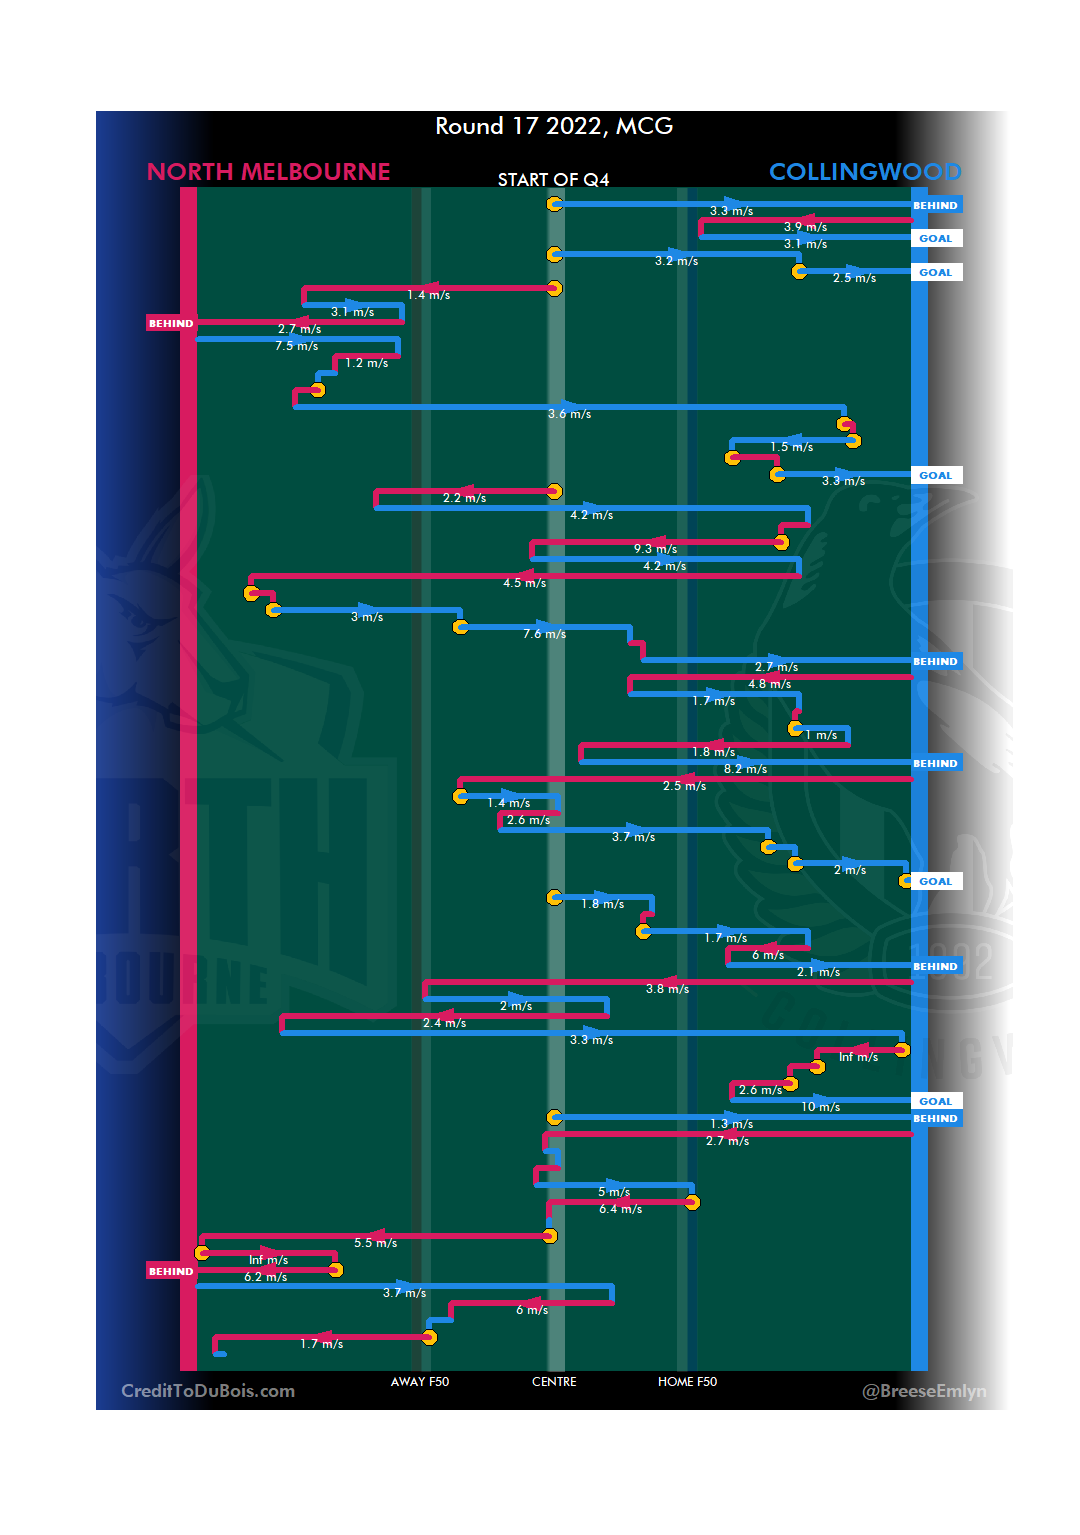
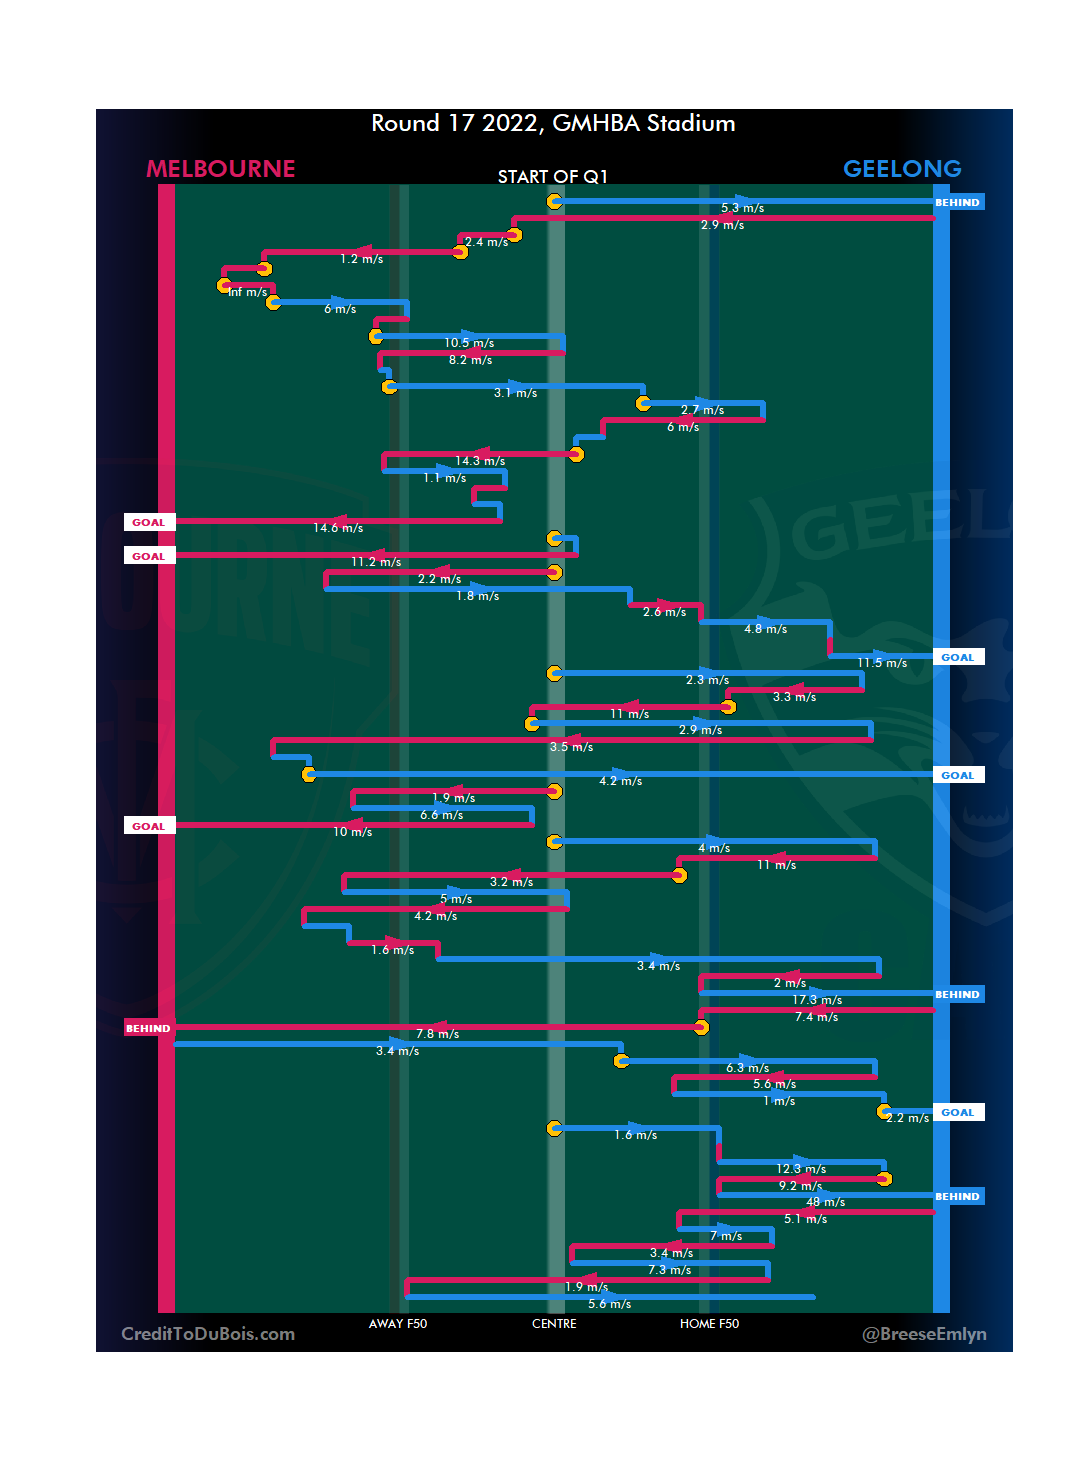
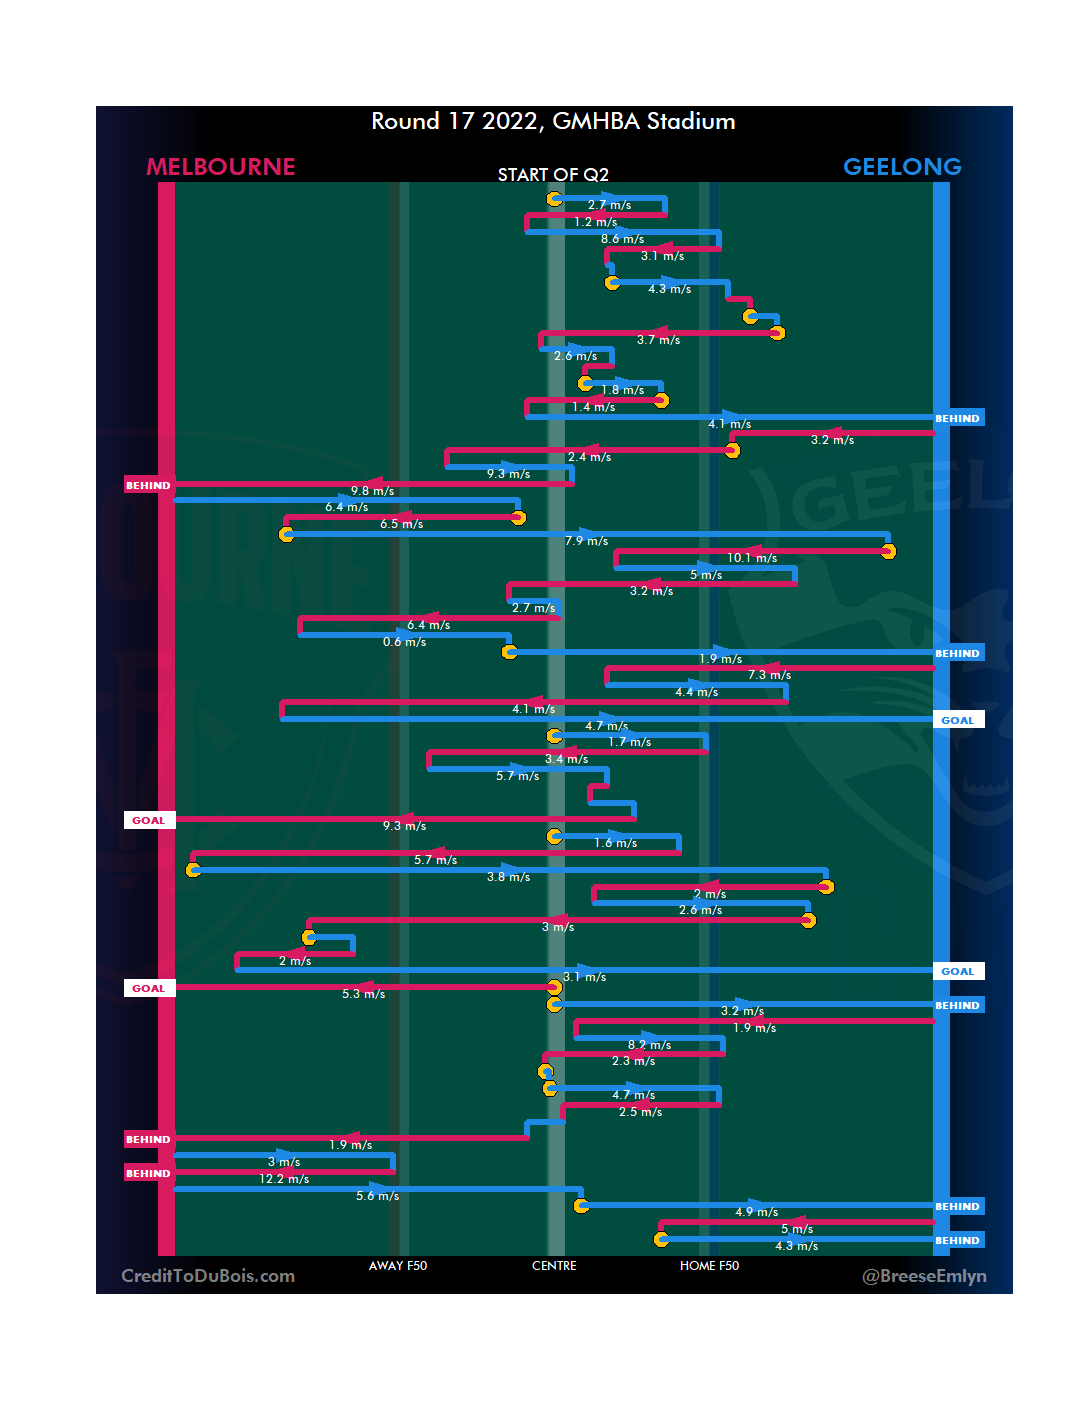
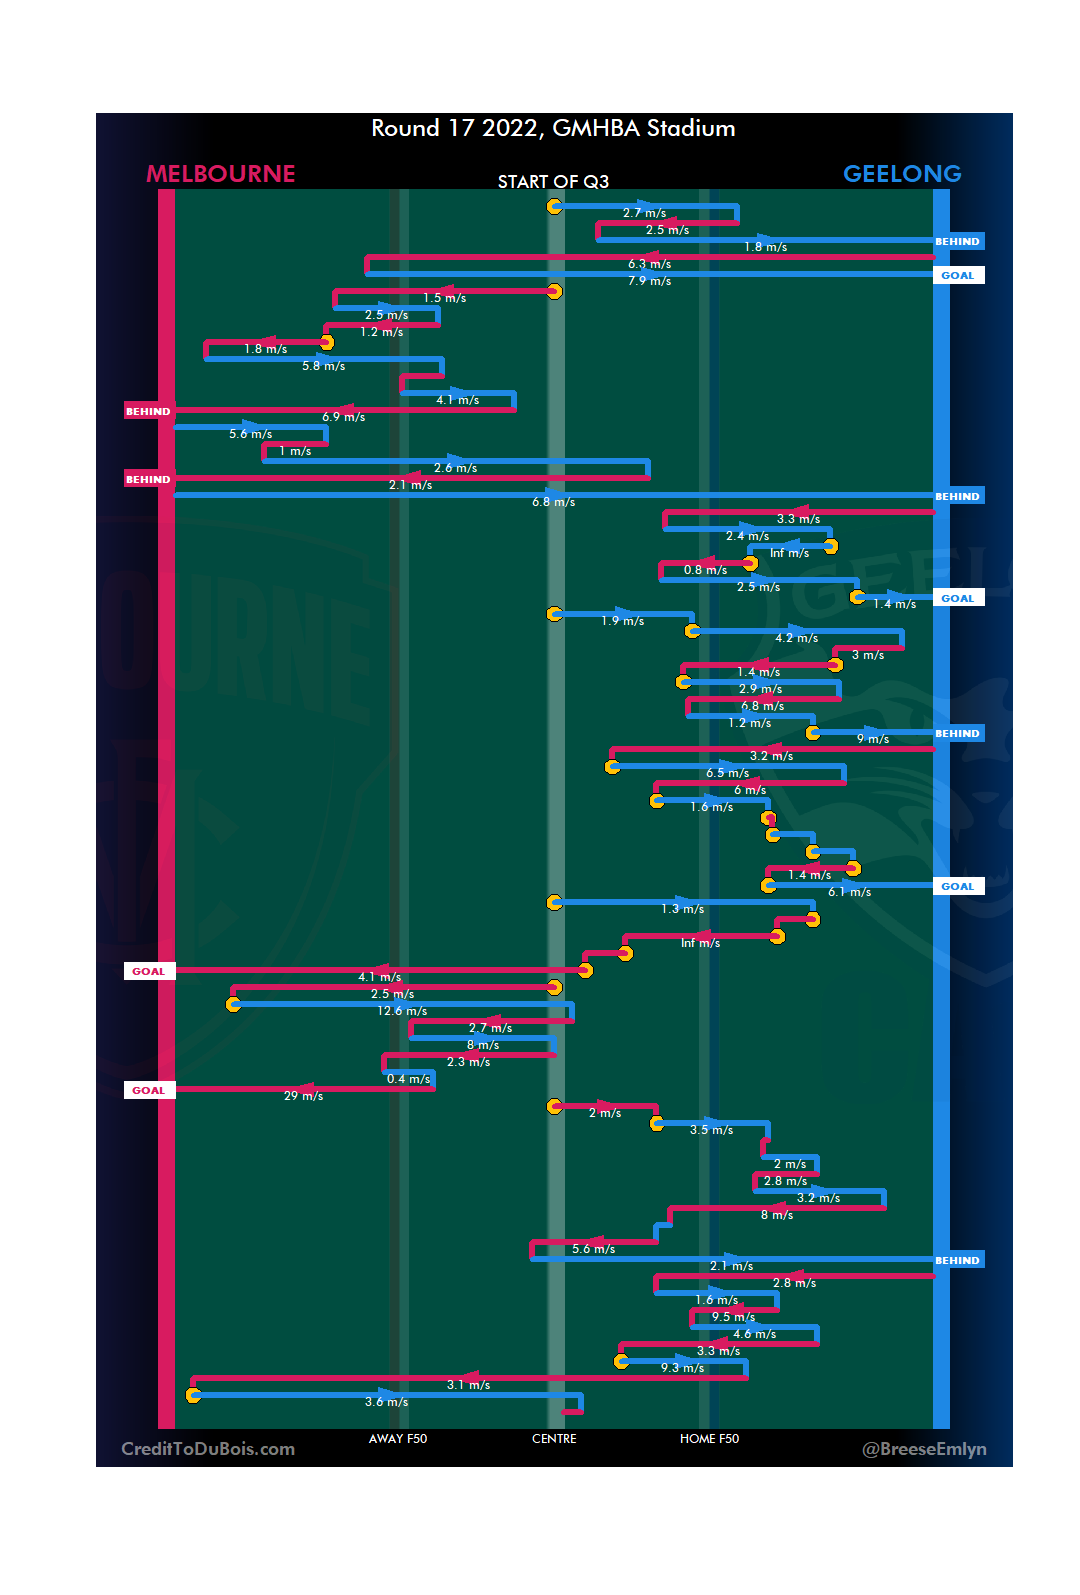
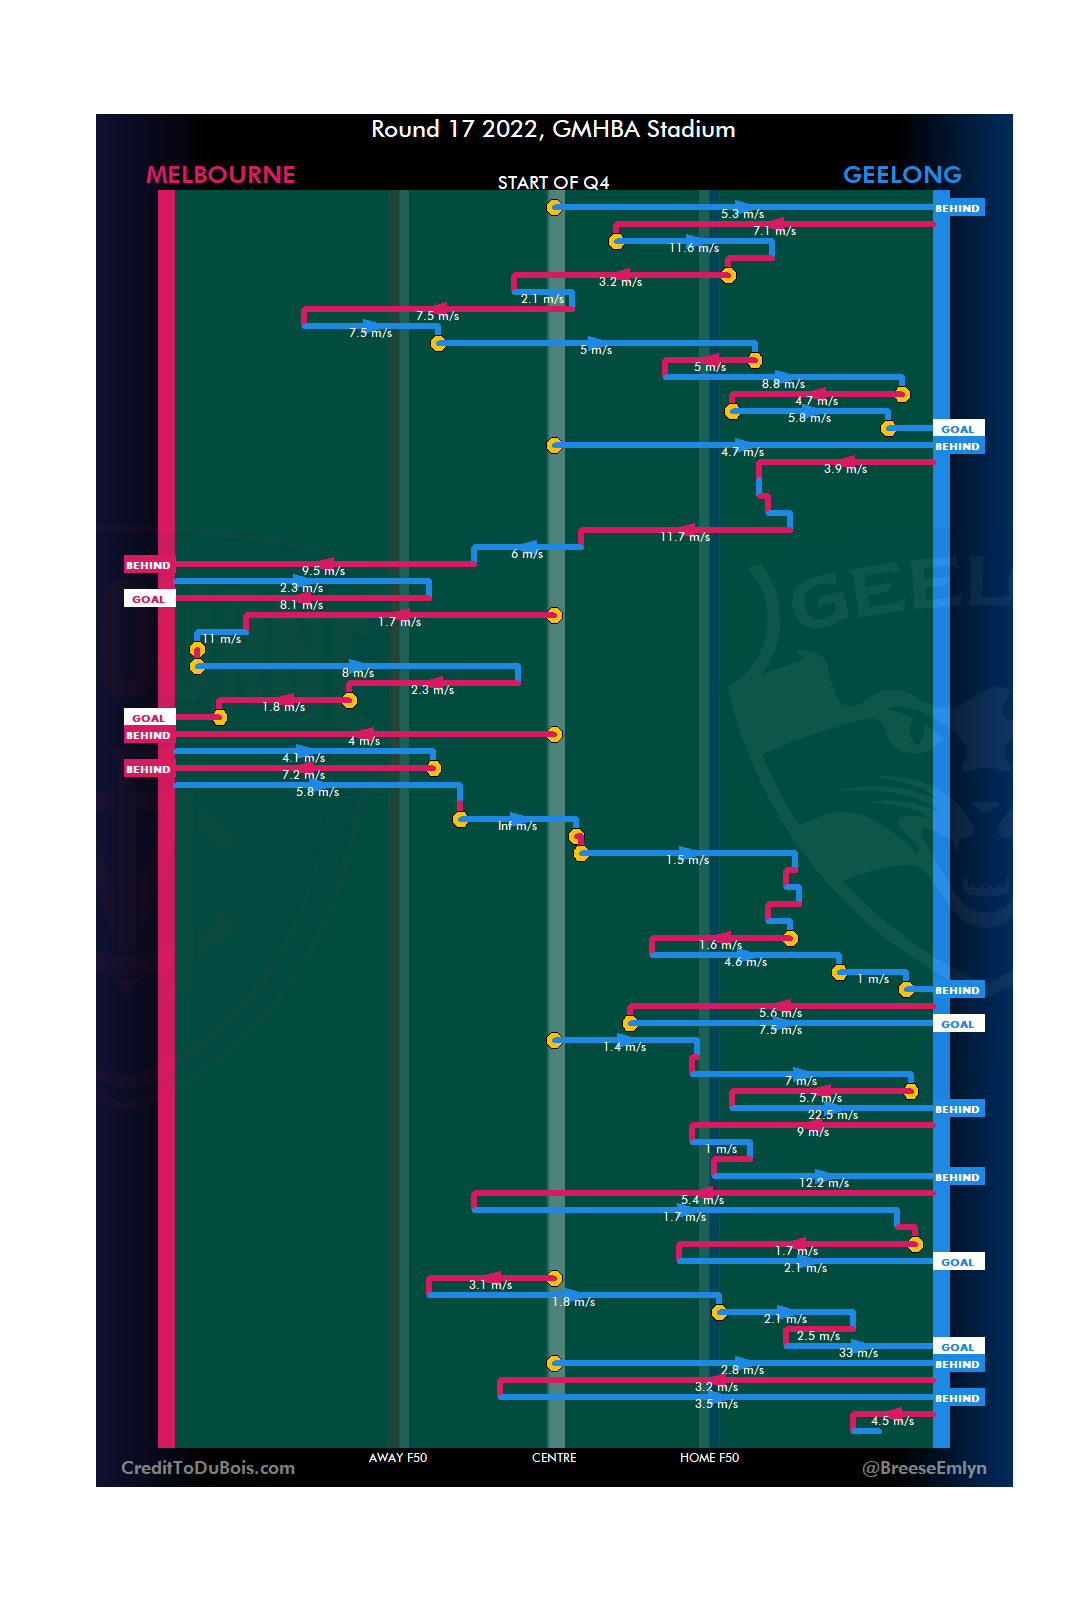
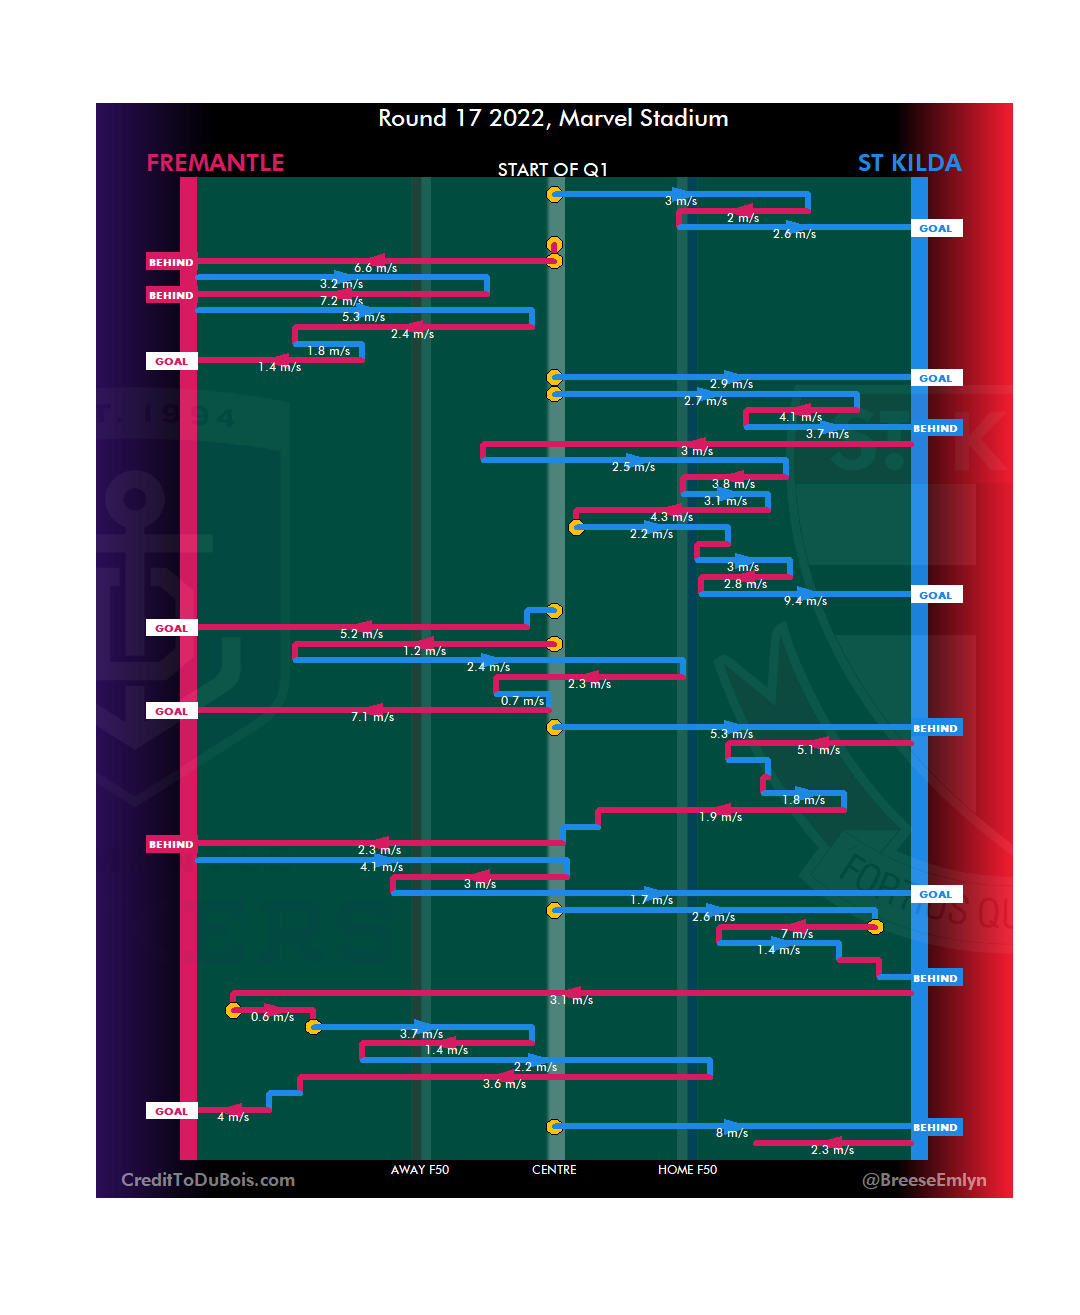
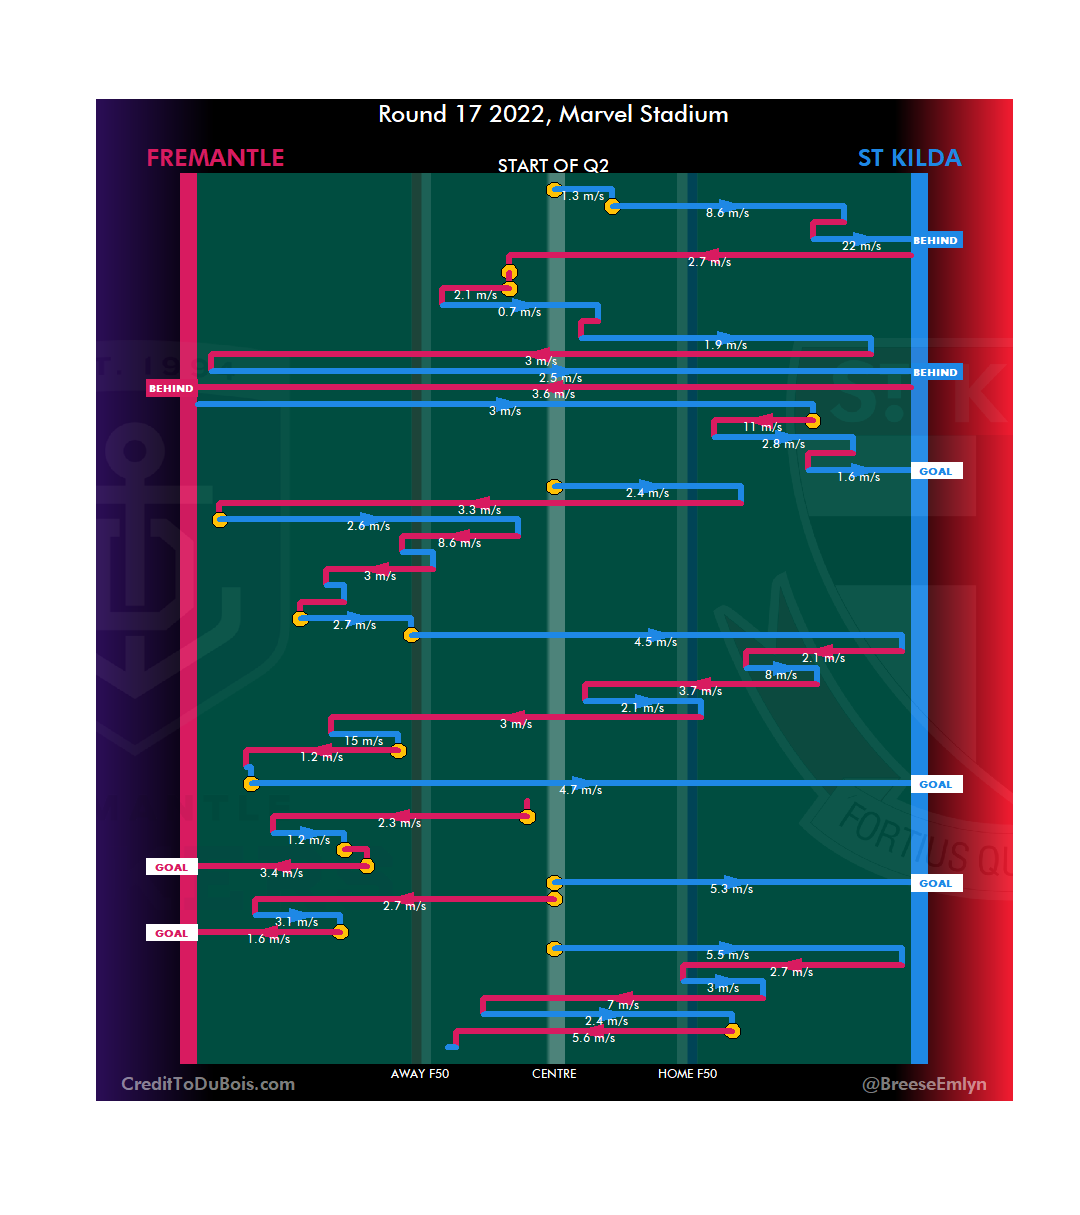
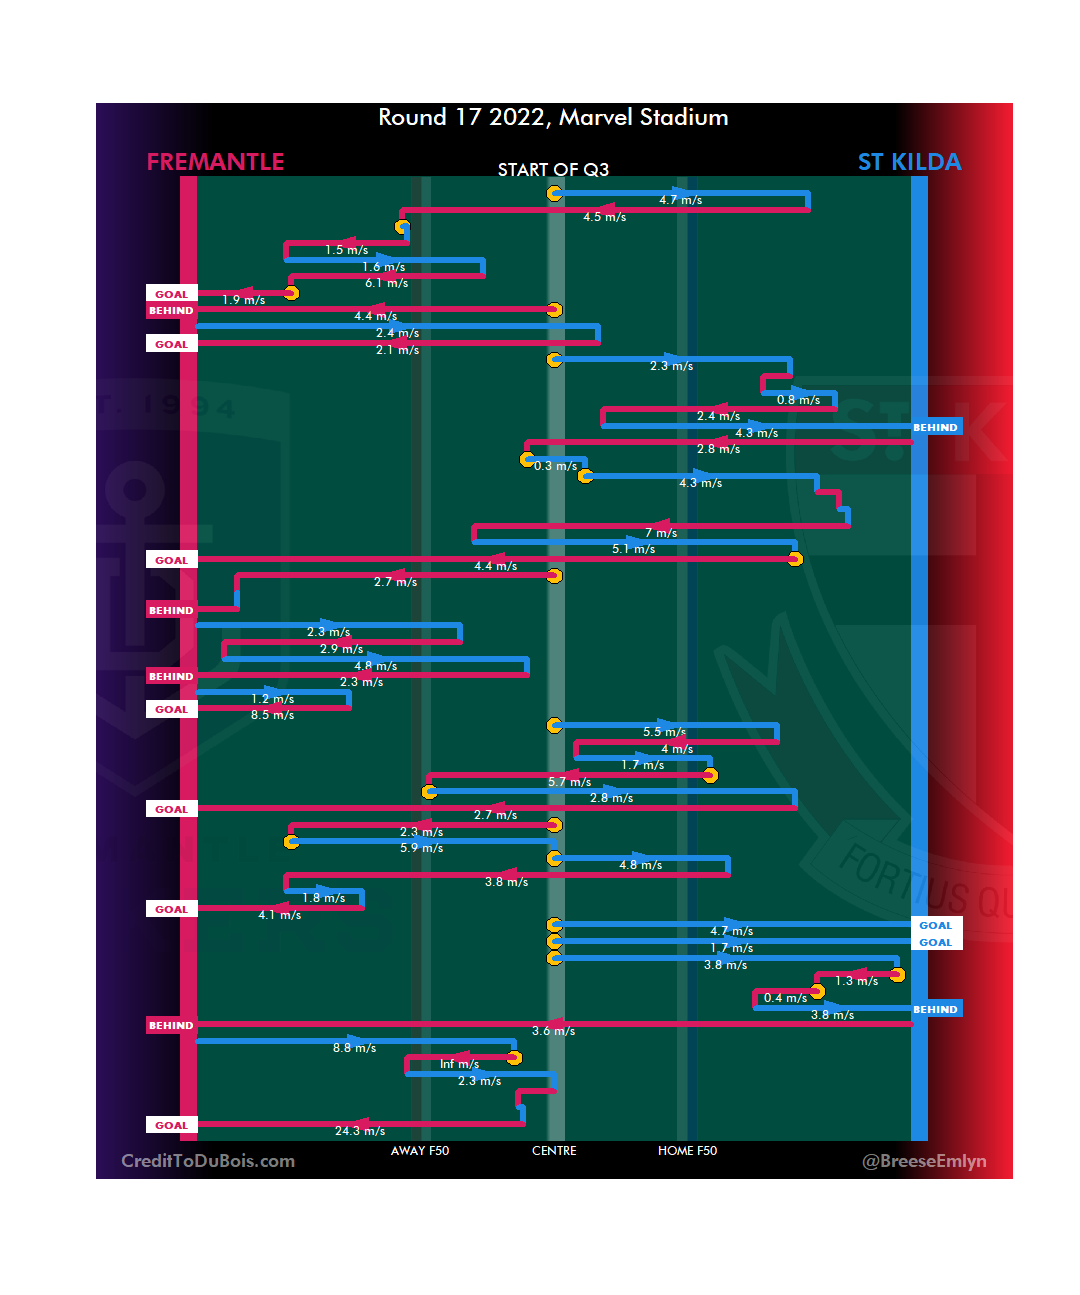
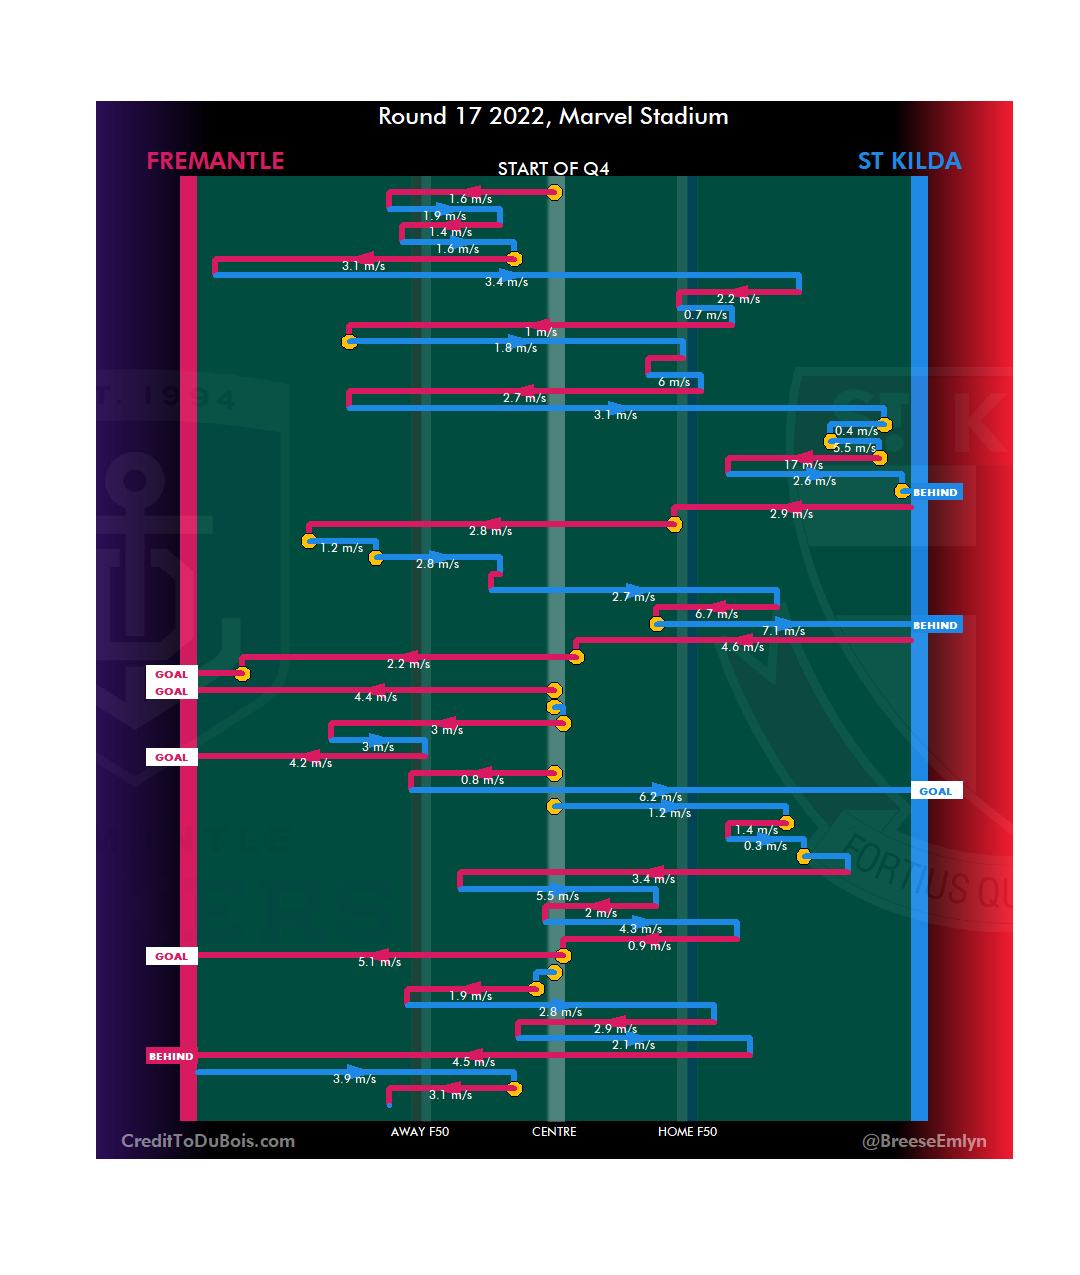
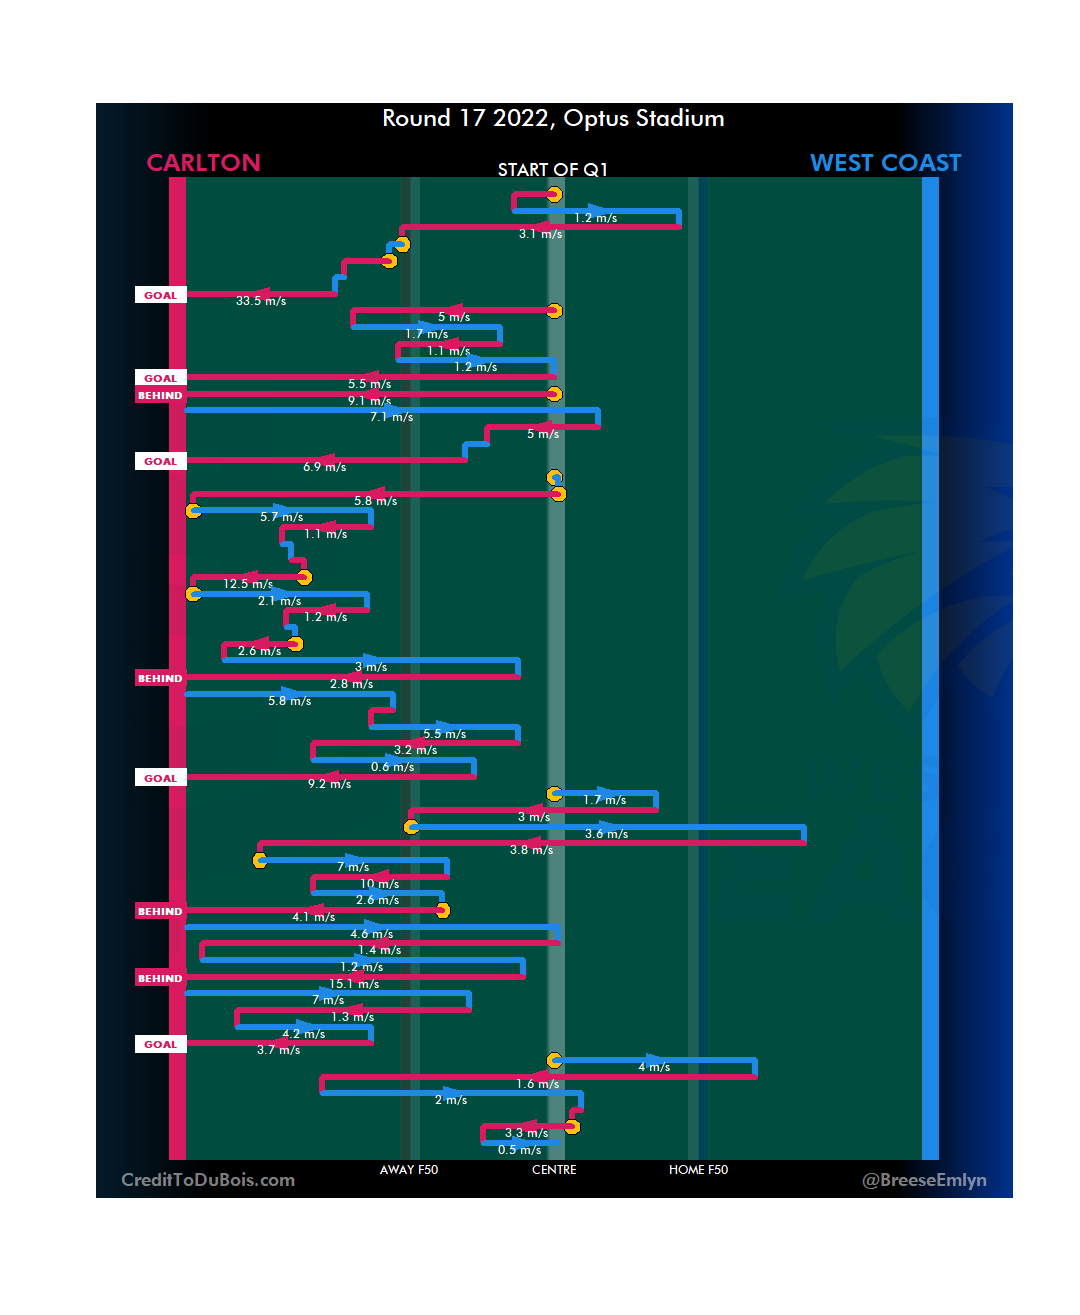
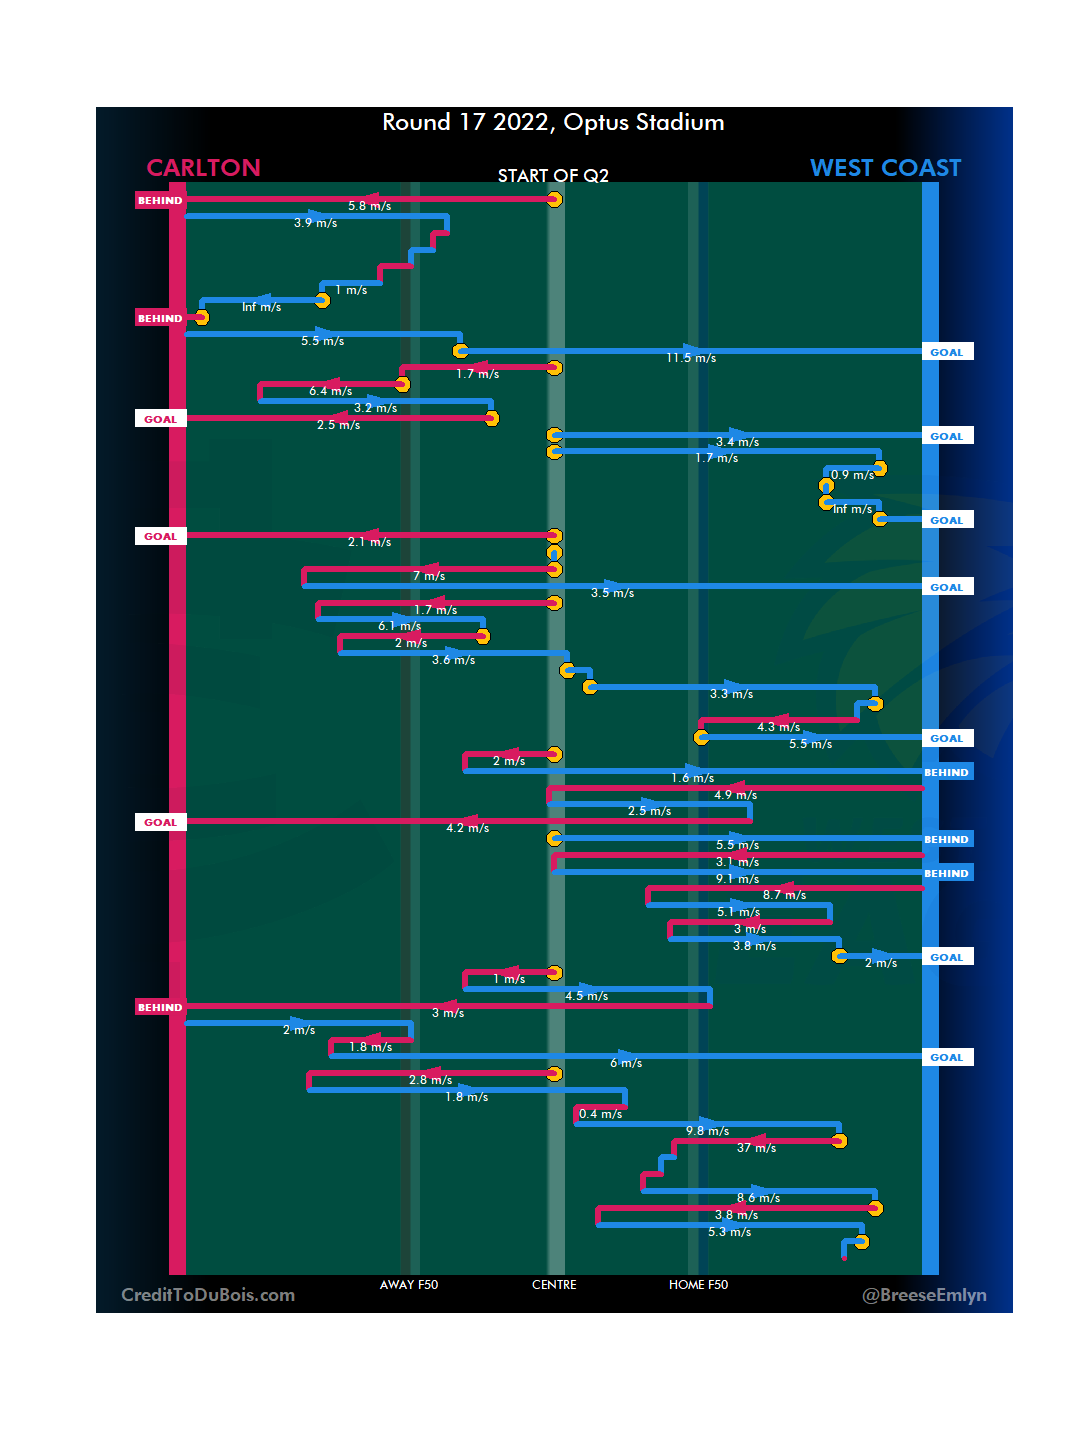
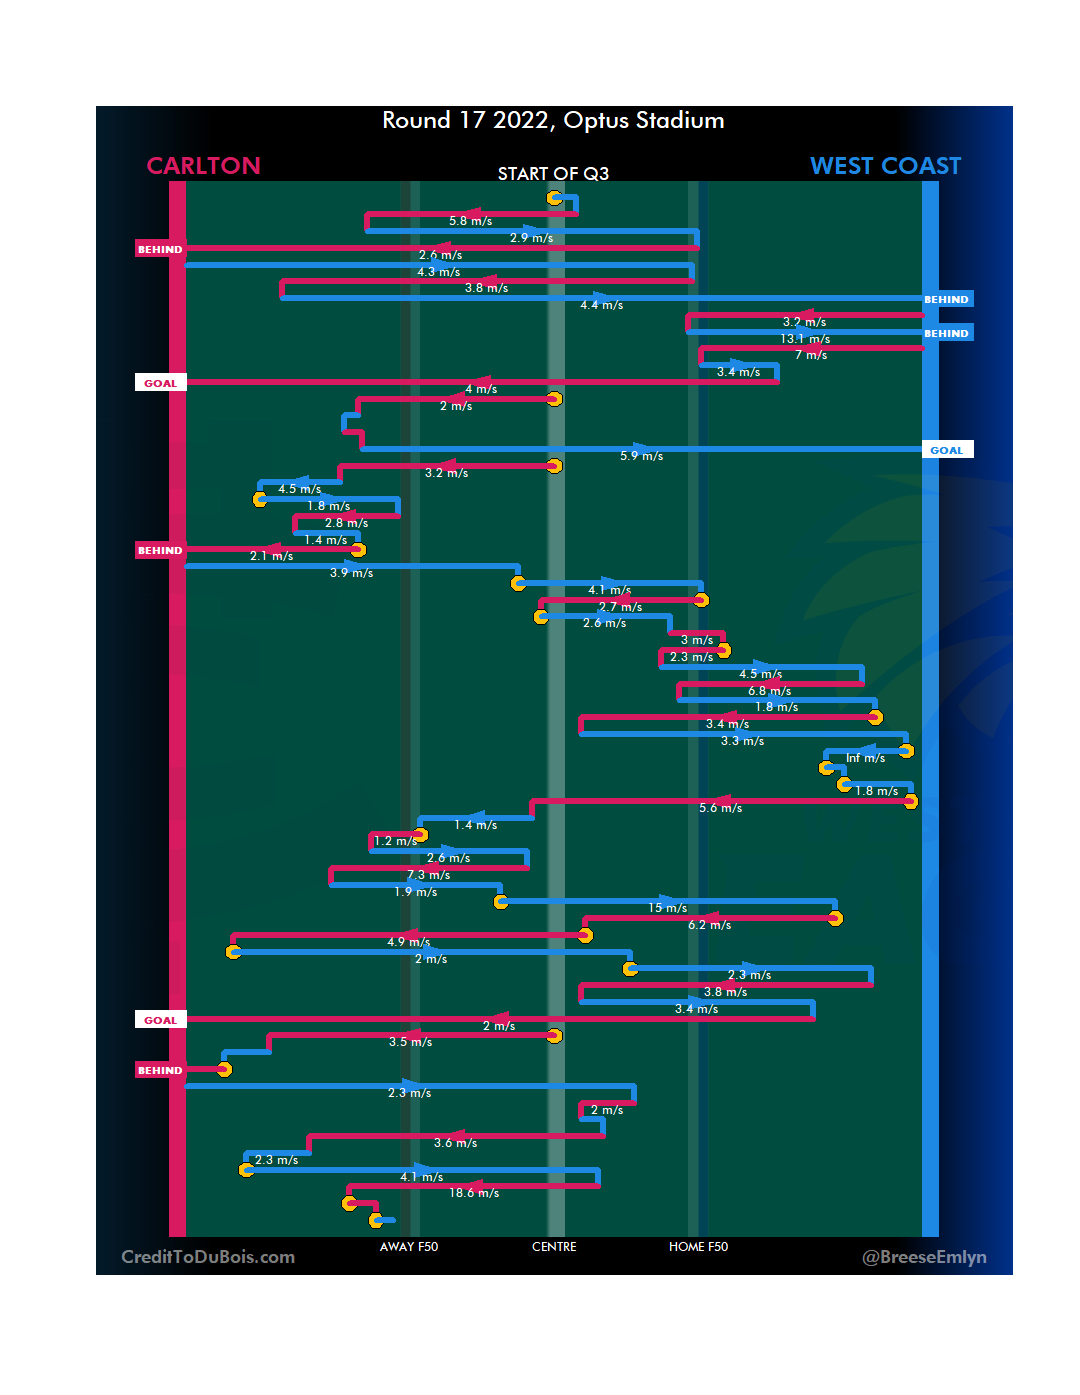
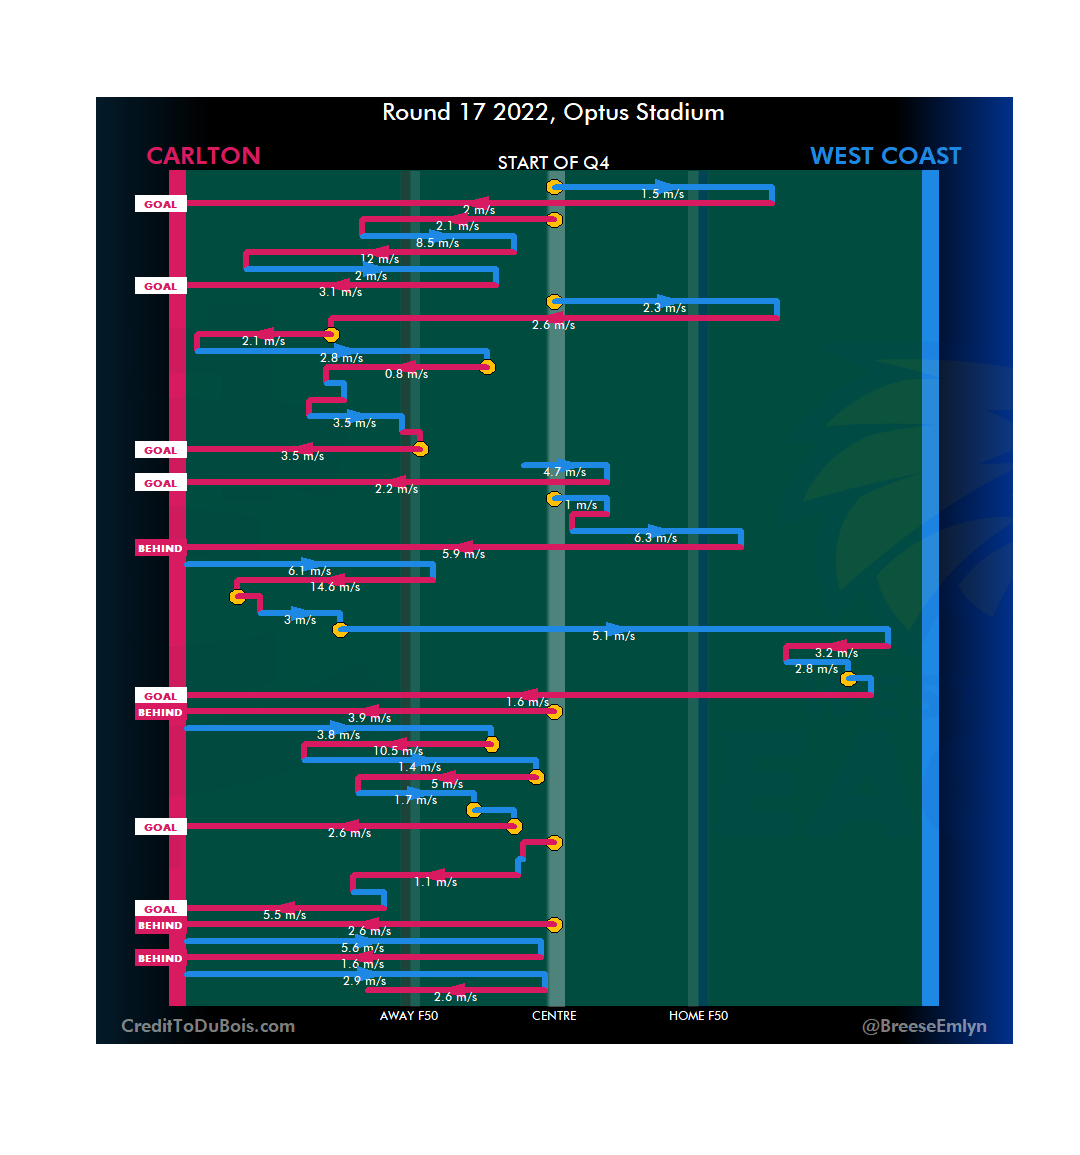
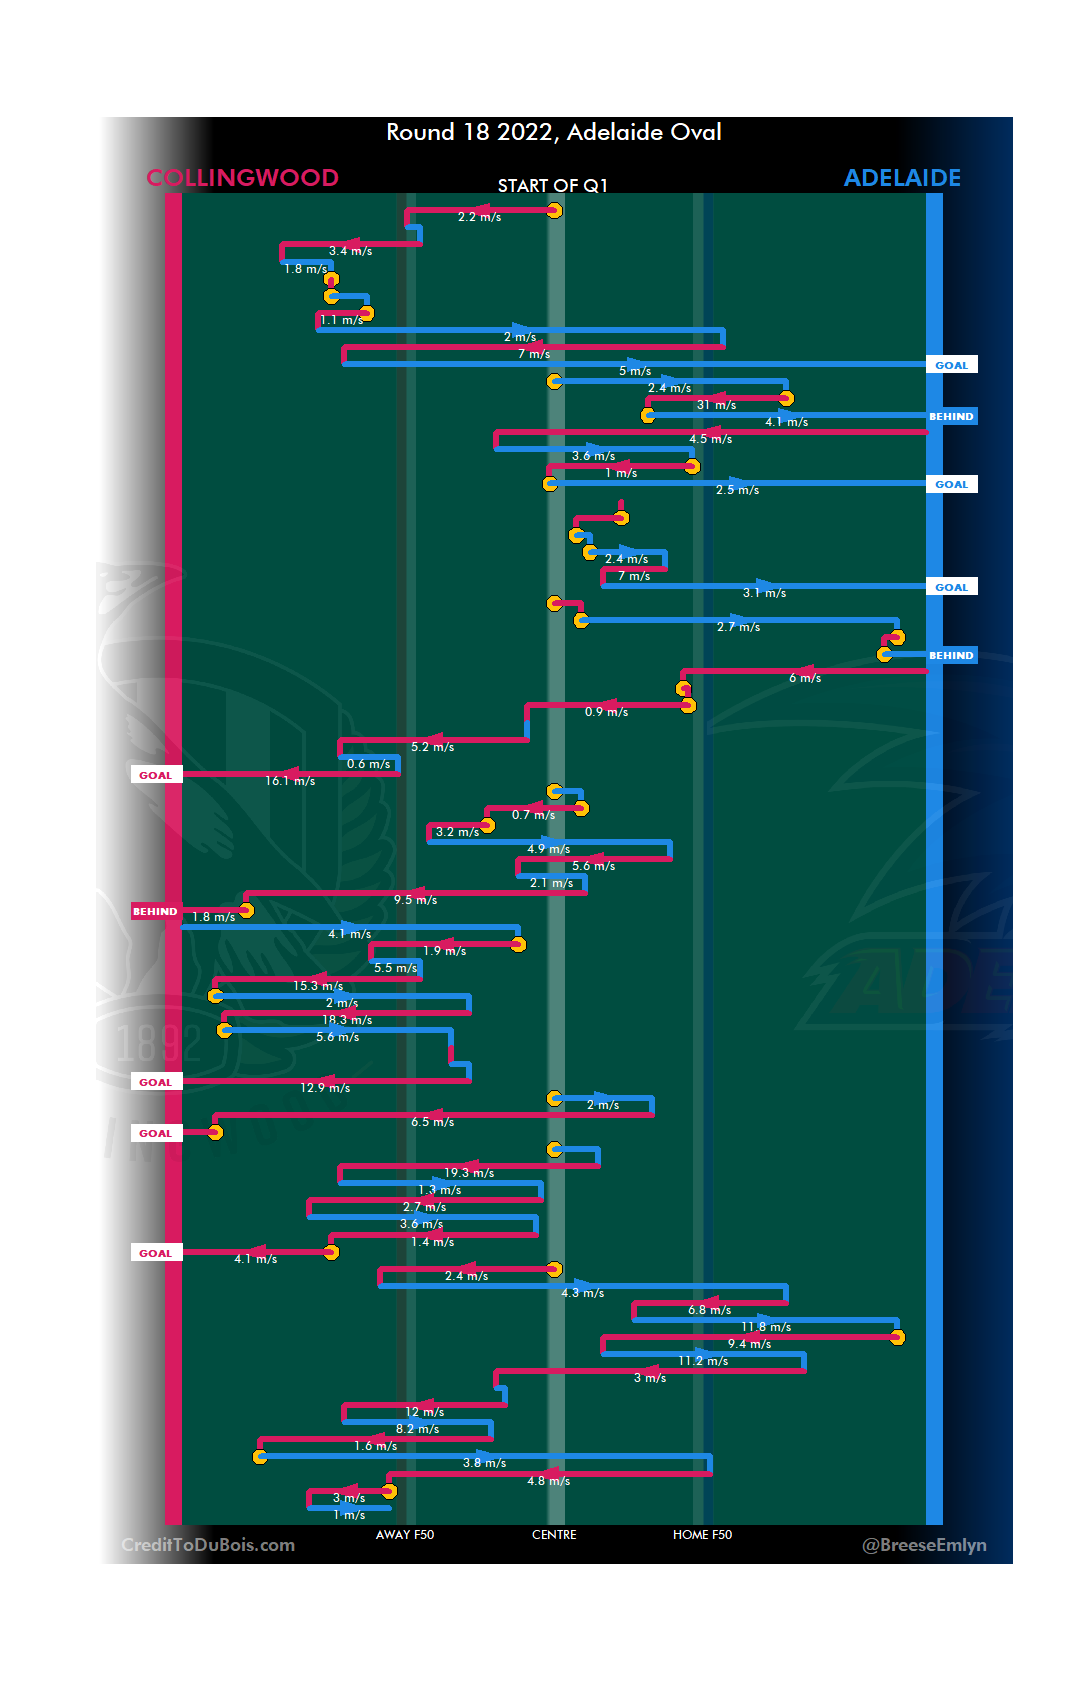
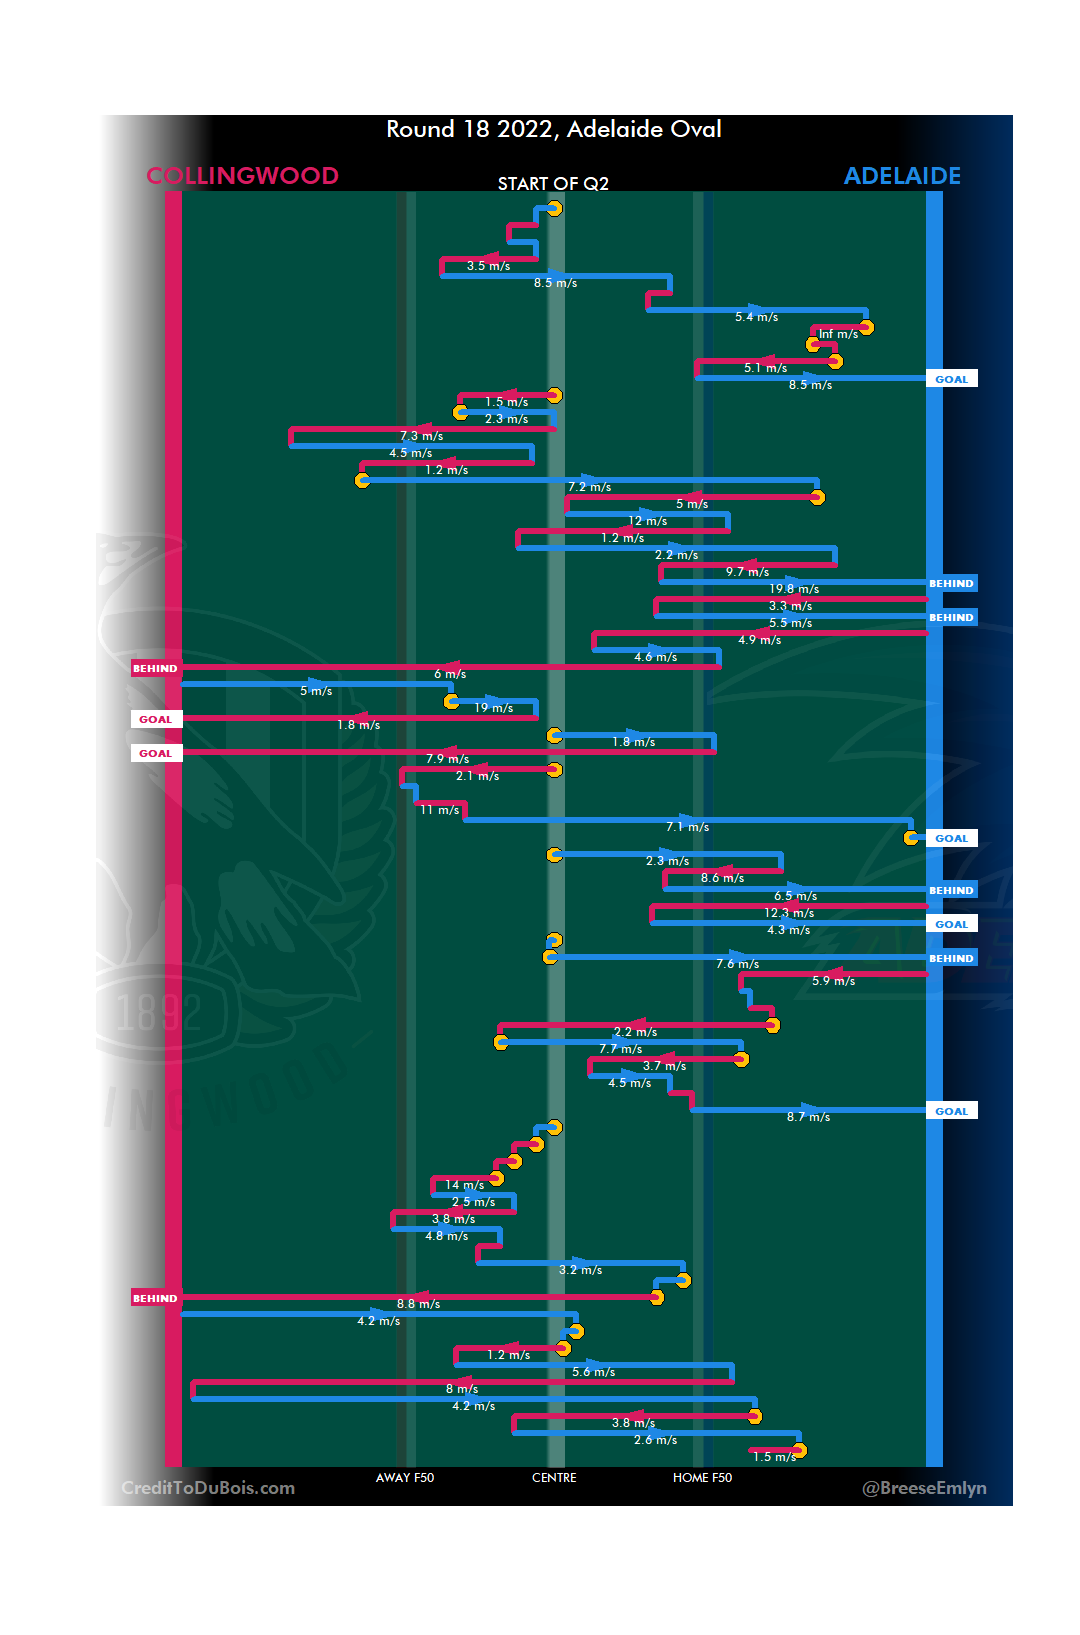
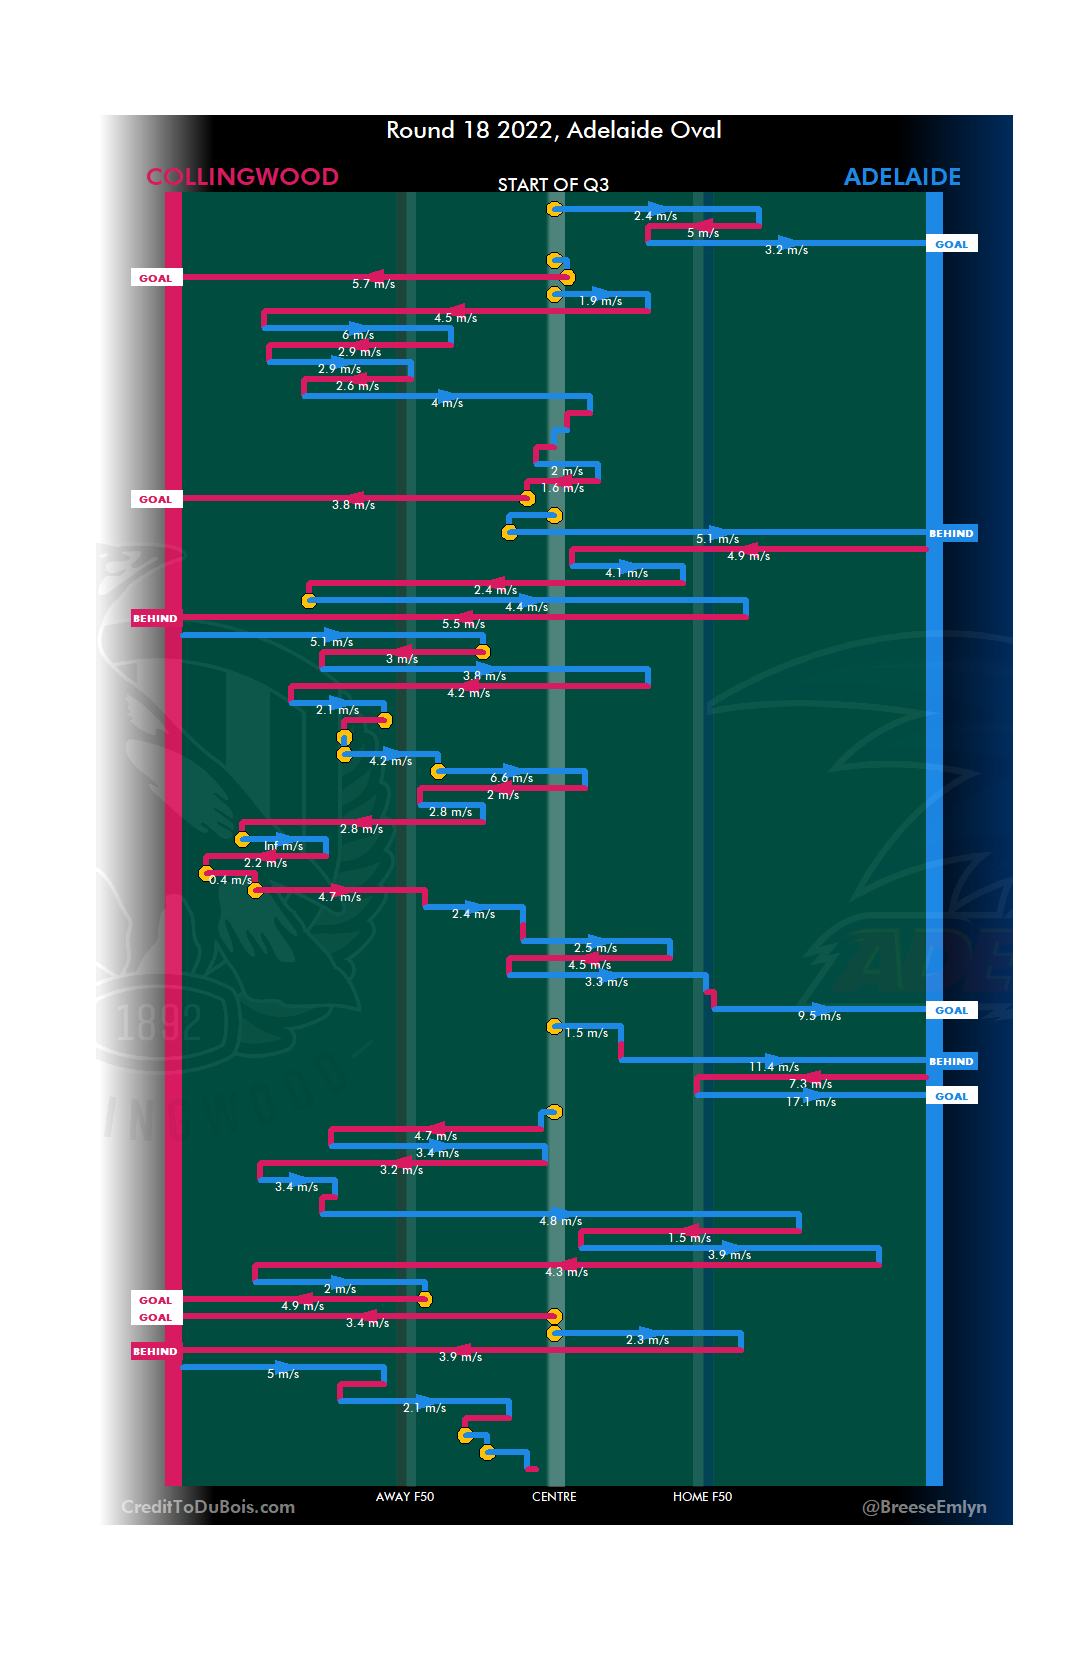
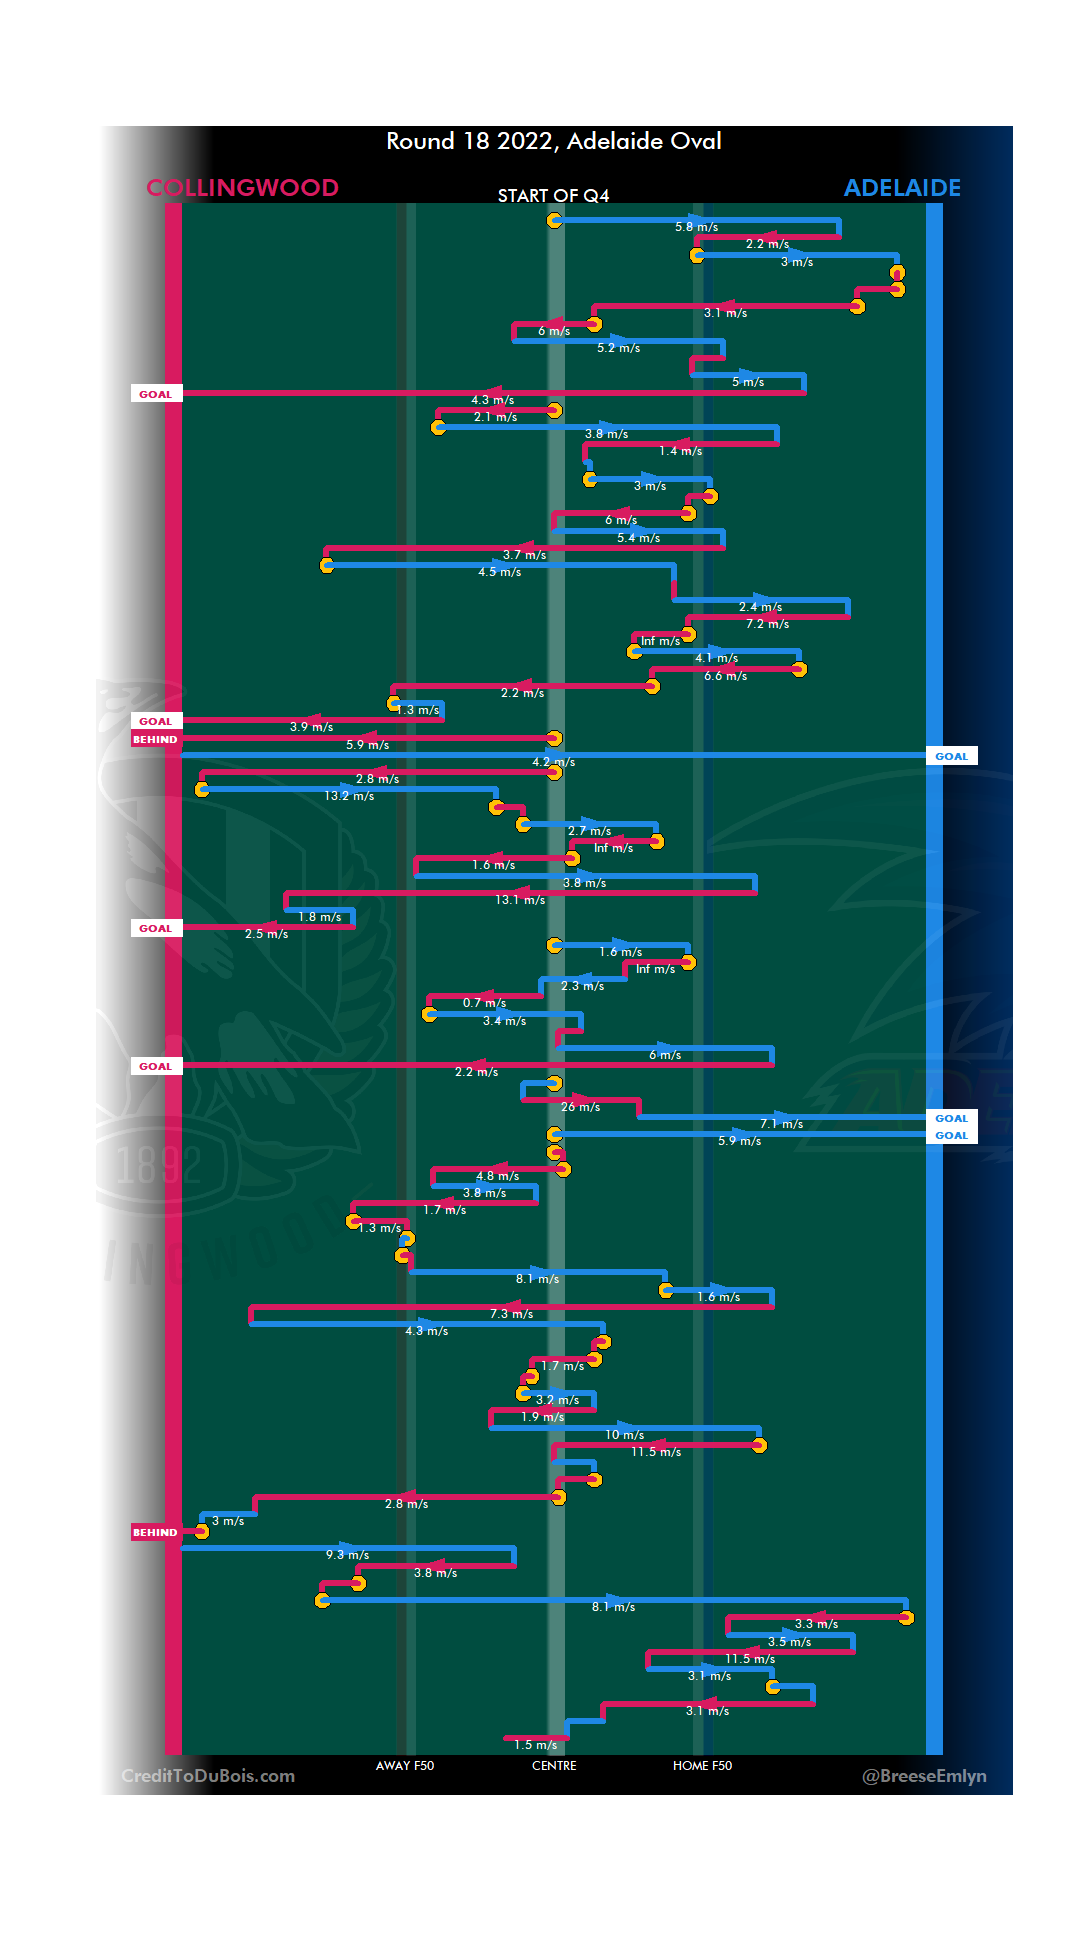
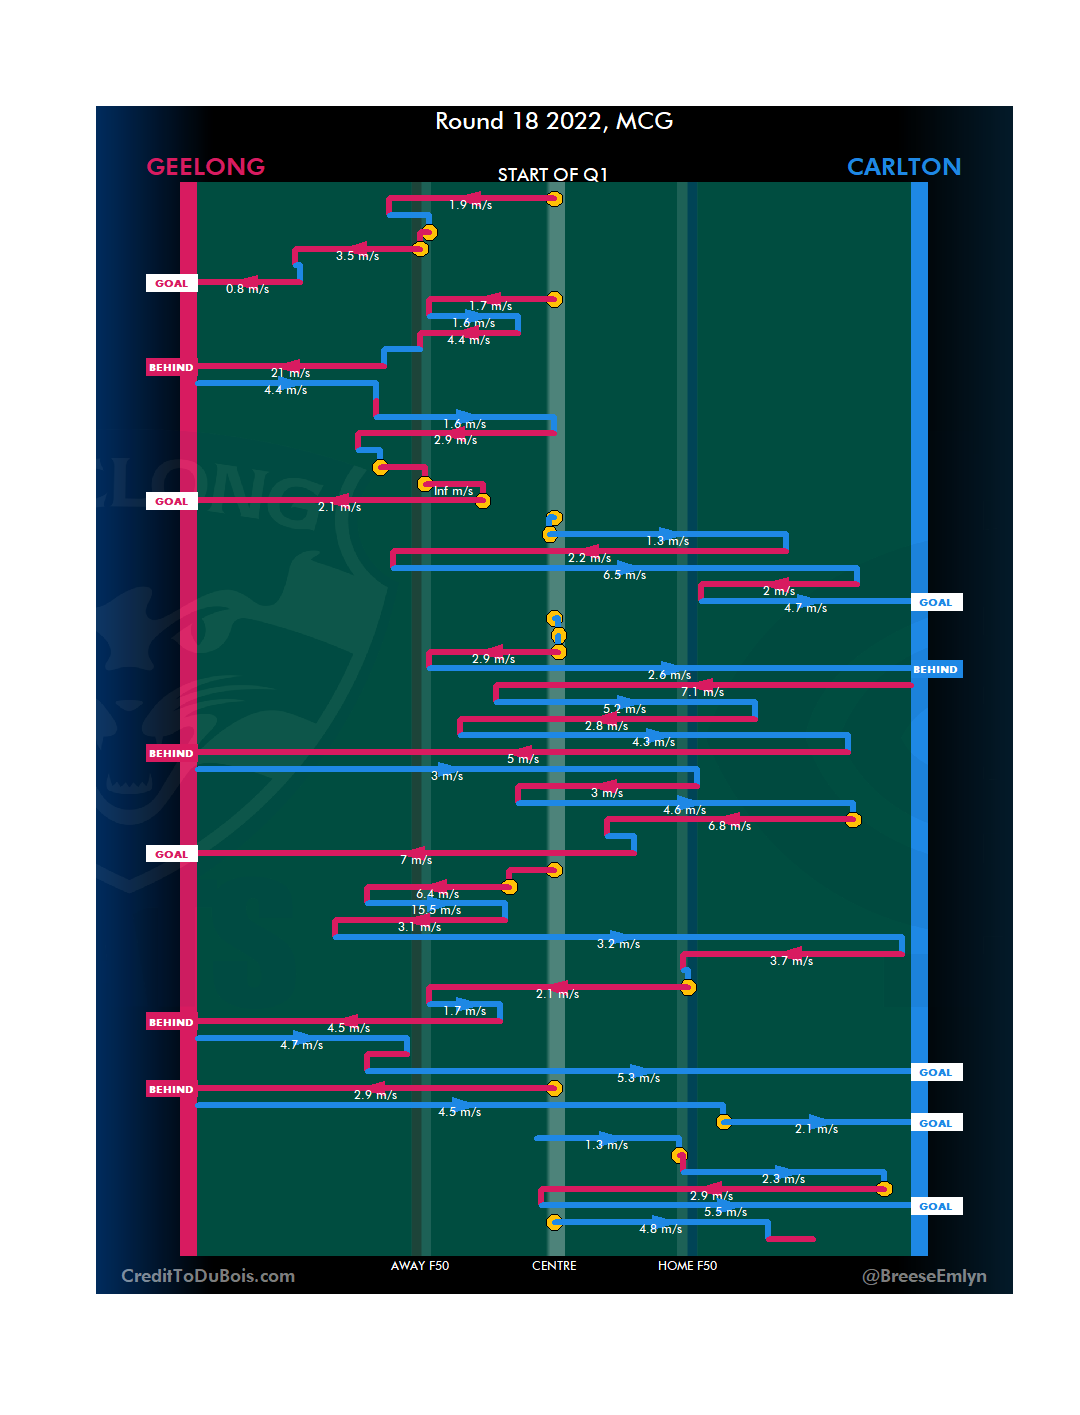
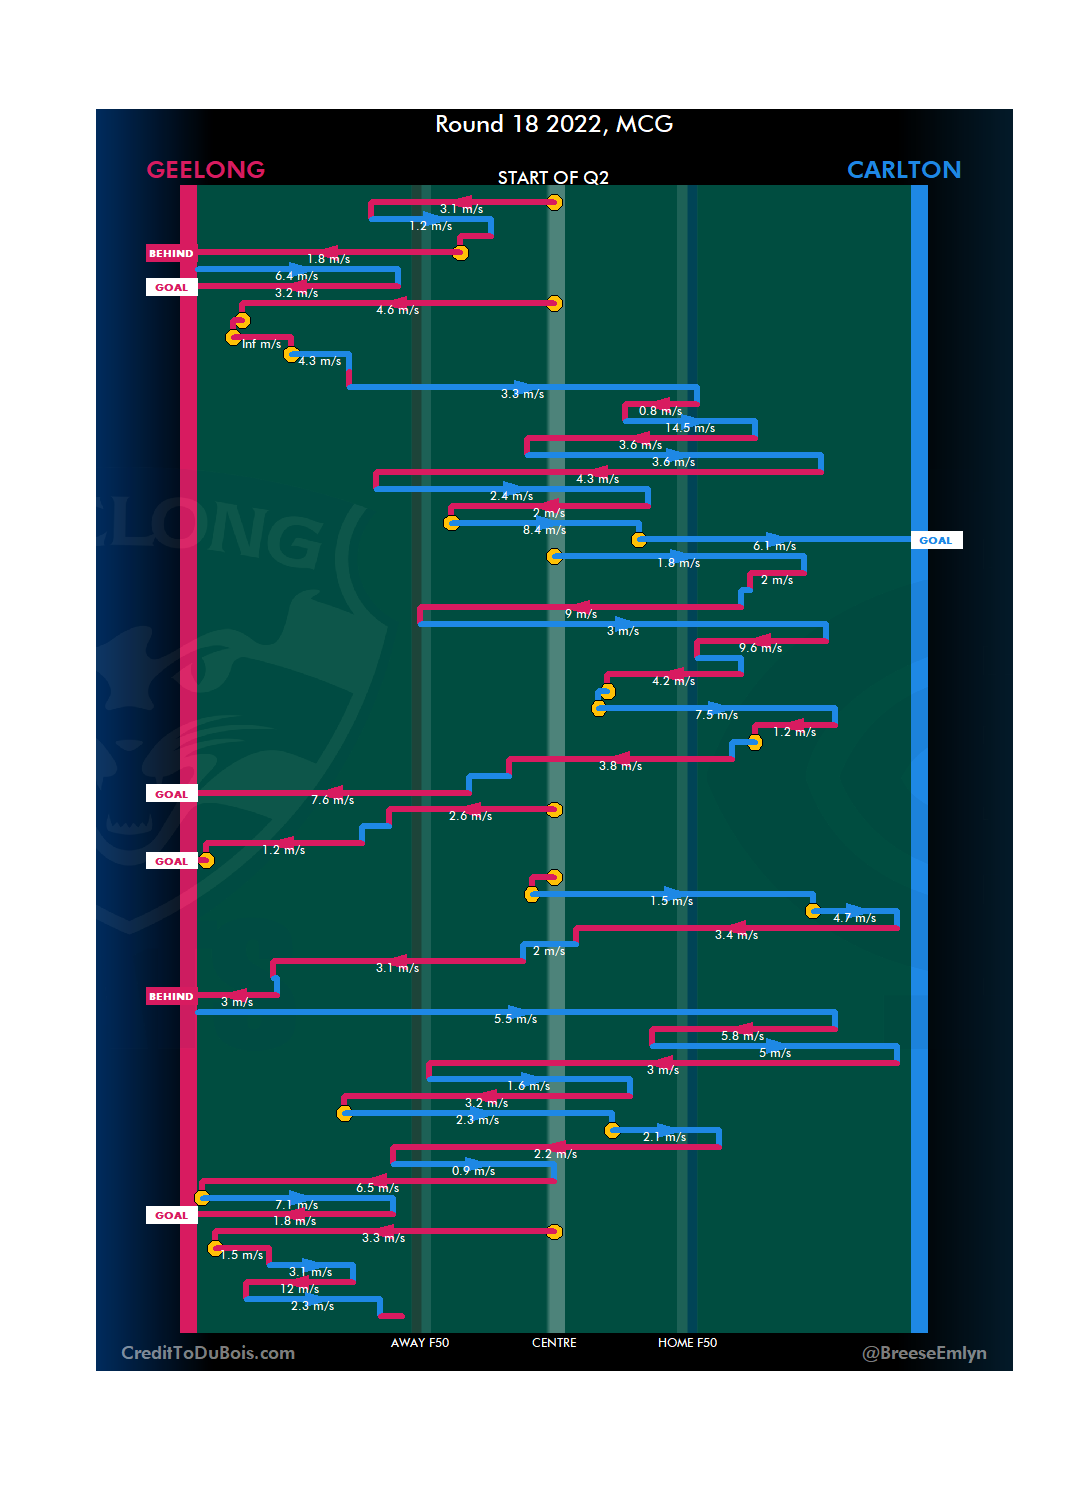
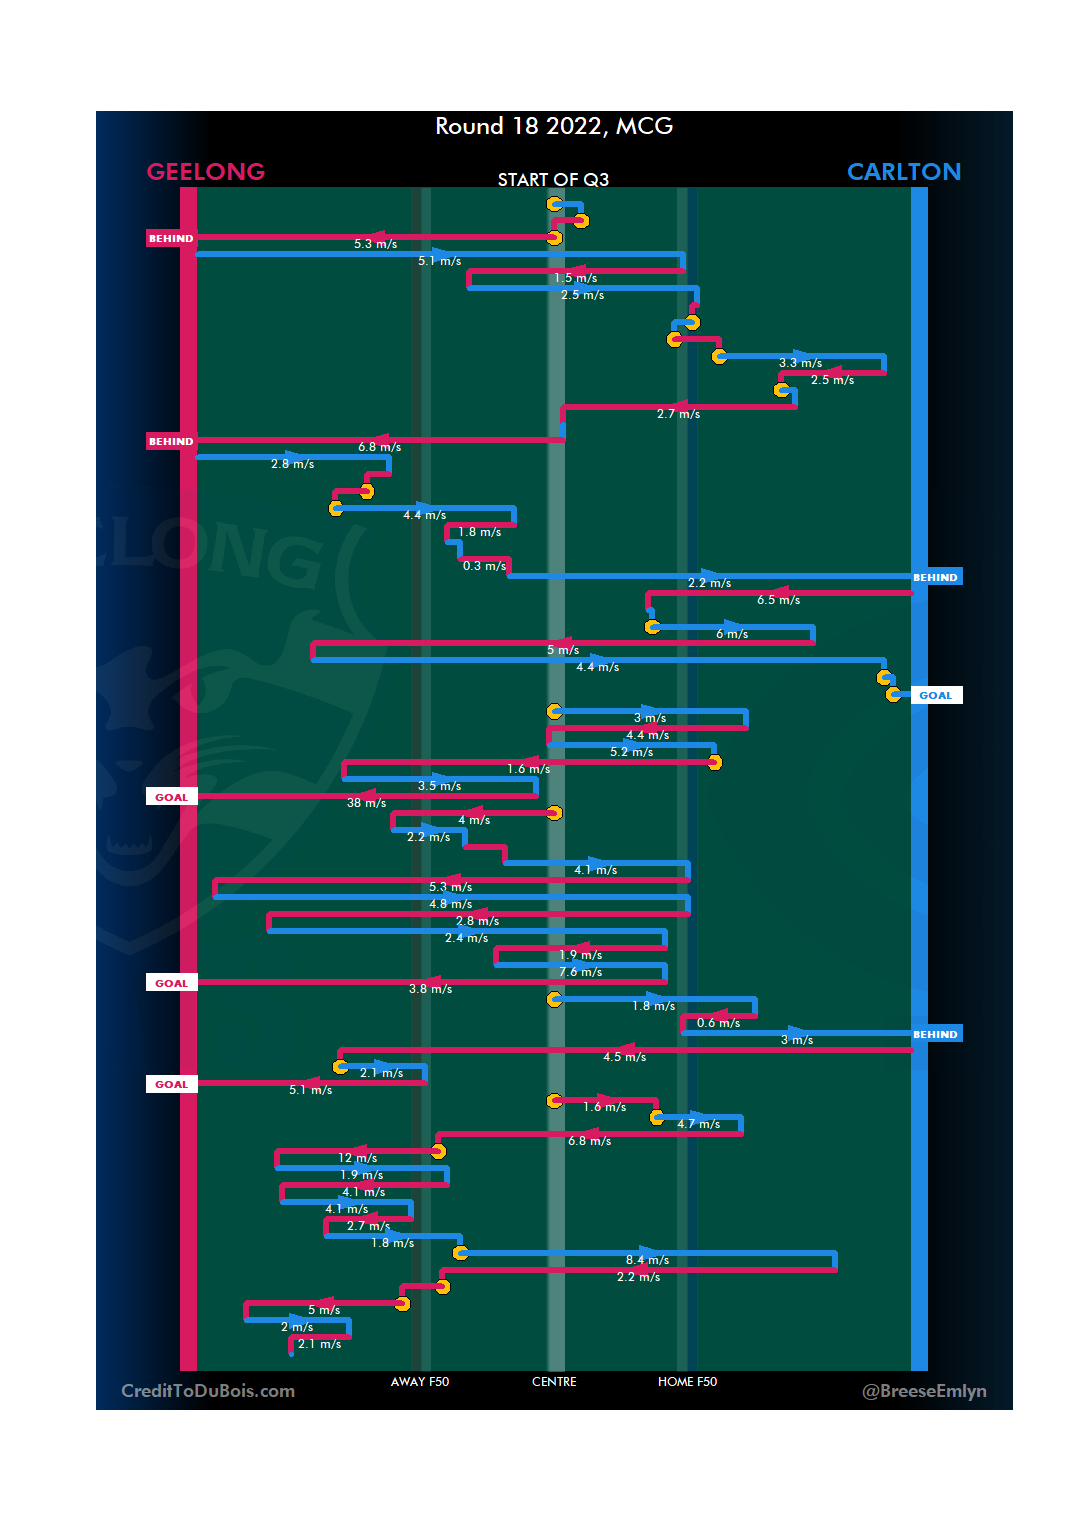
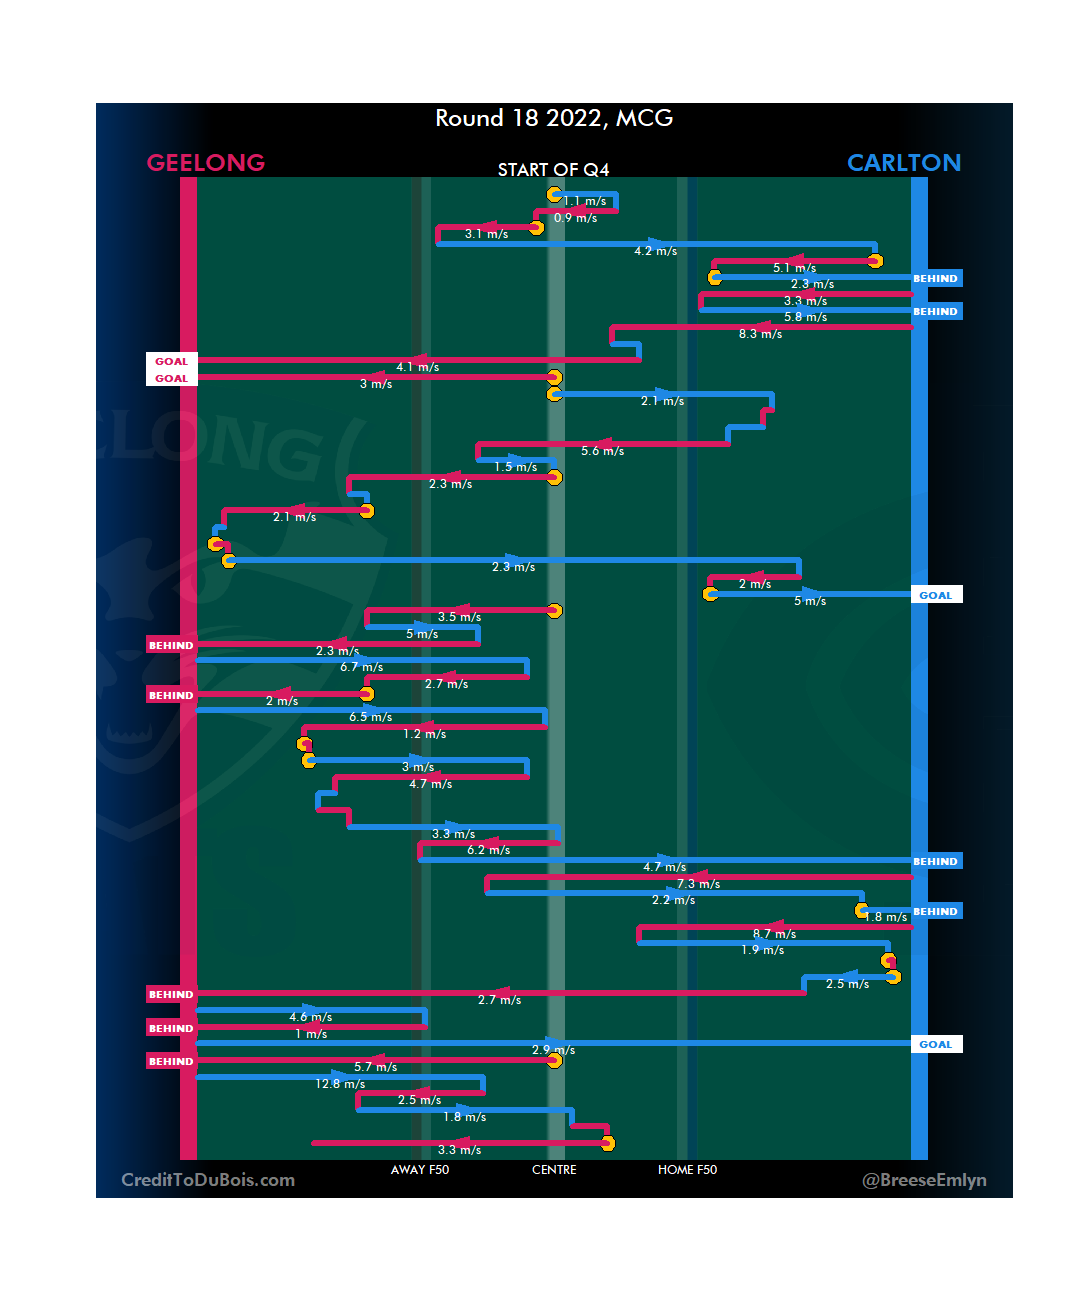
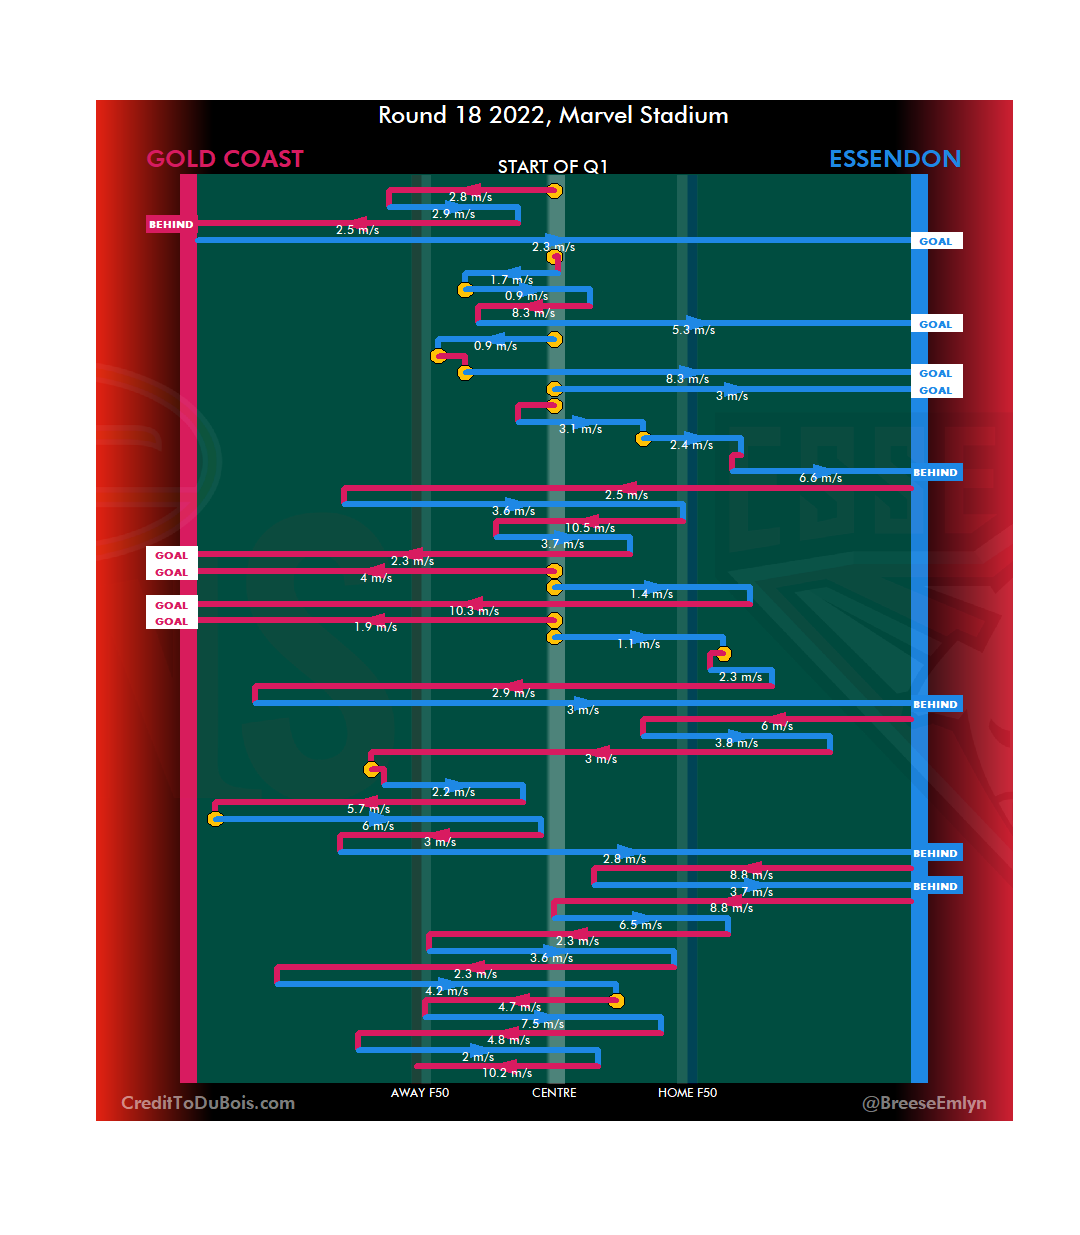
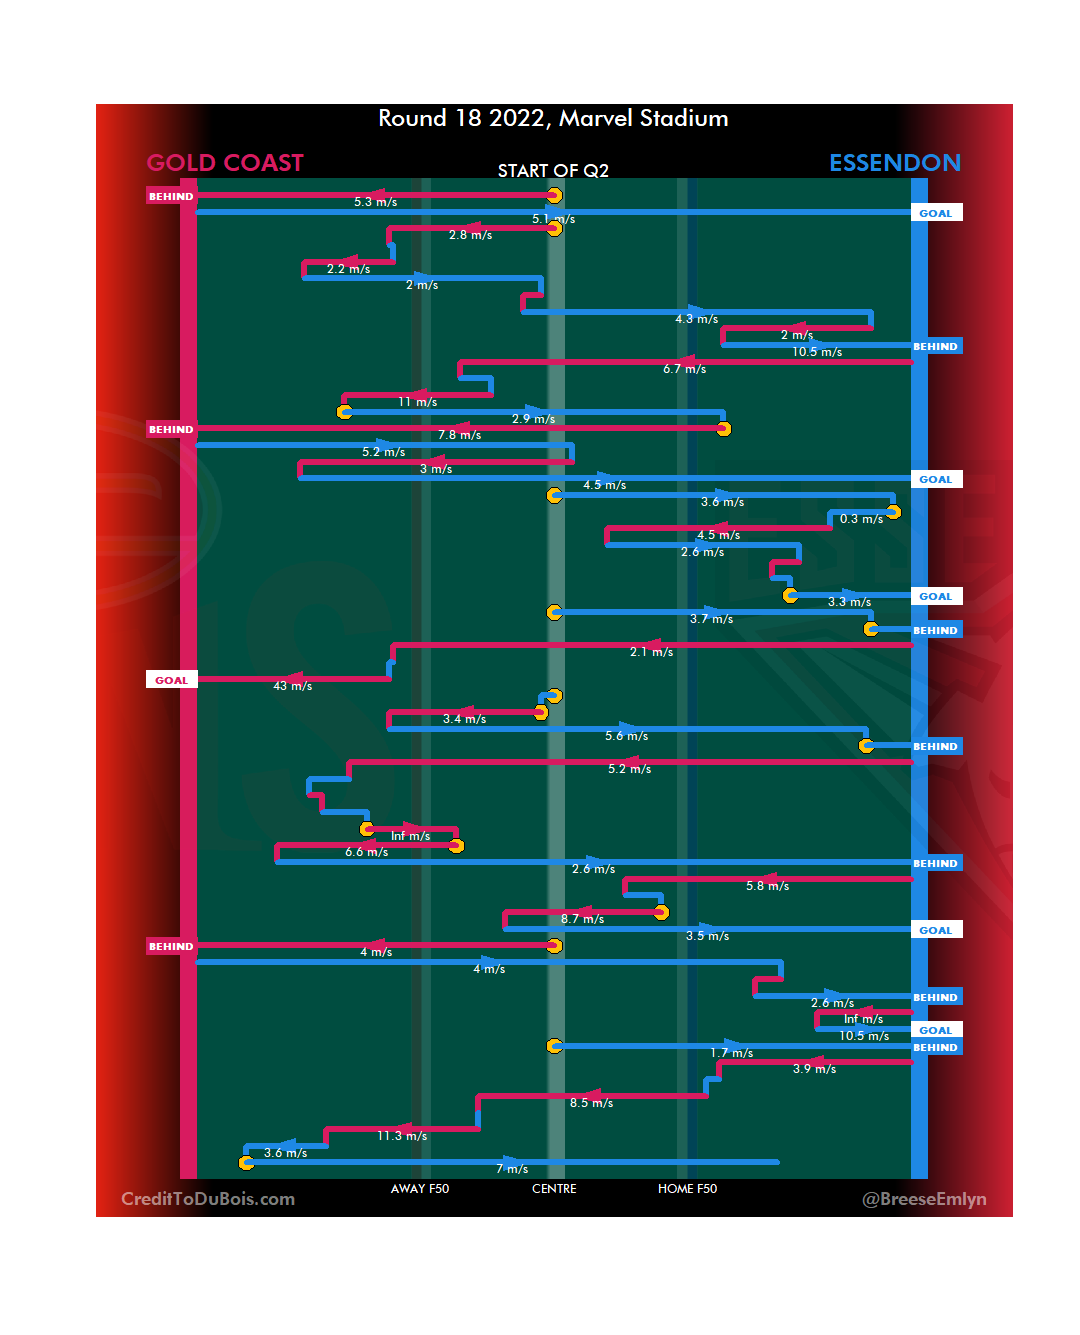
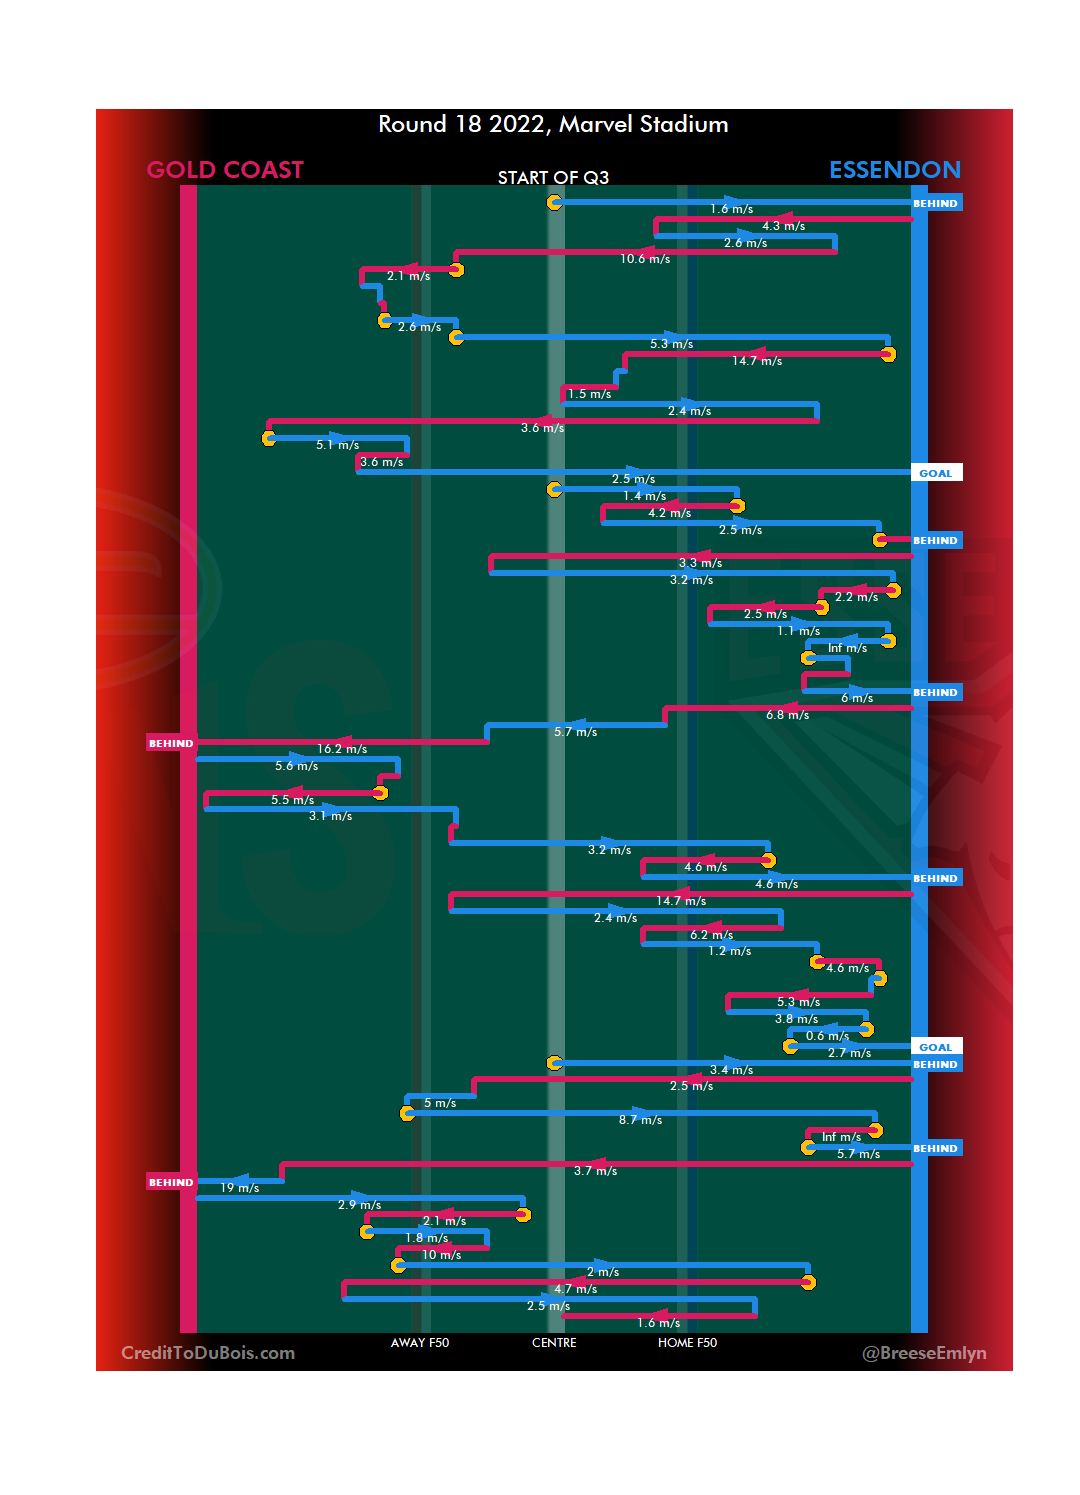
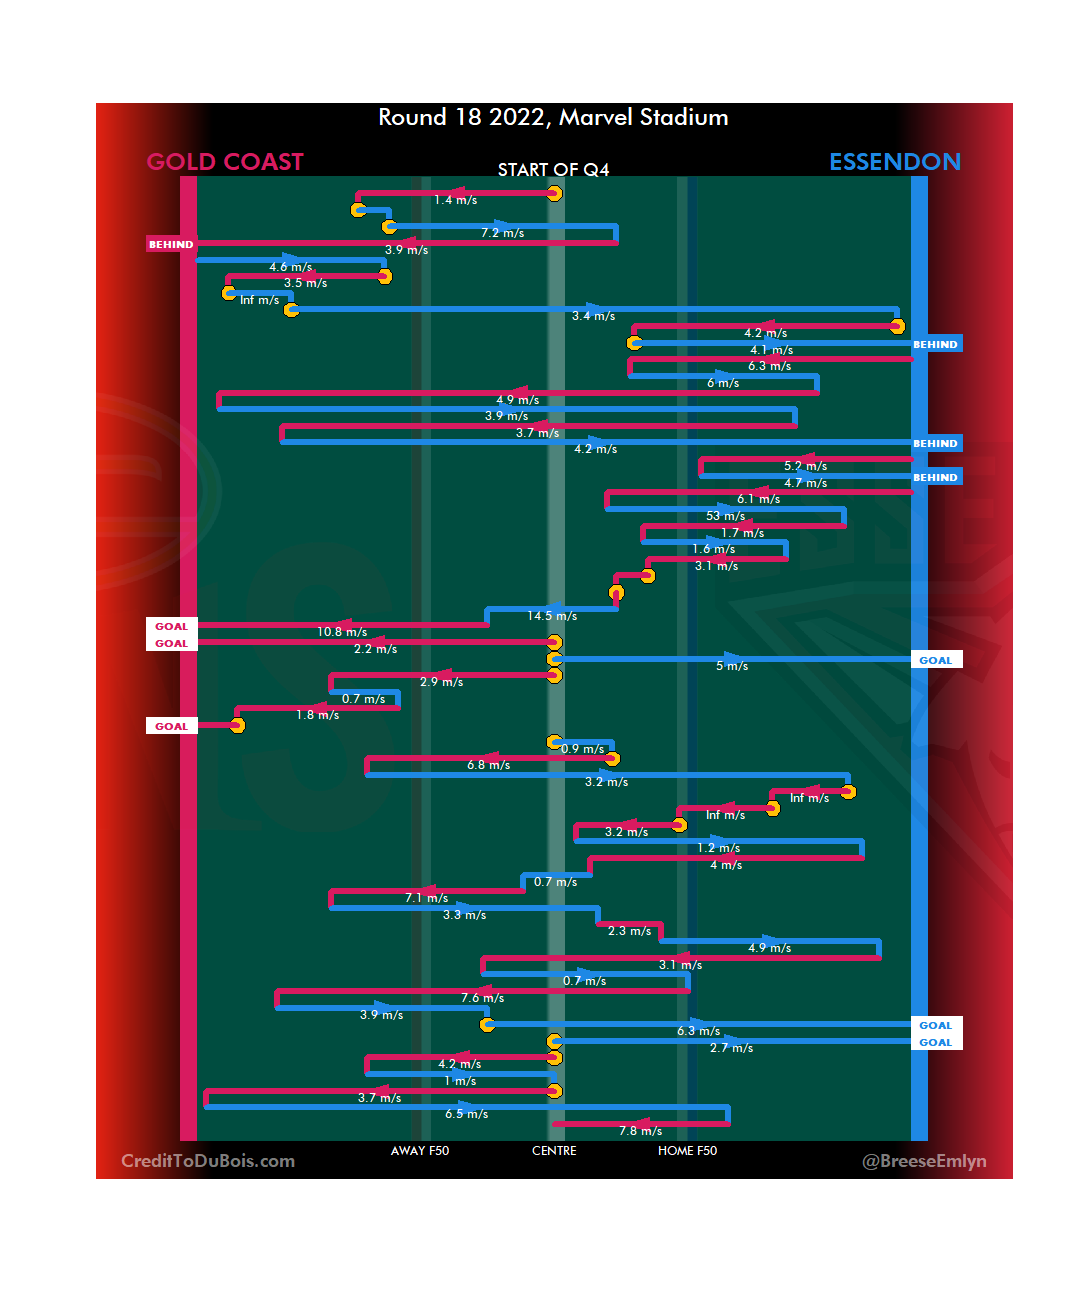
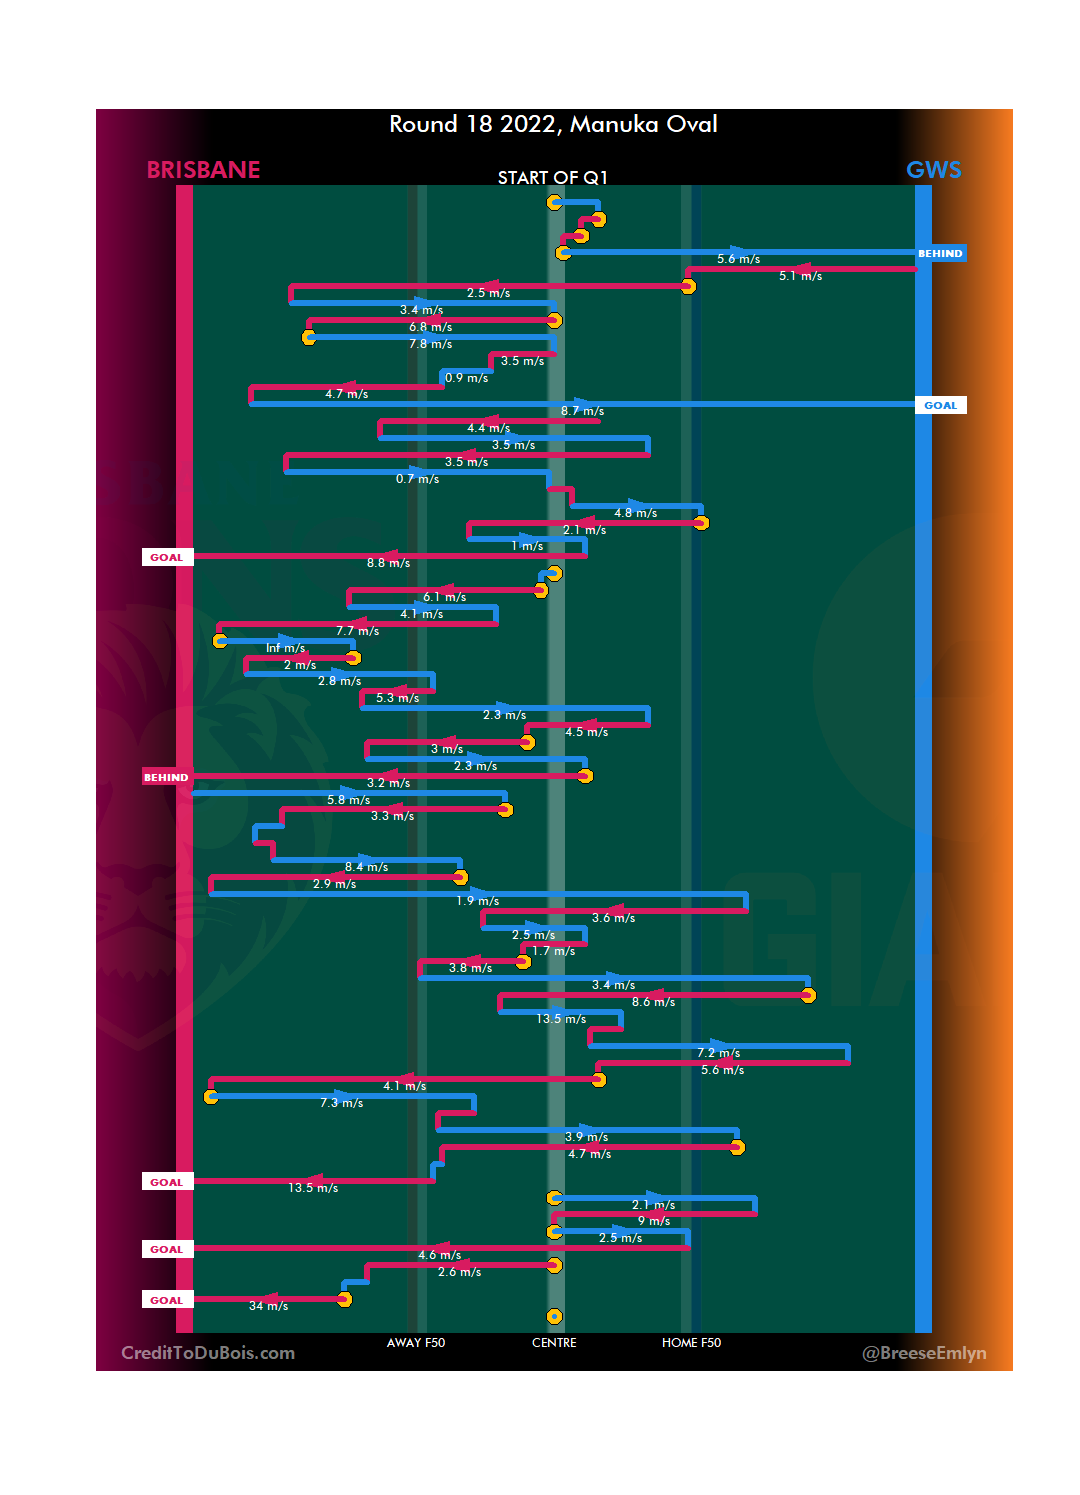
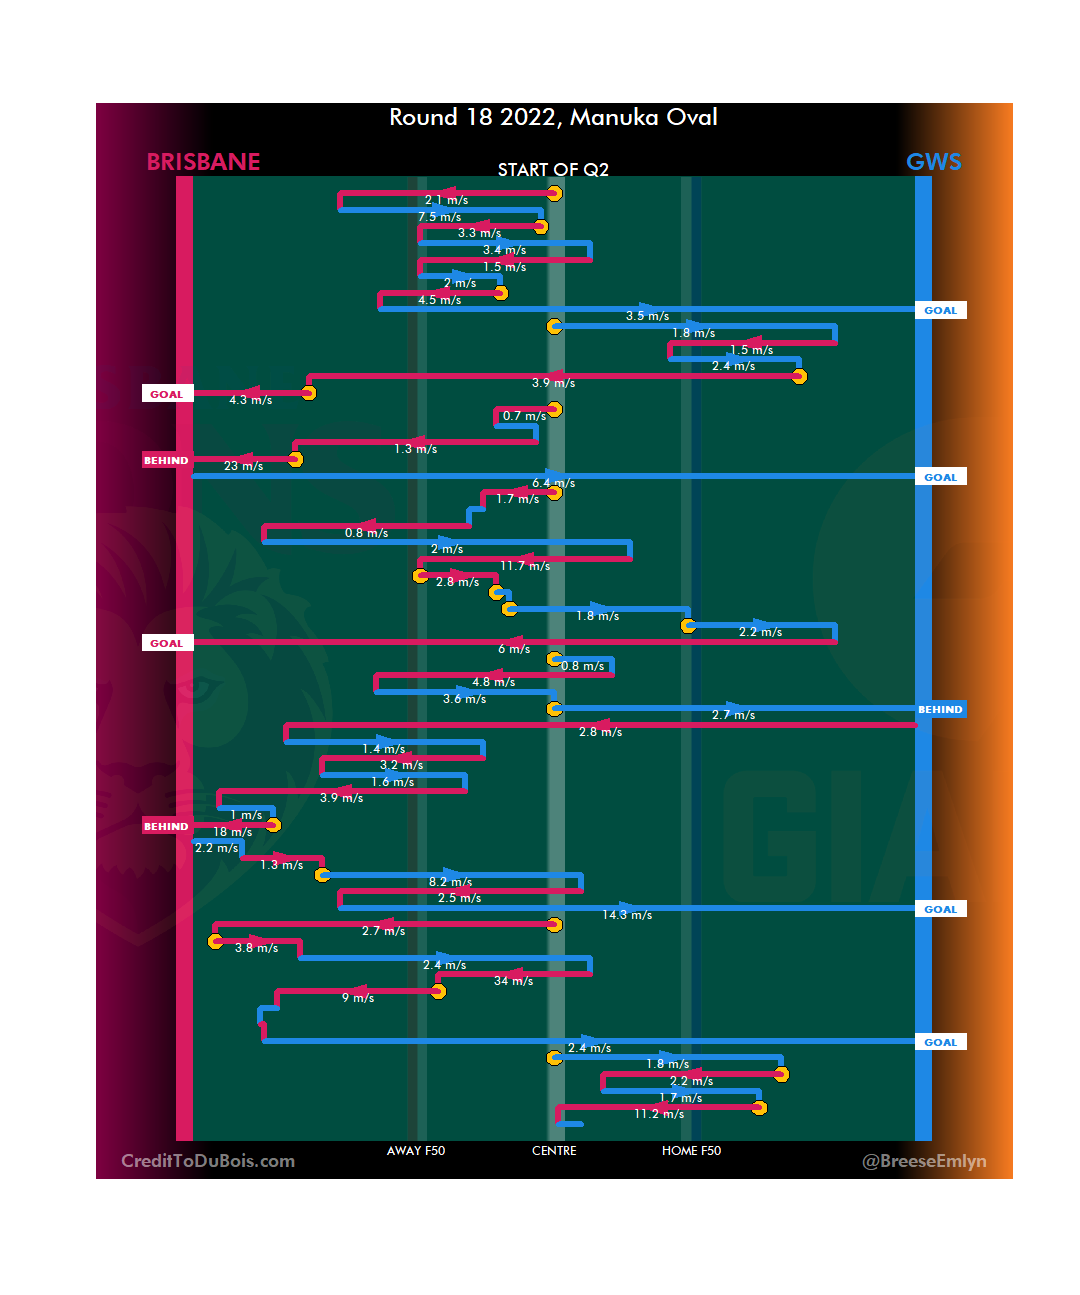
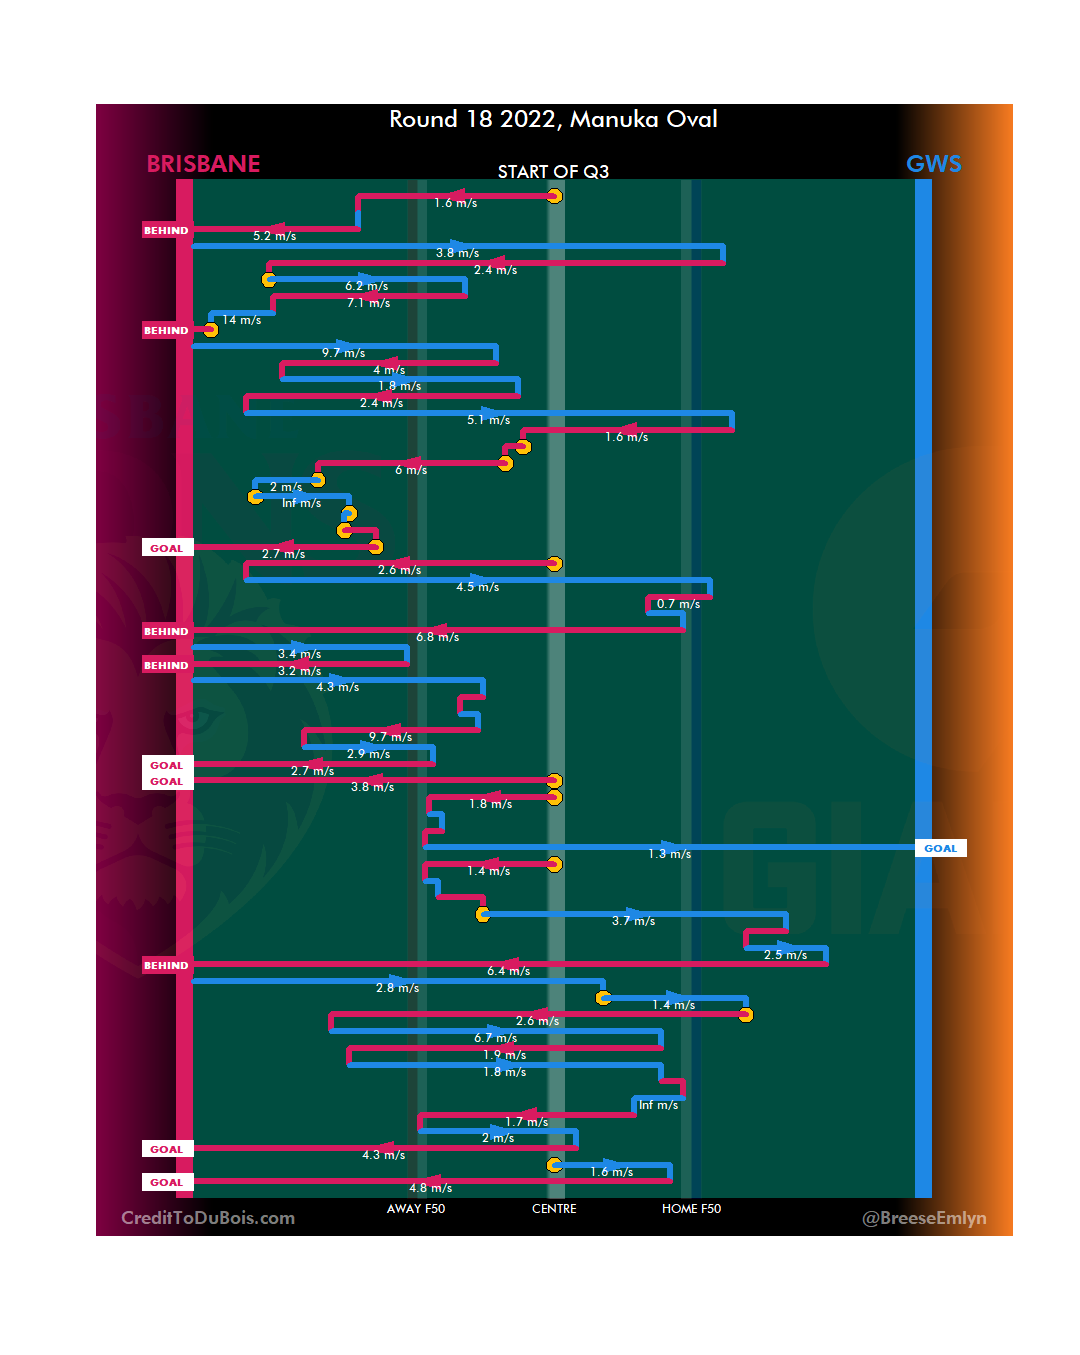
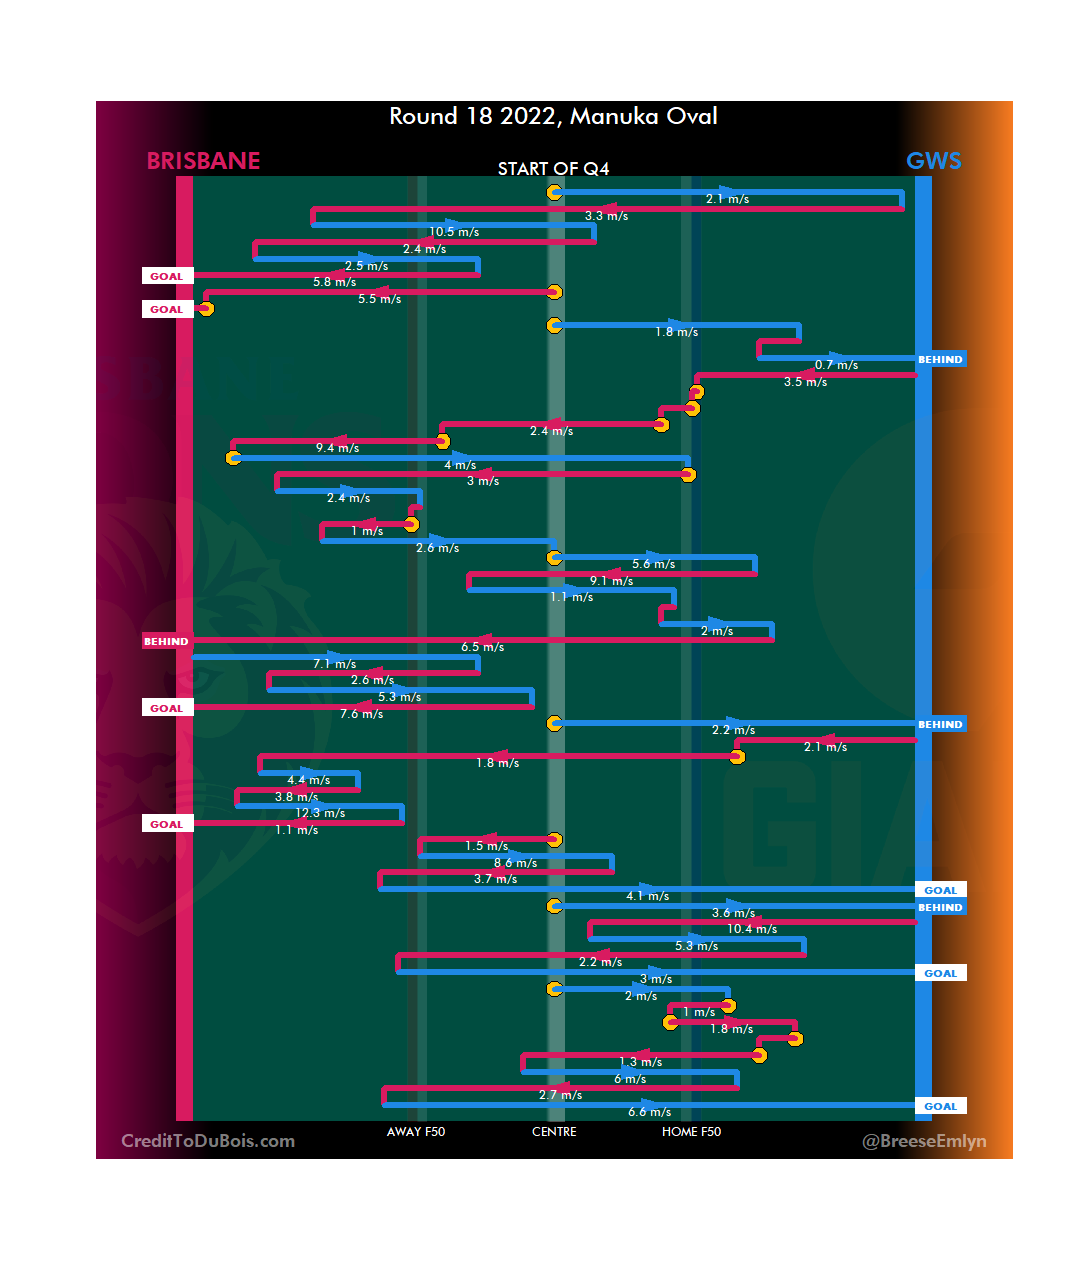
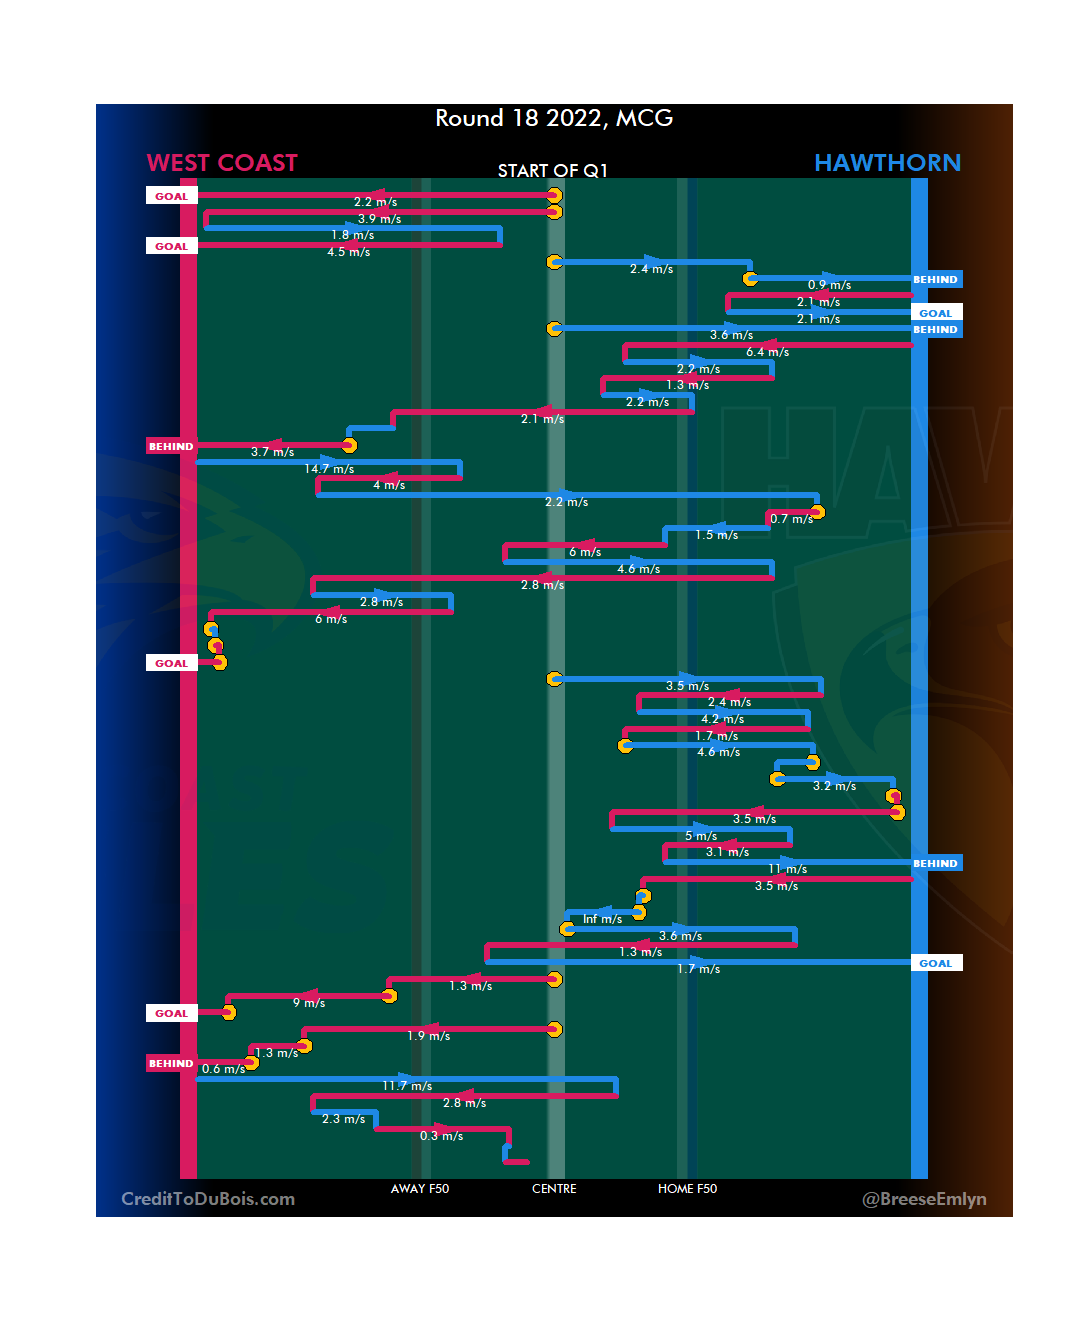
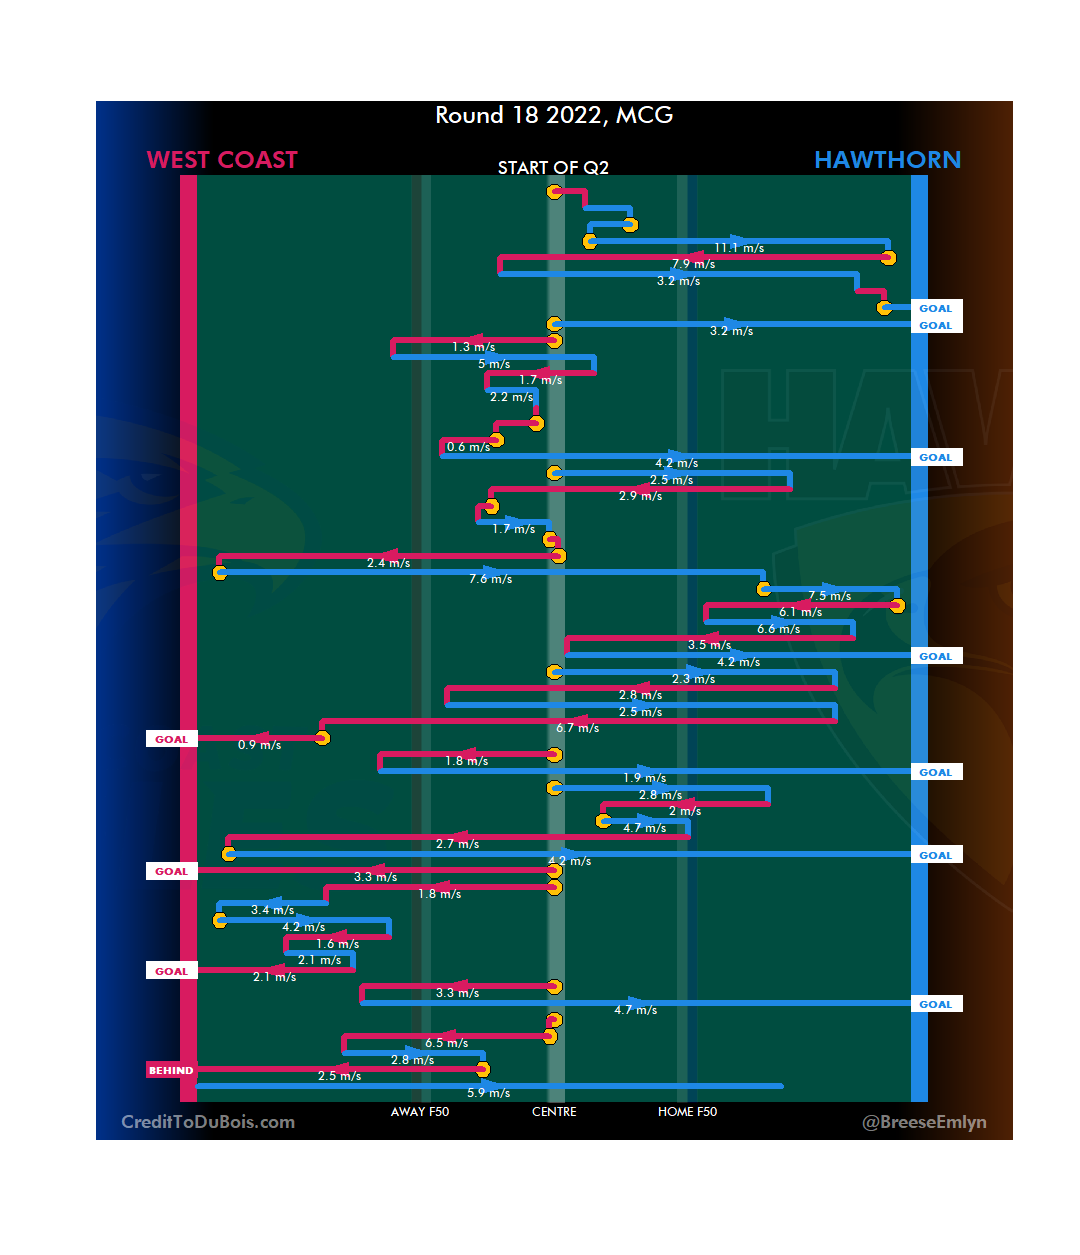
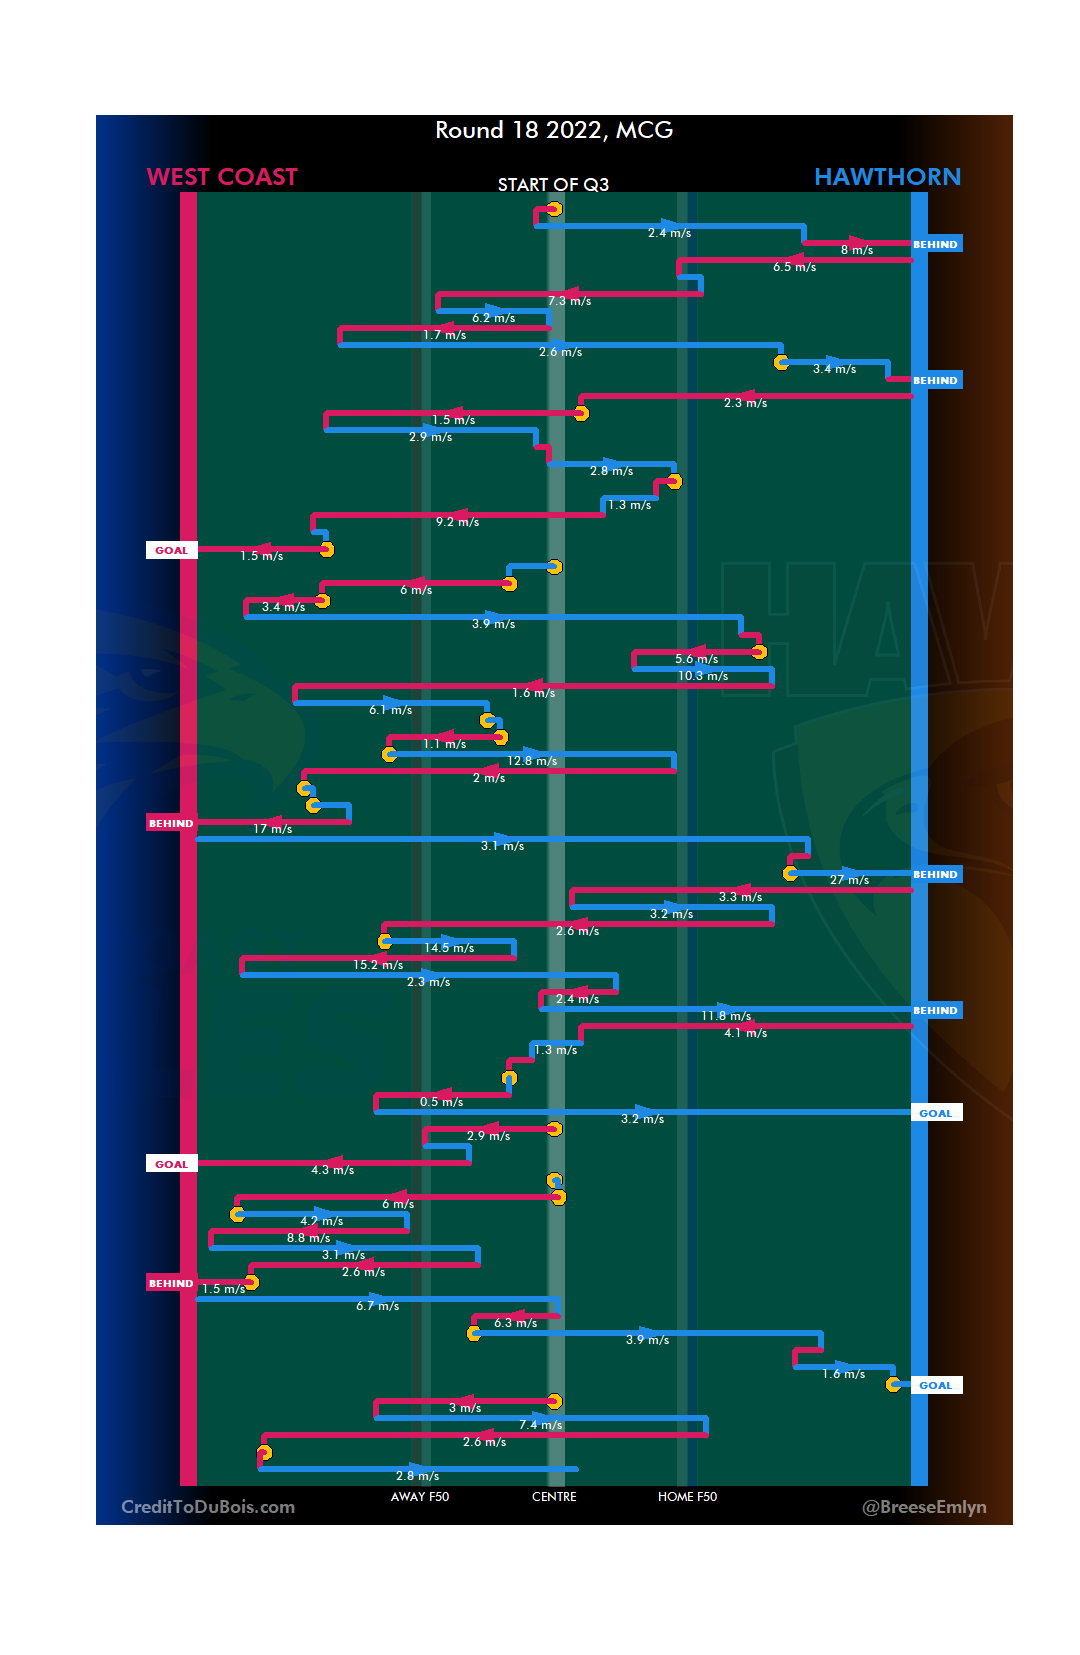
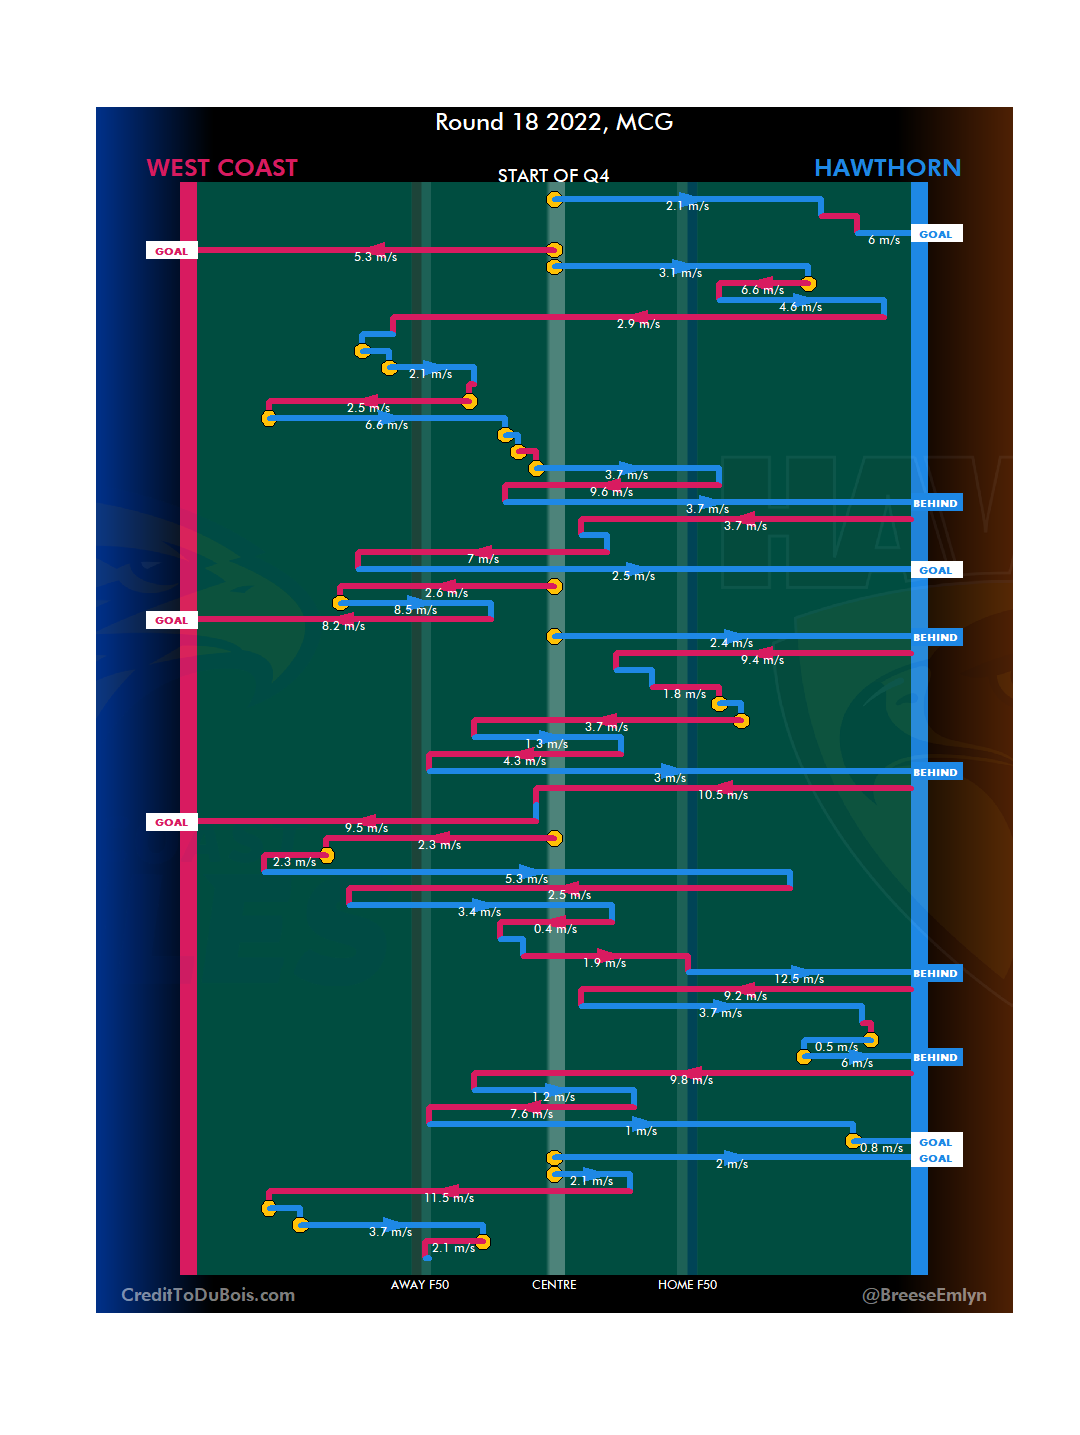
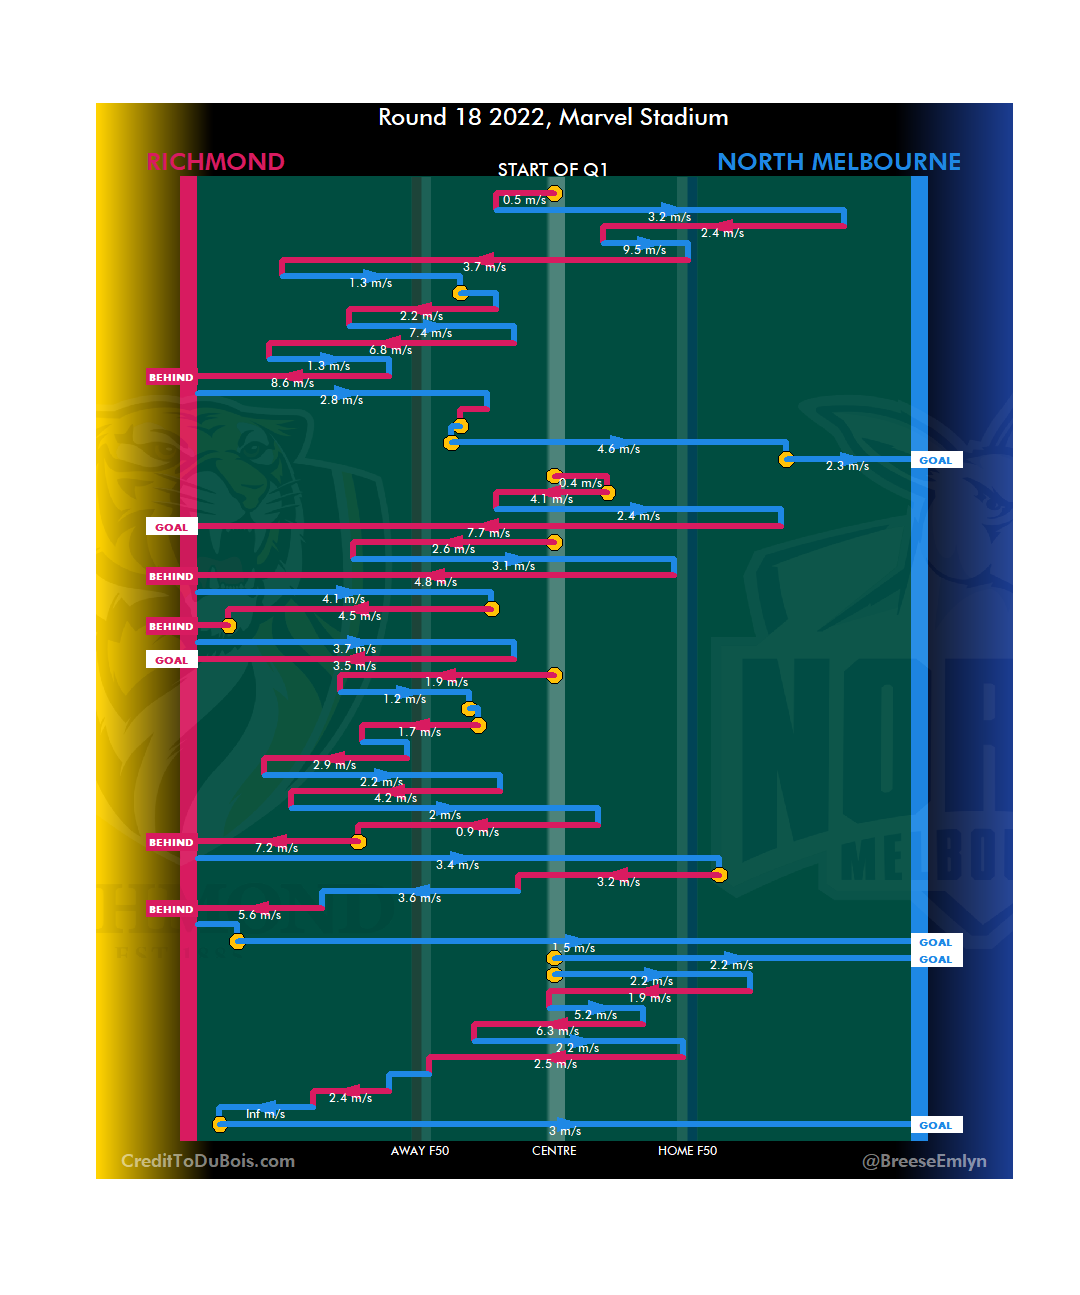
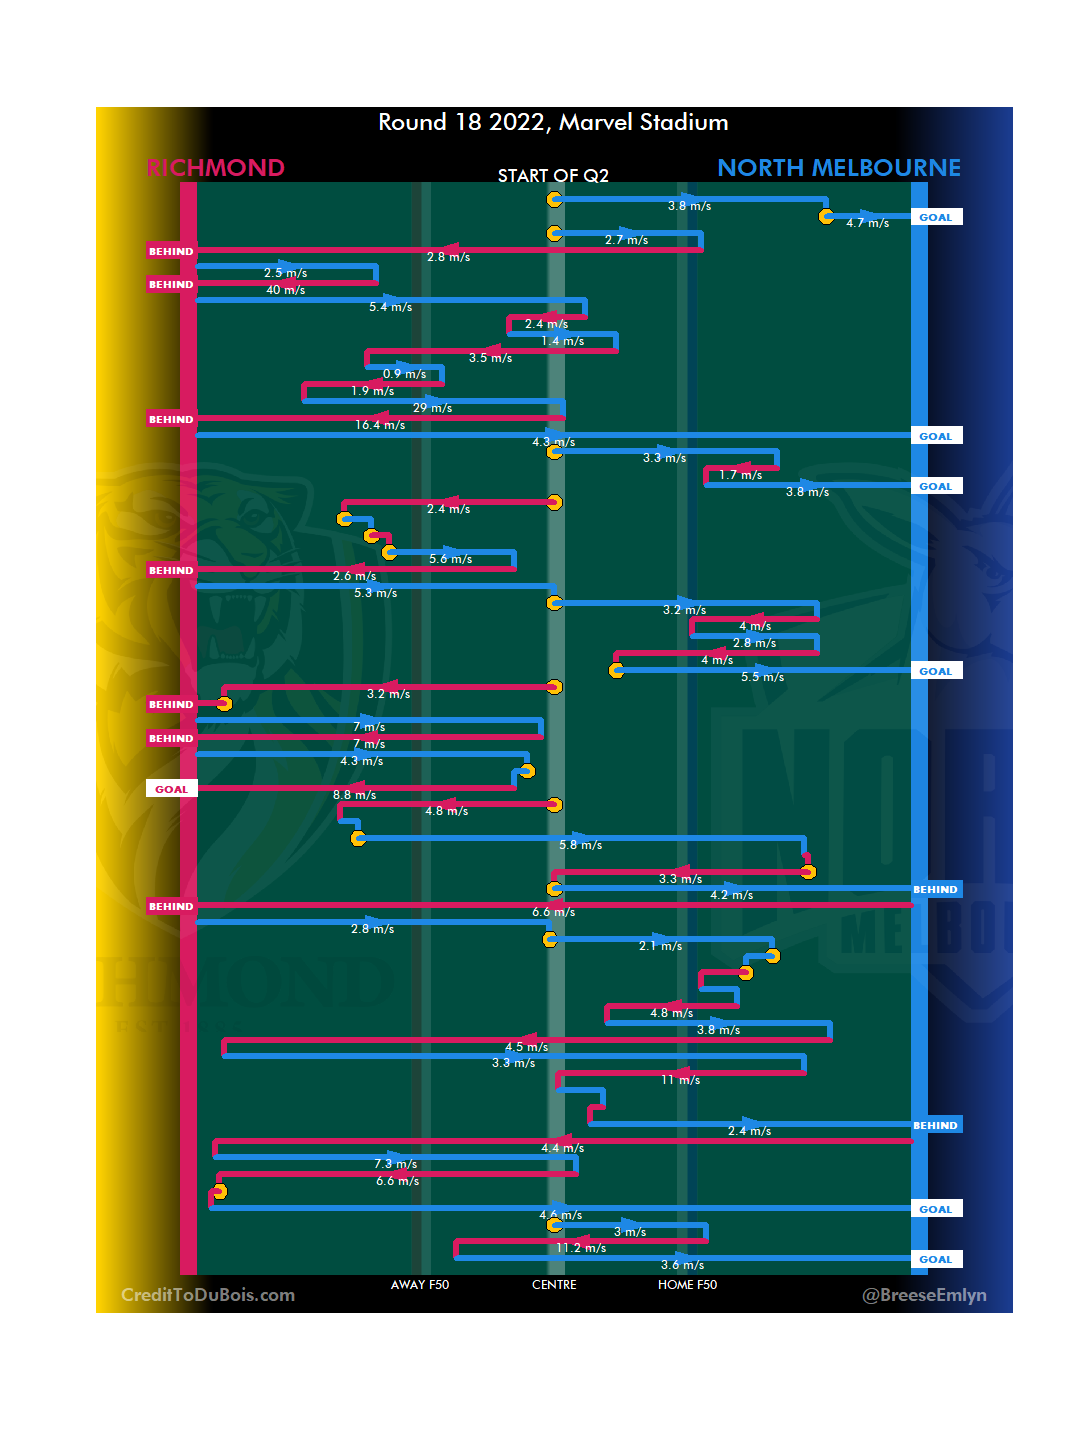
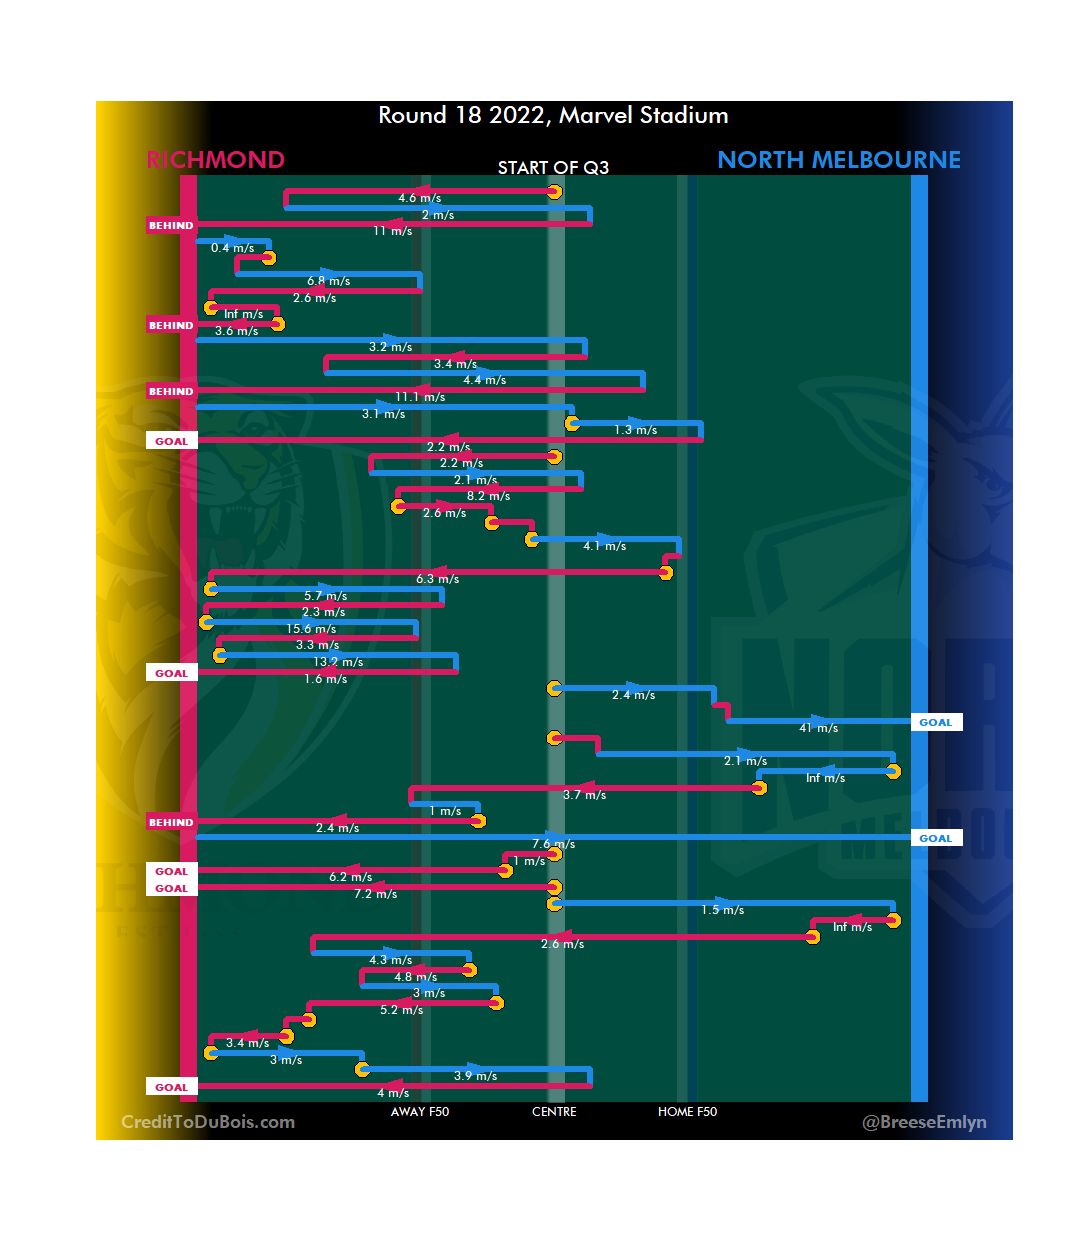
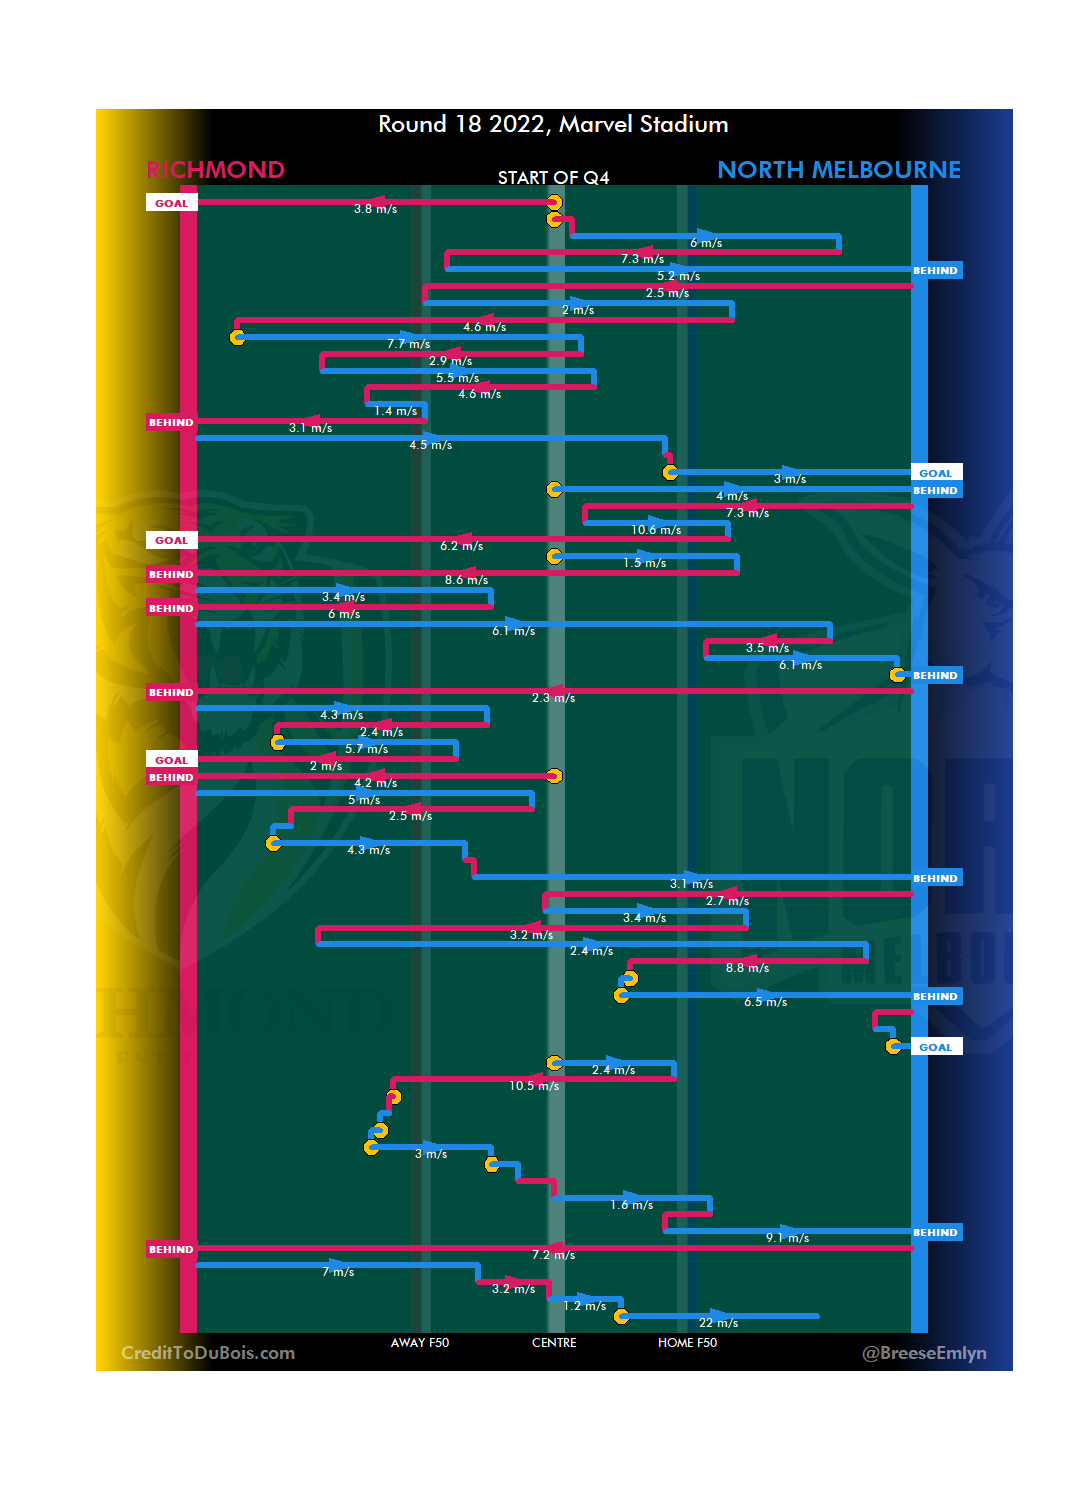
A quick post of some notables re the end to Sunday’s game
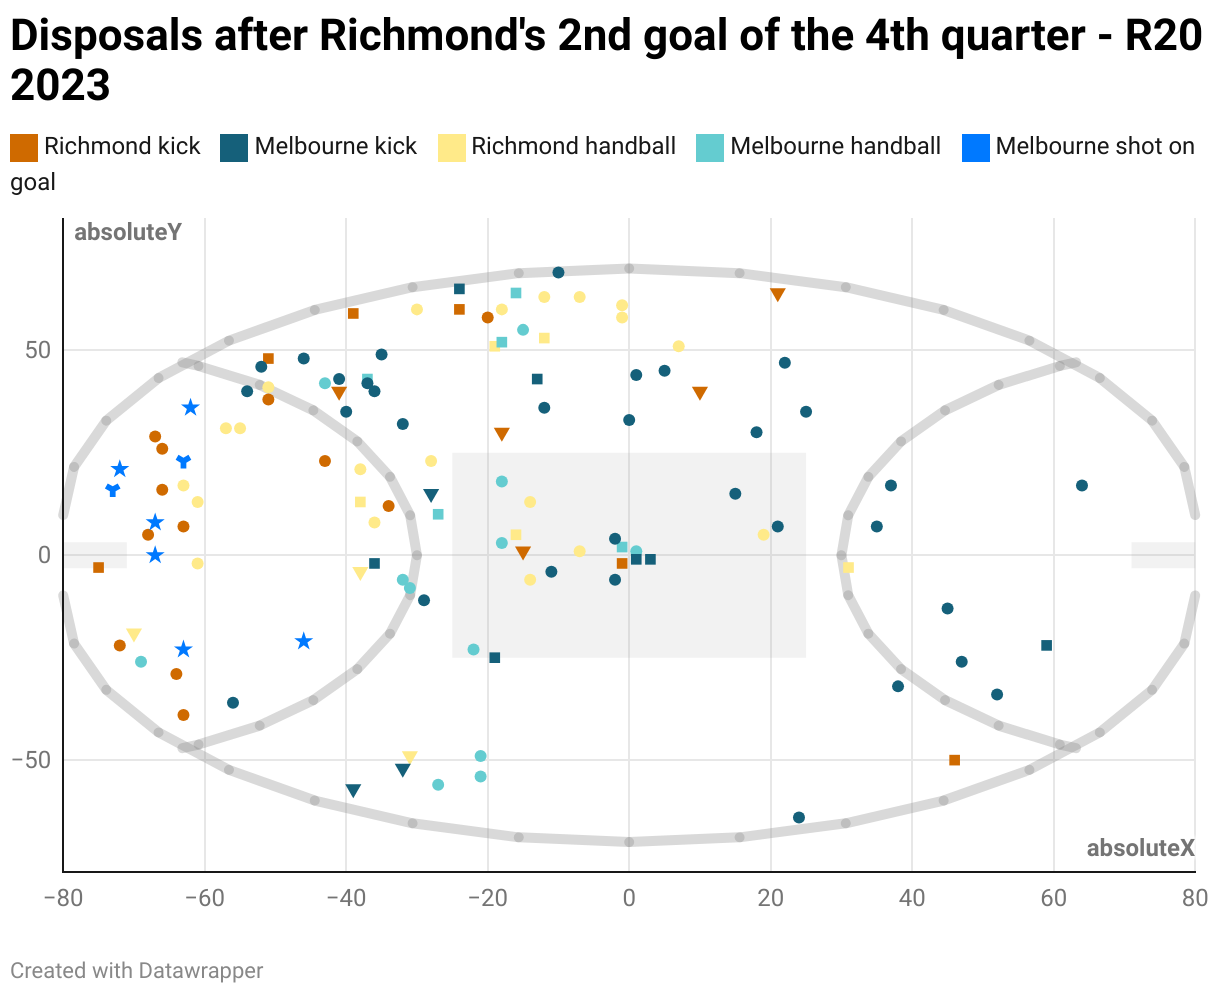
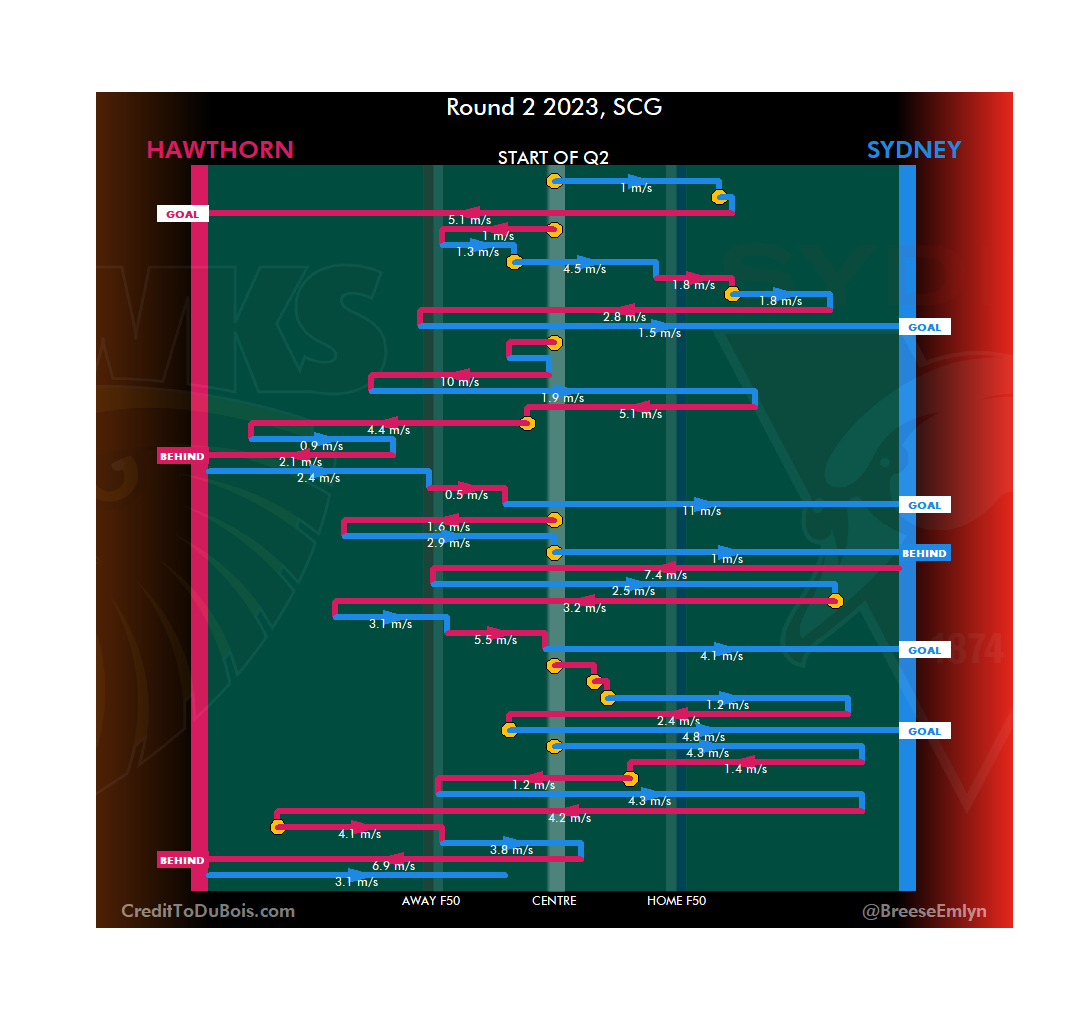
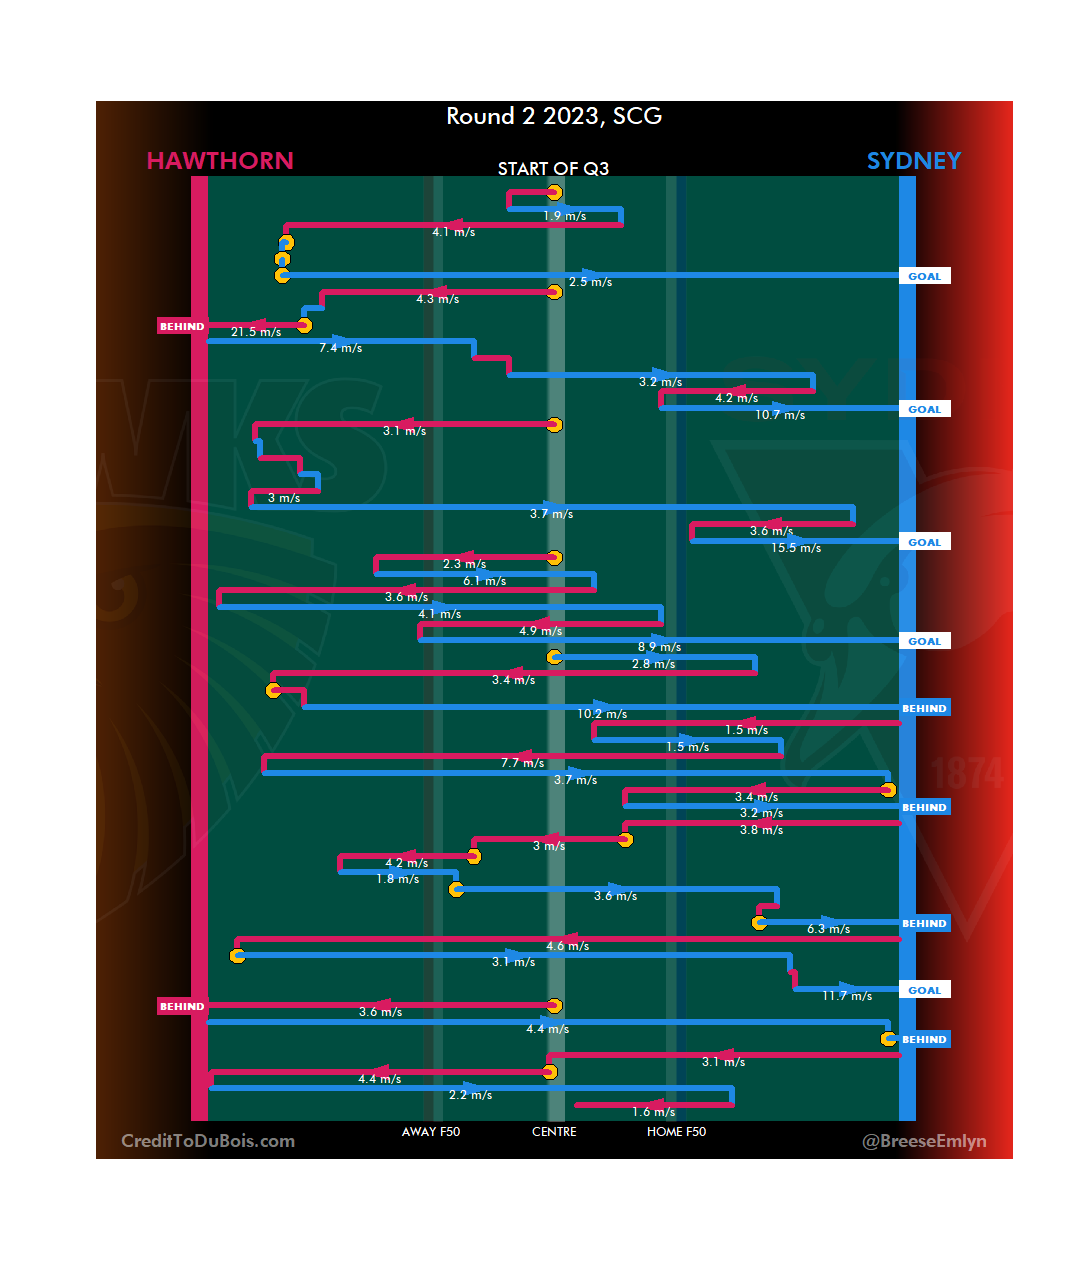
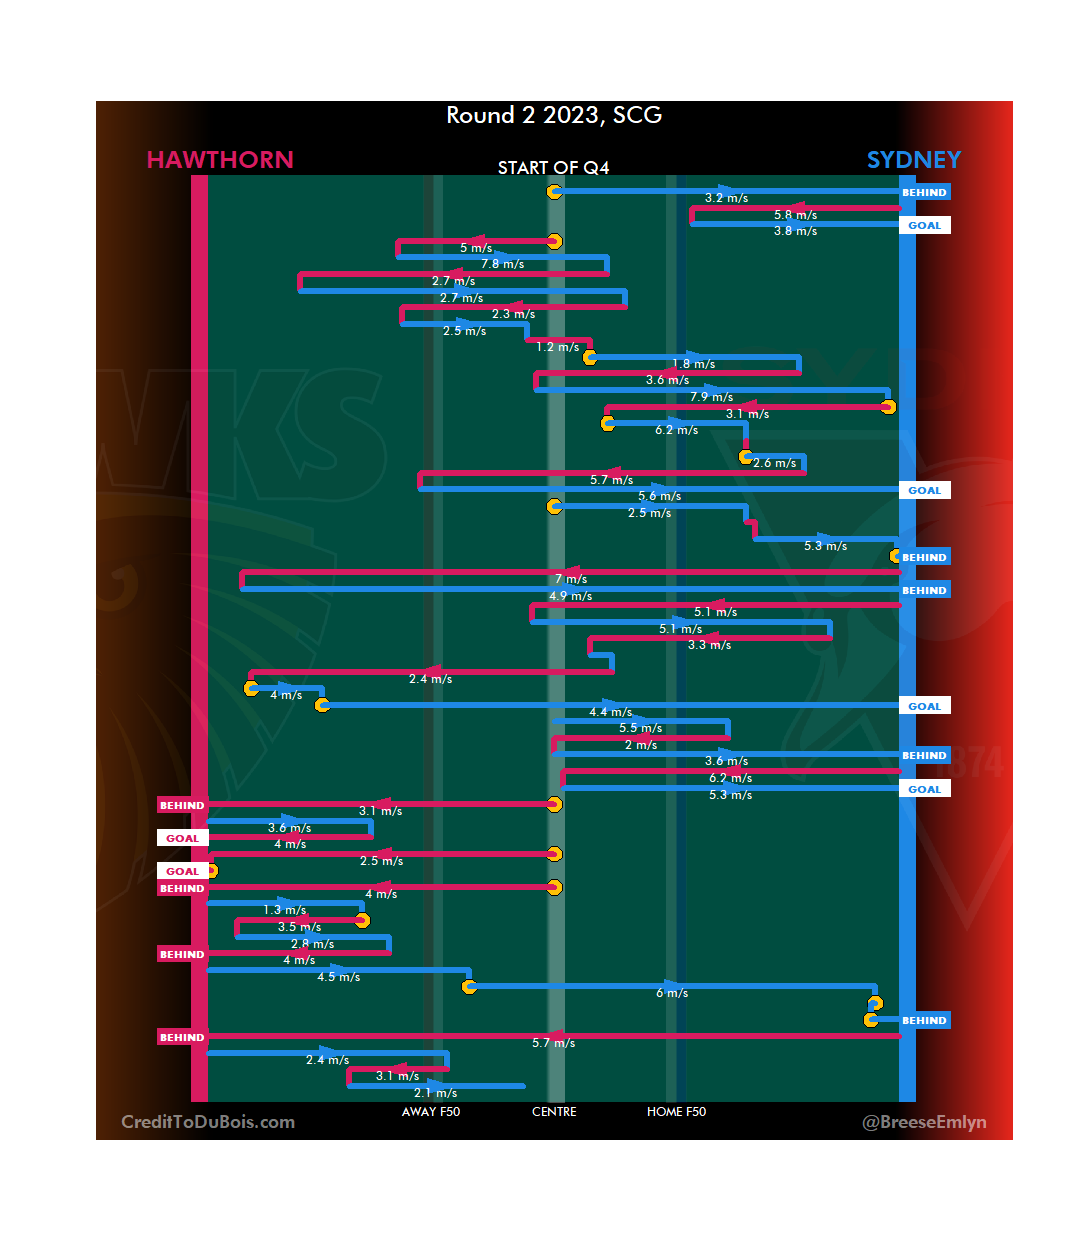
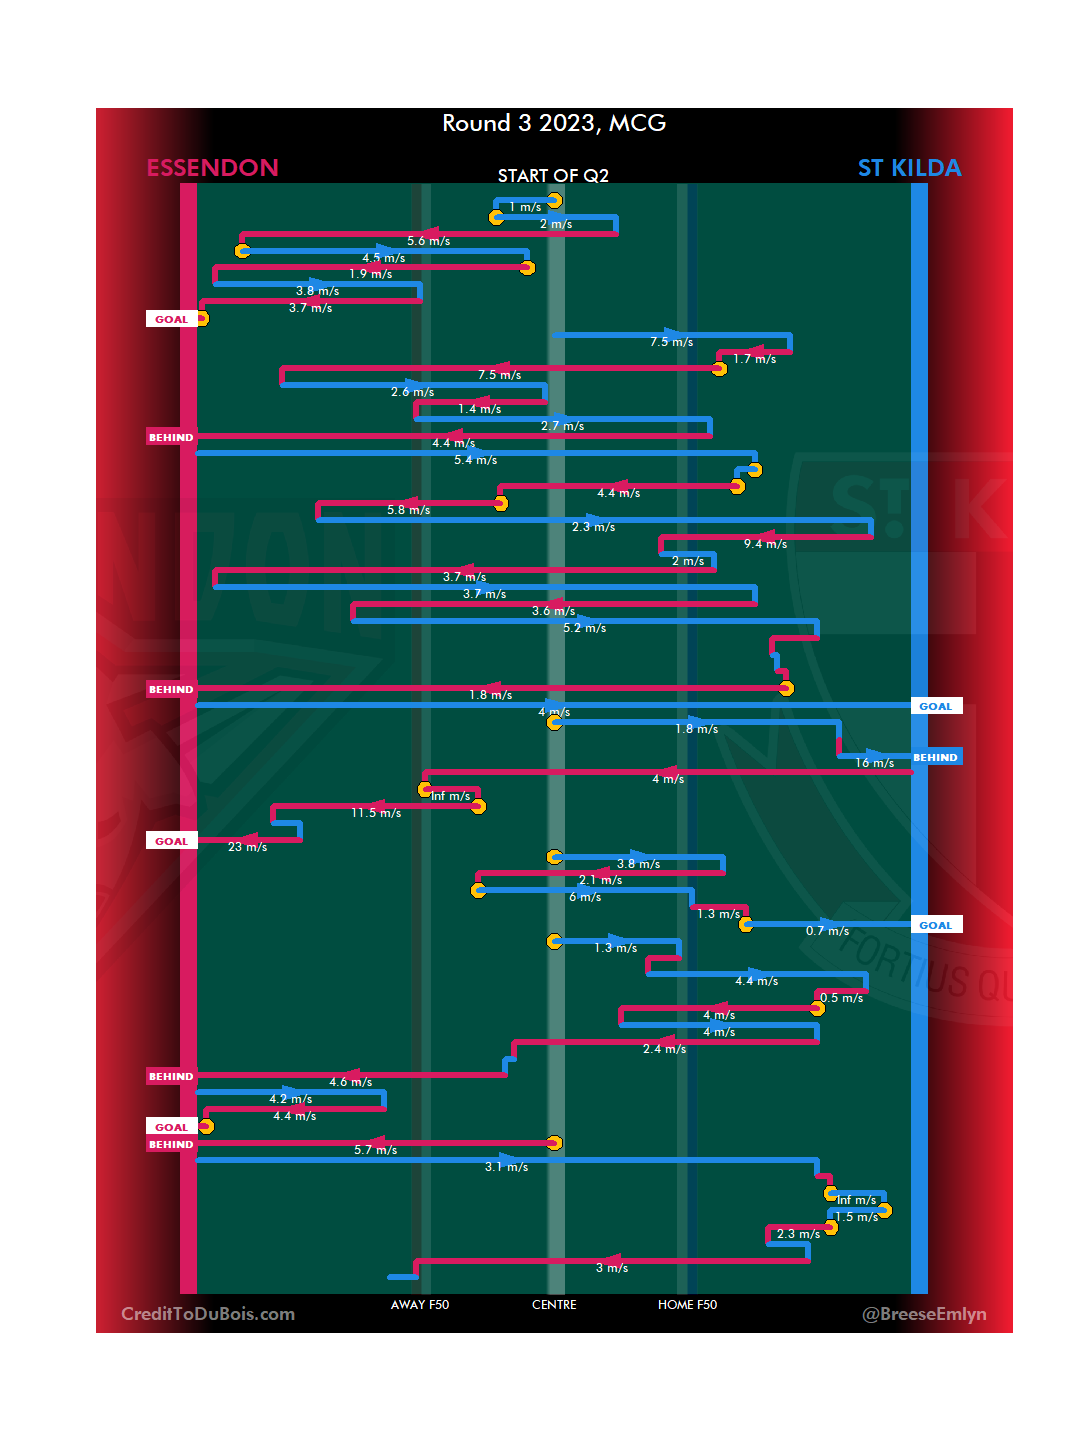
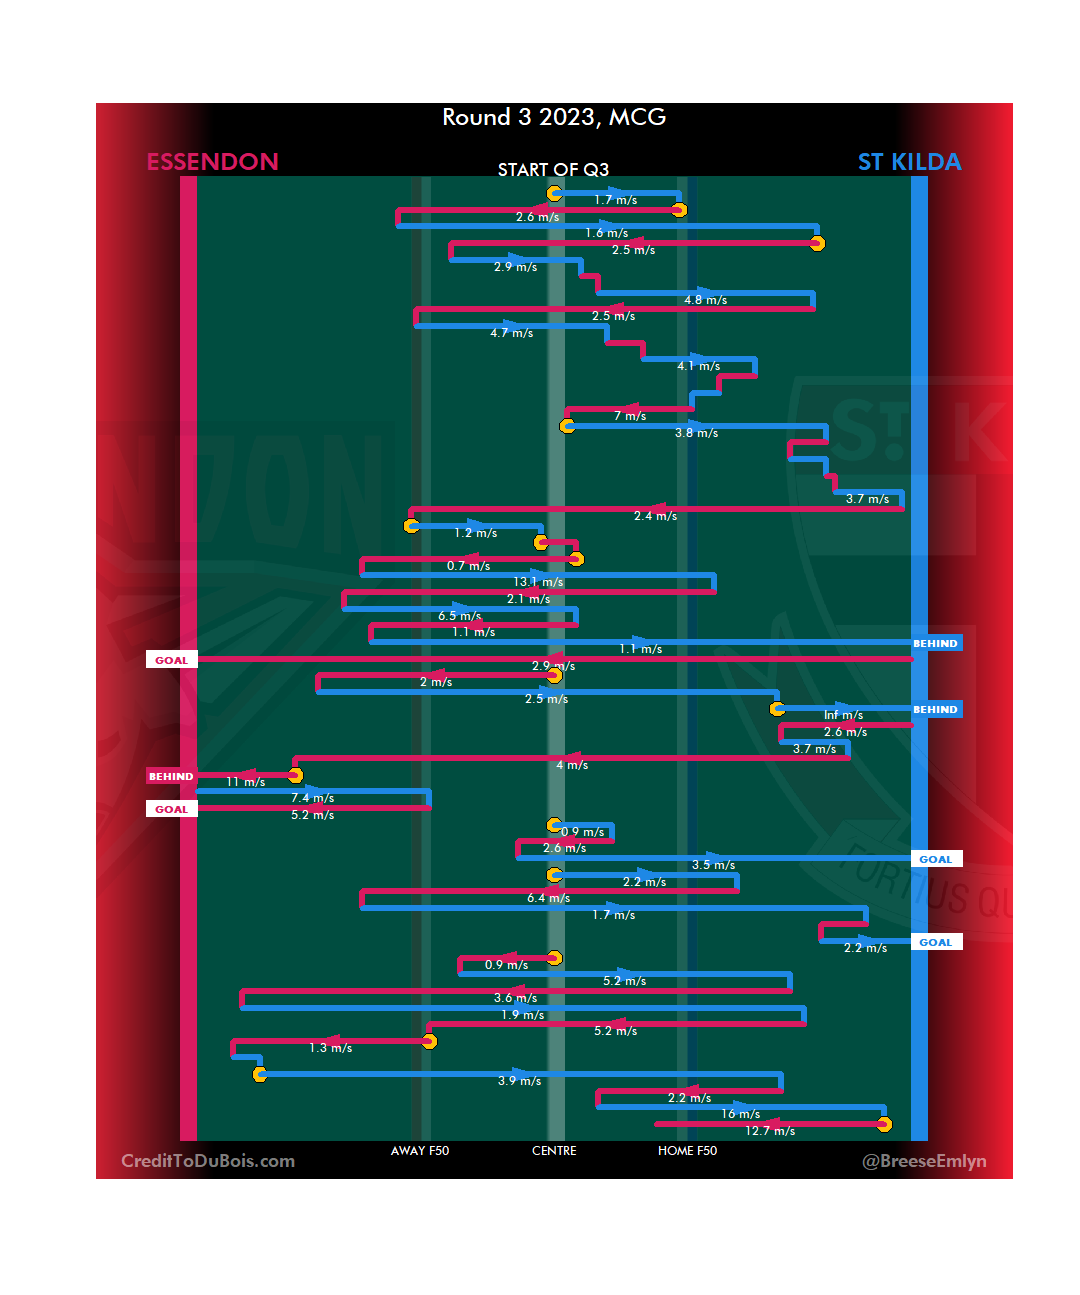
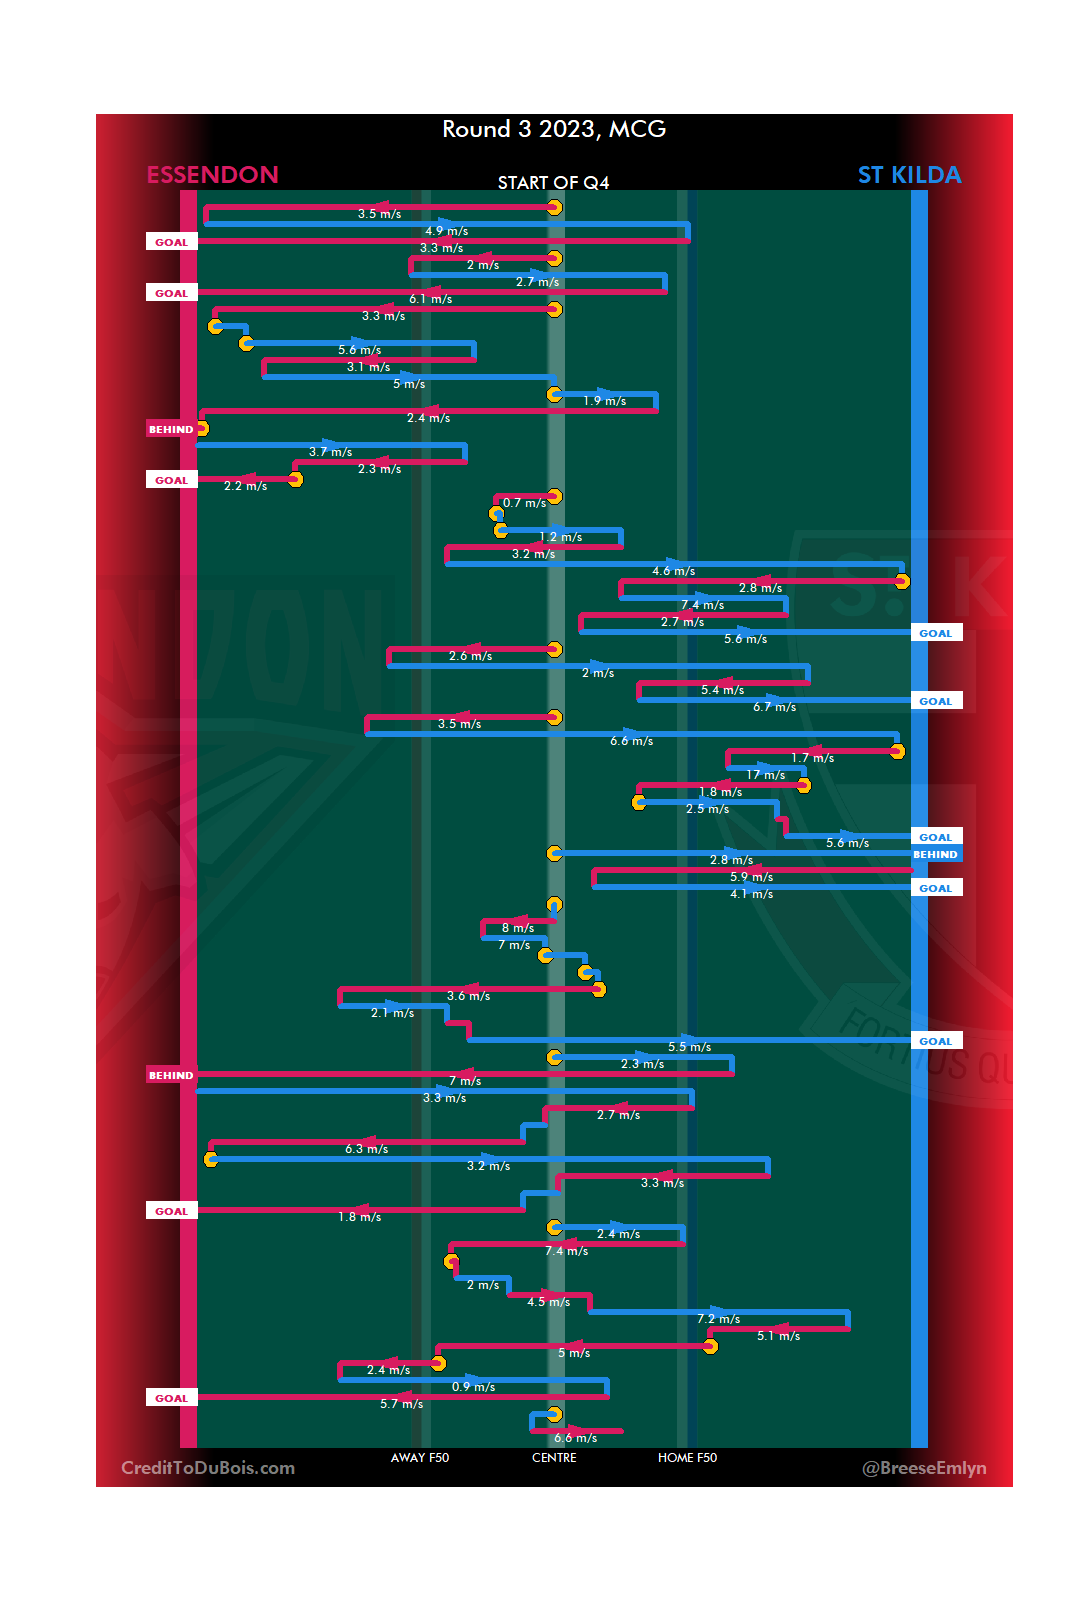
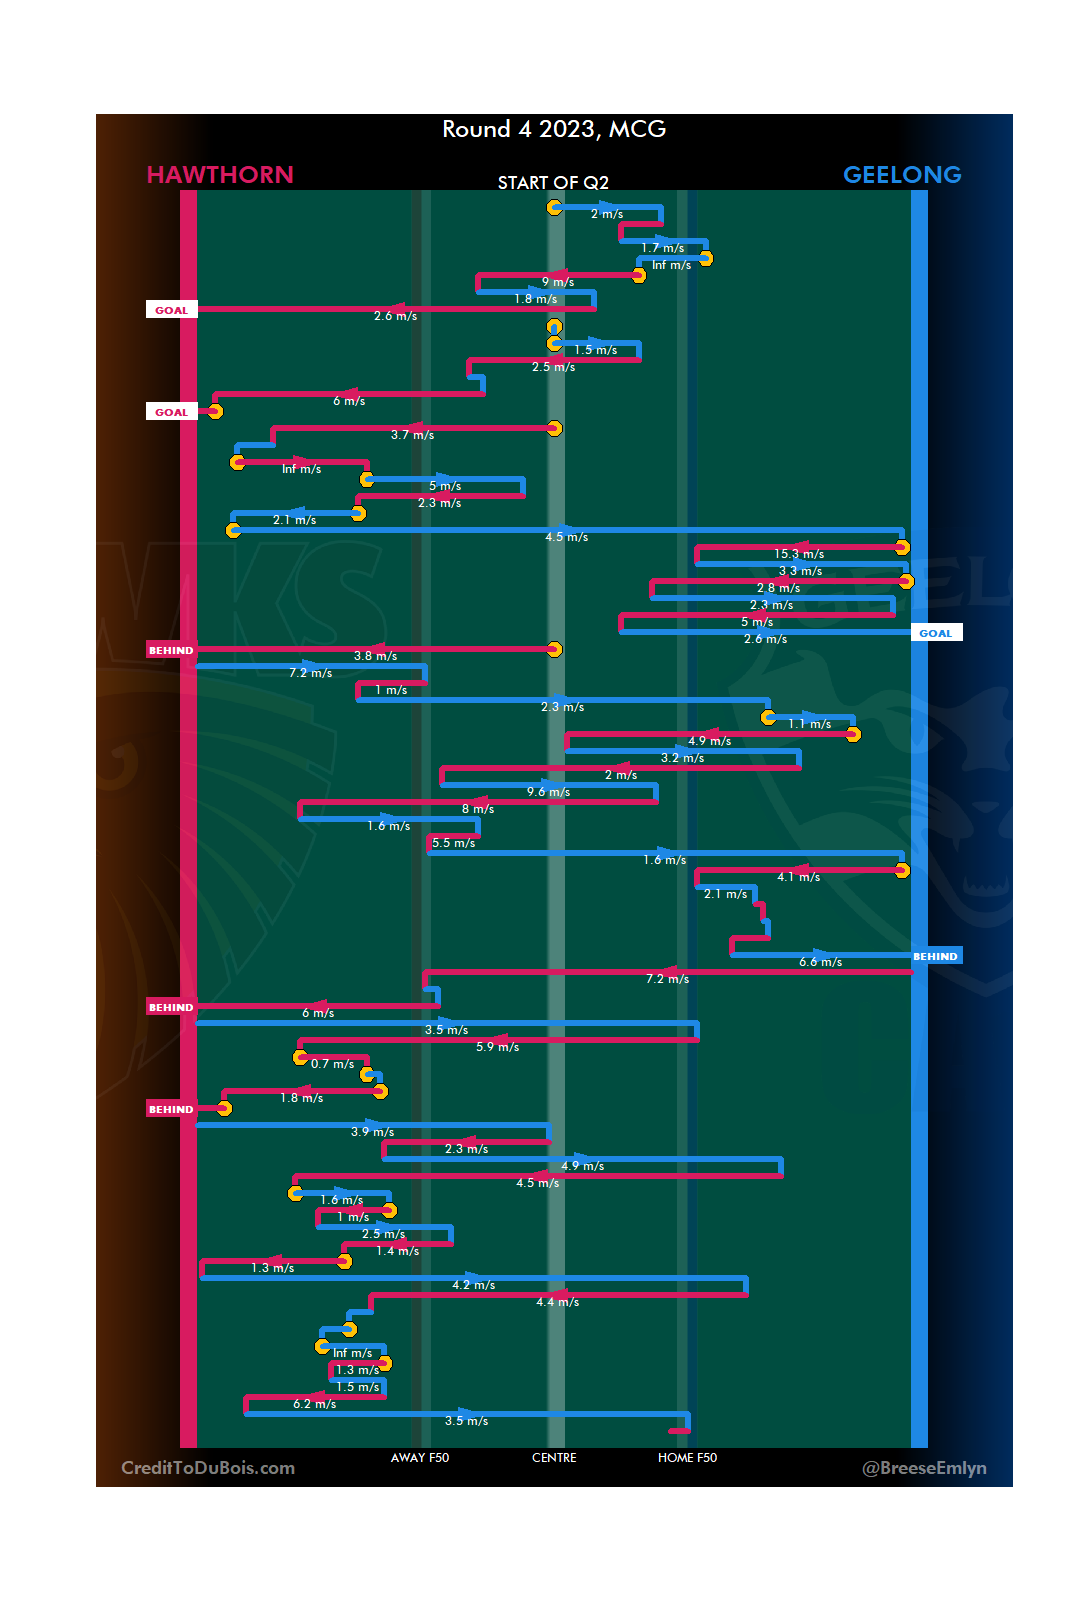
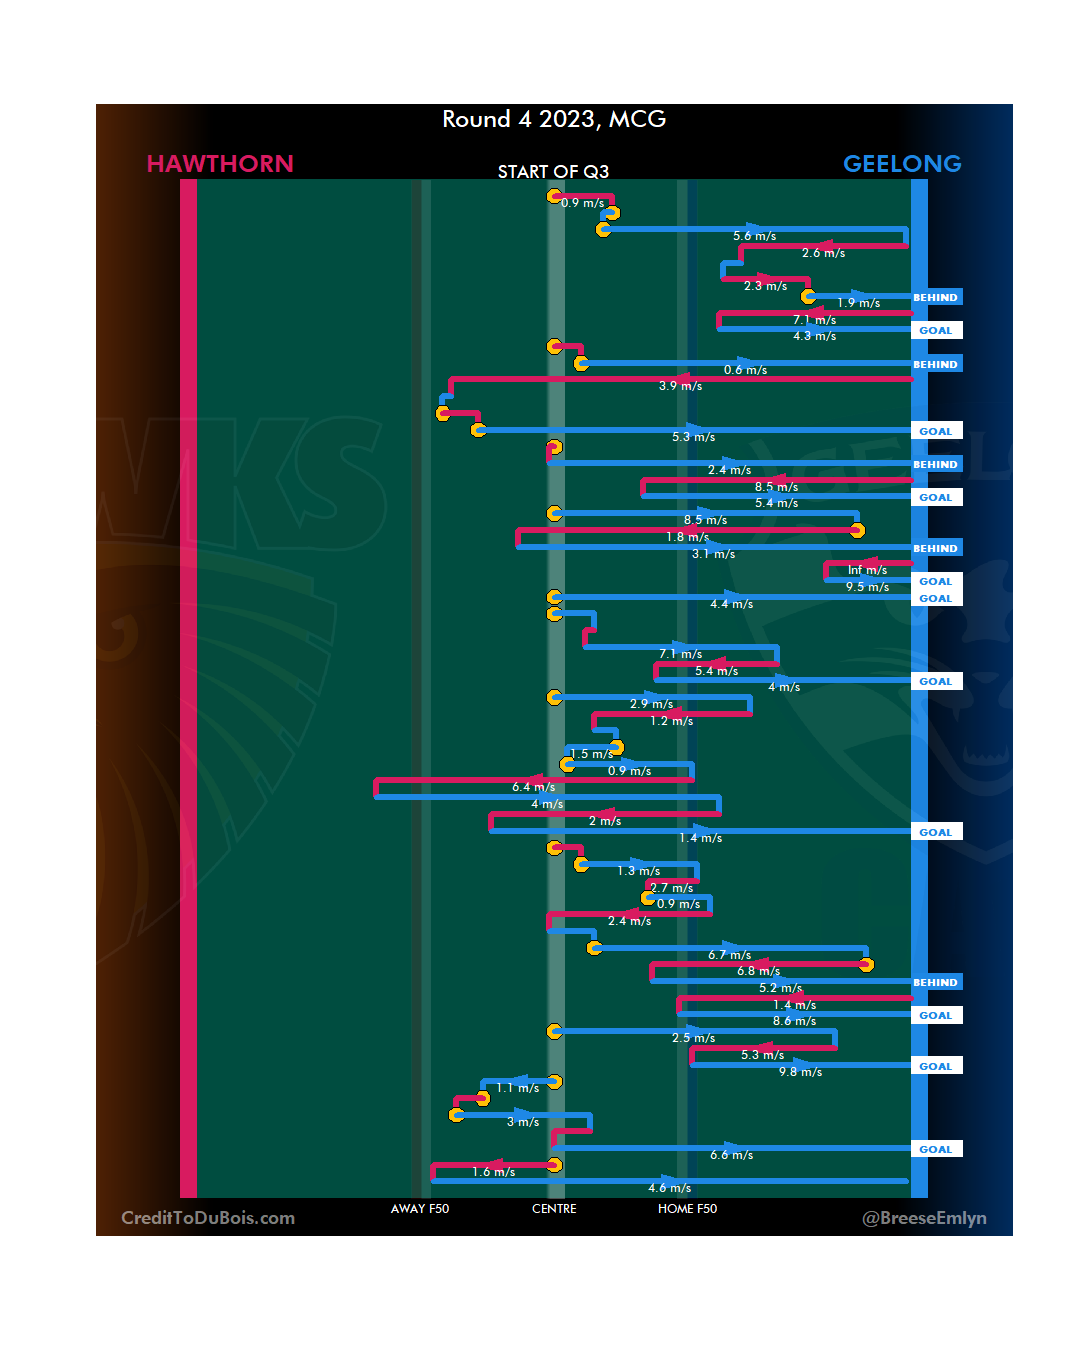
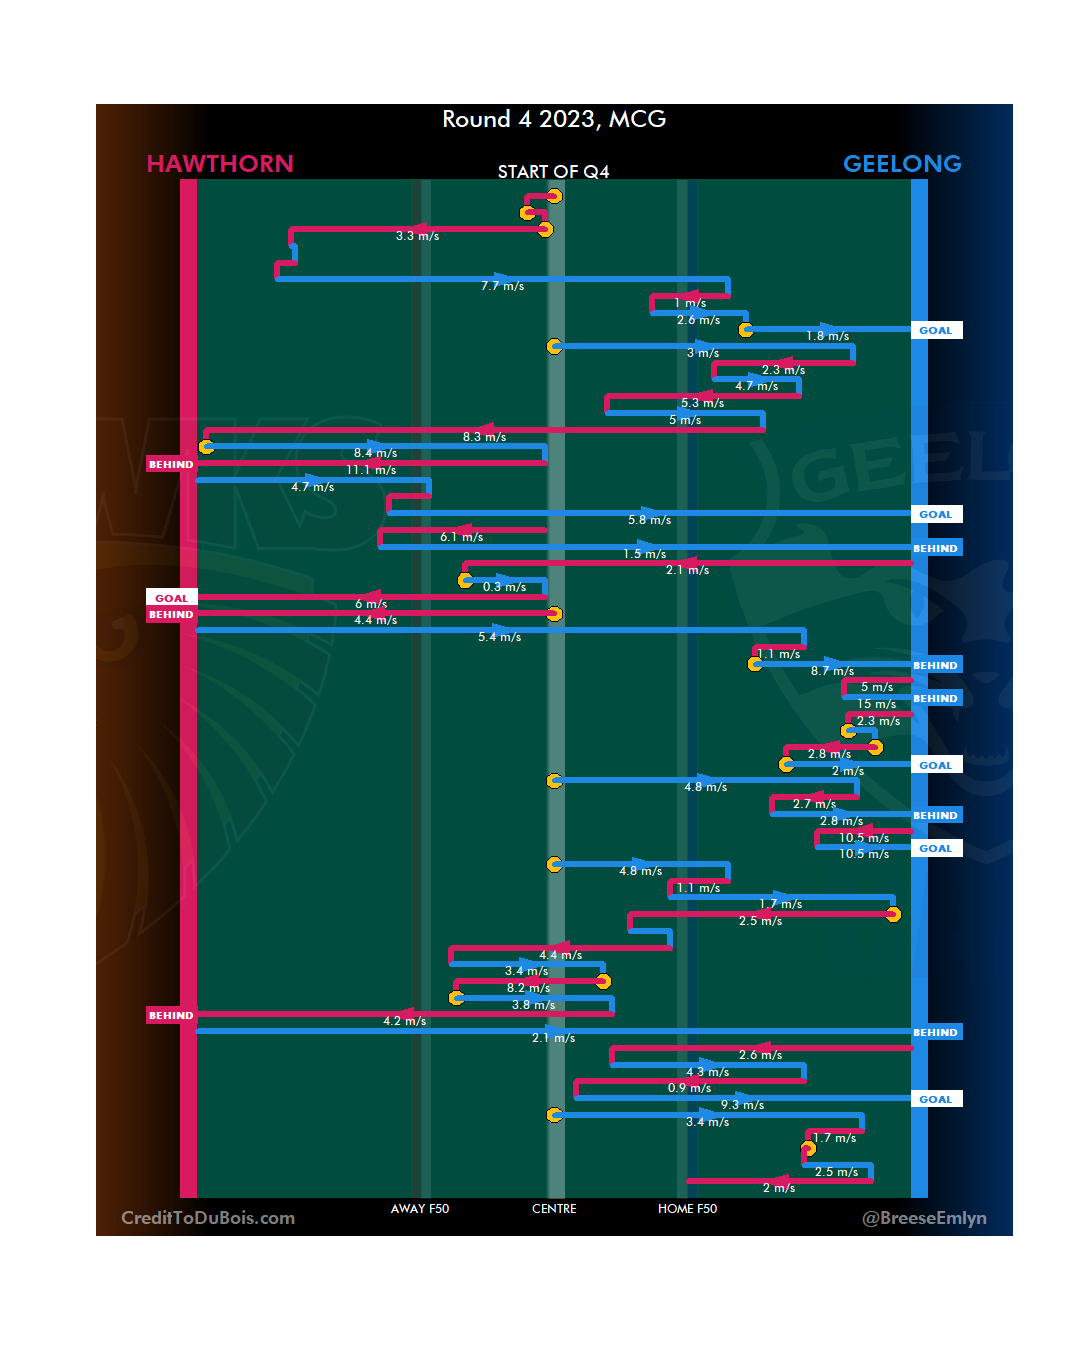
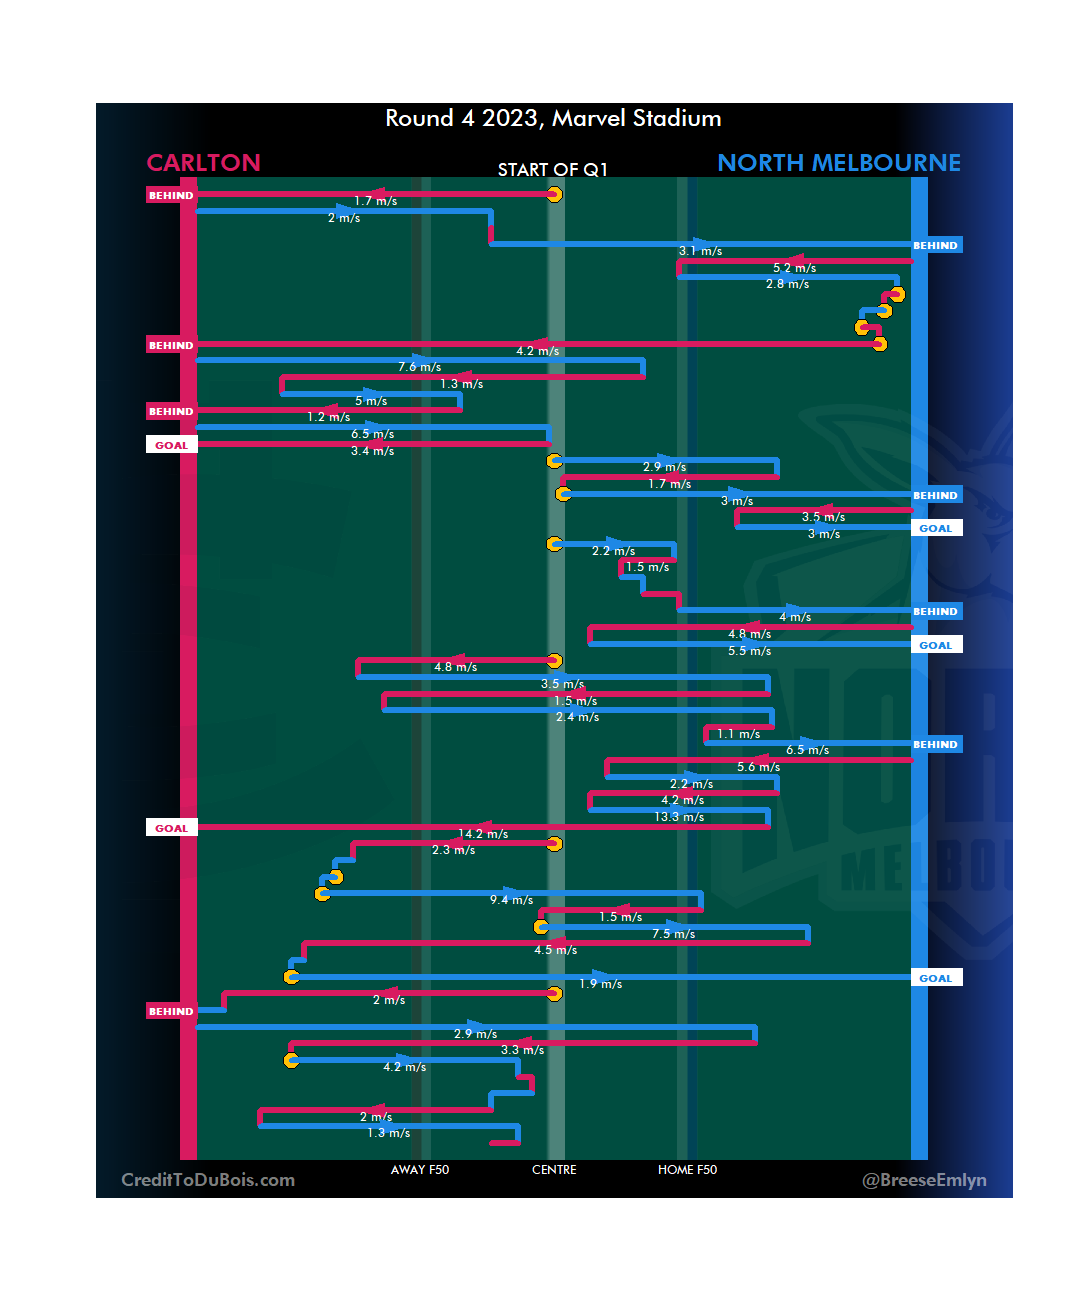
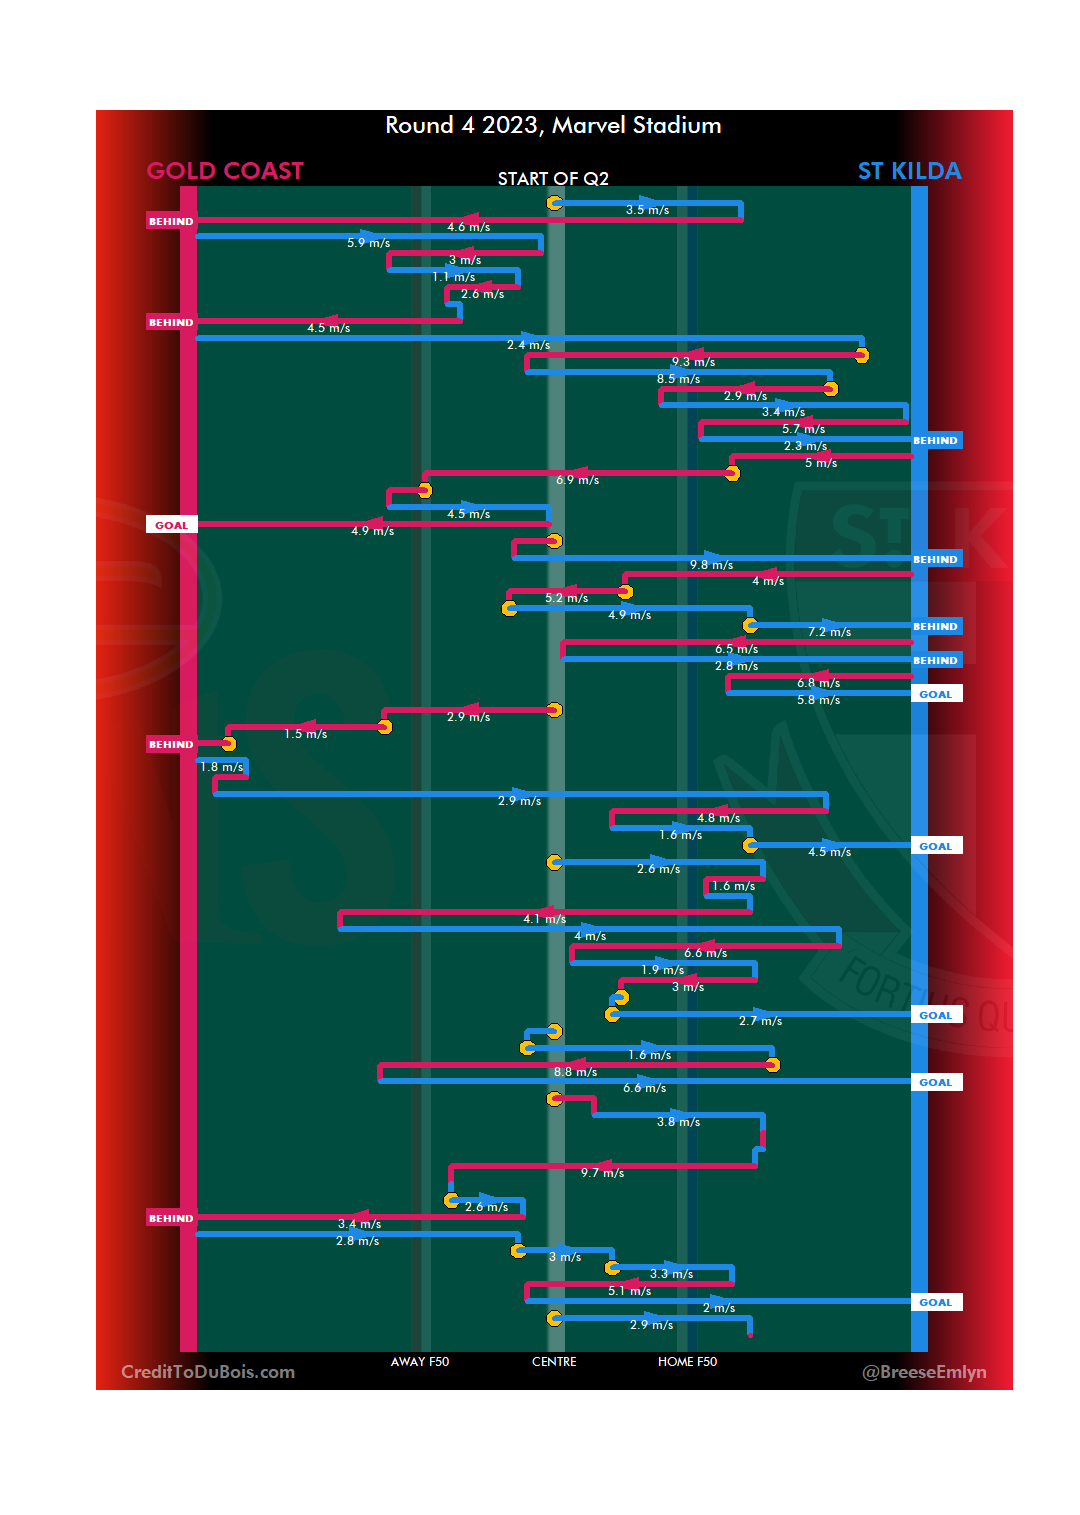
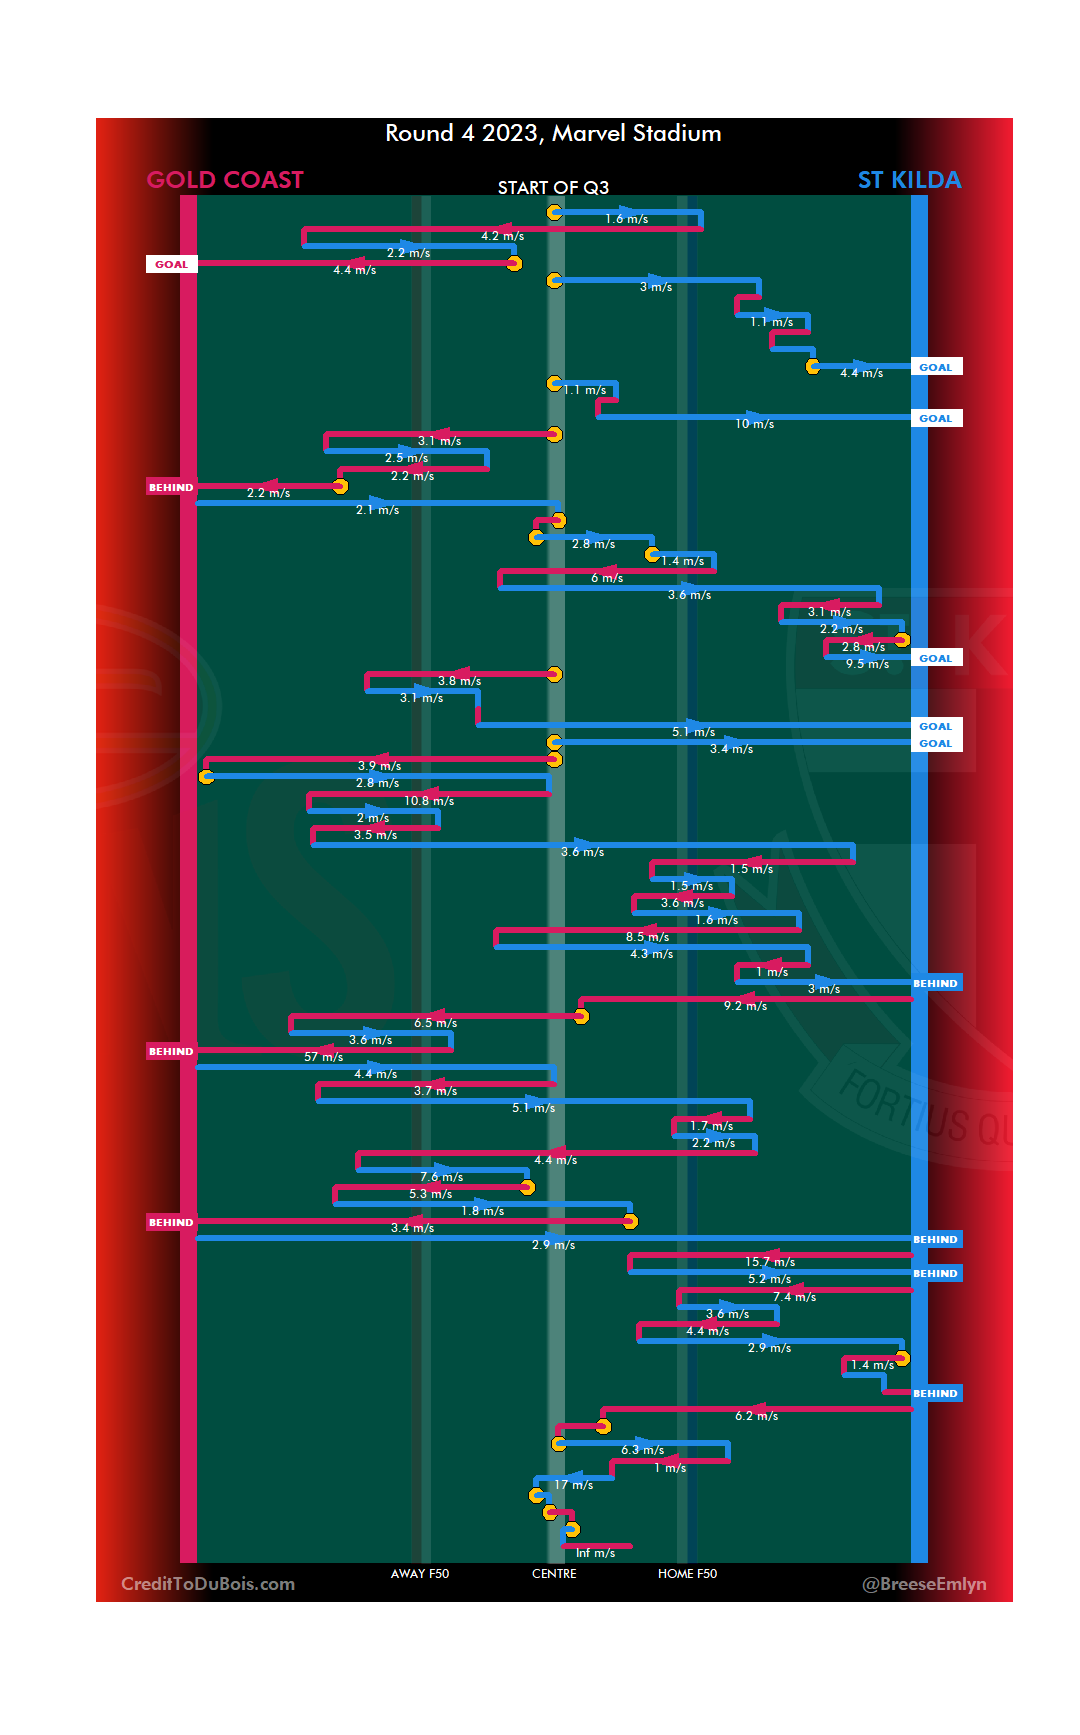
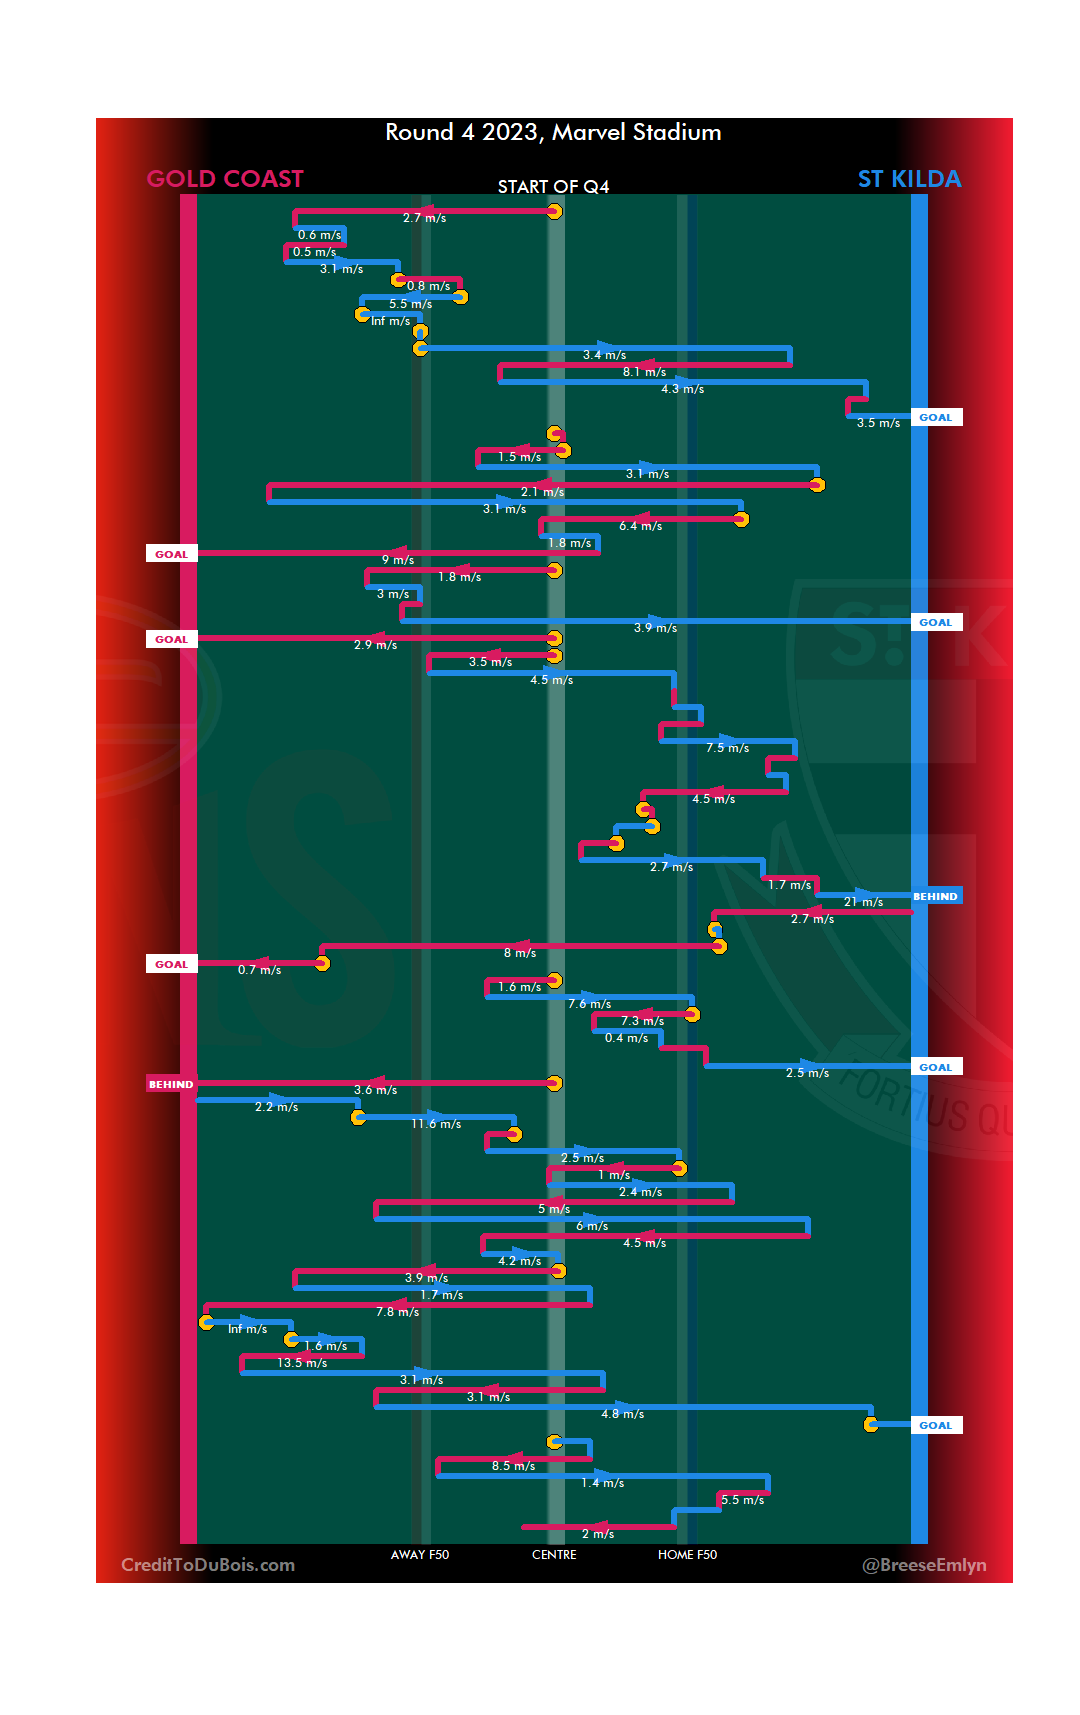
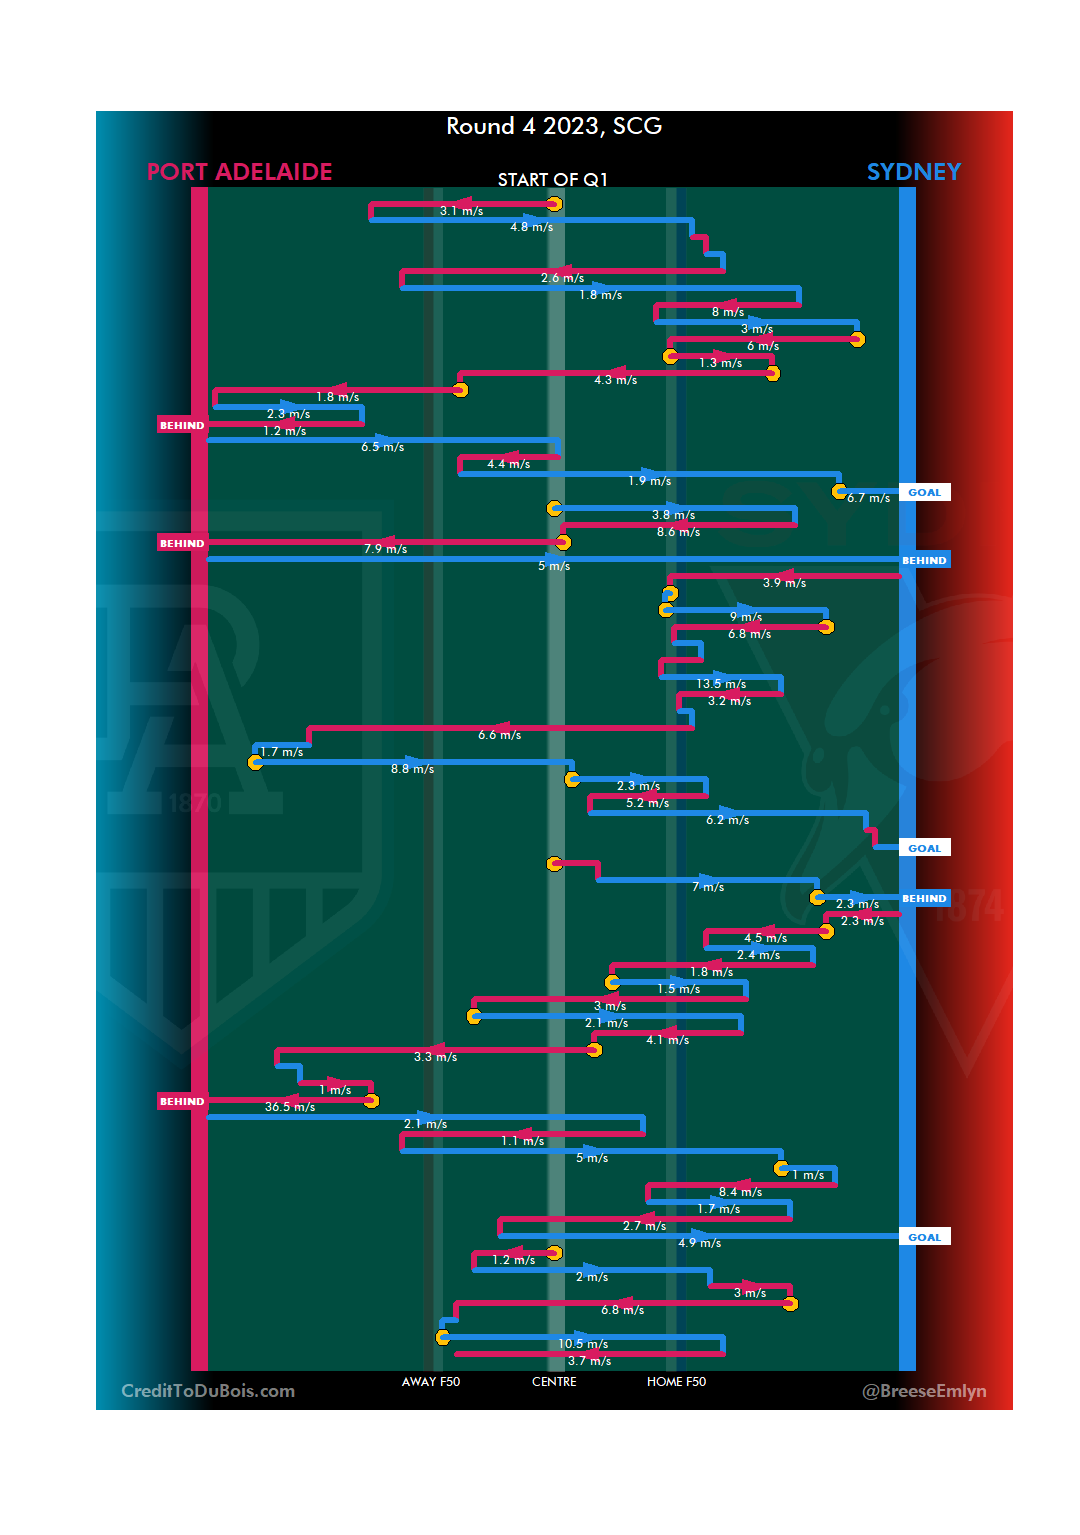
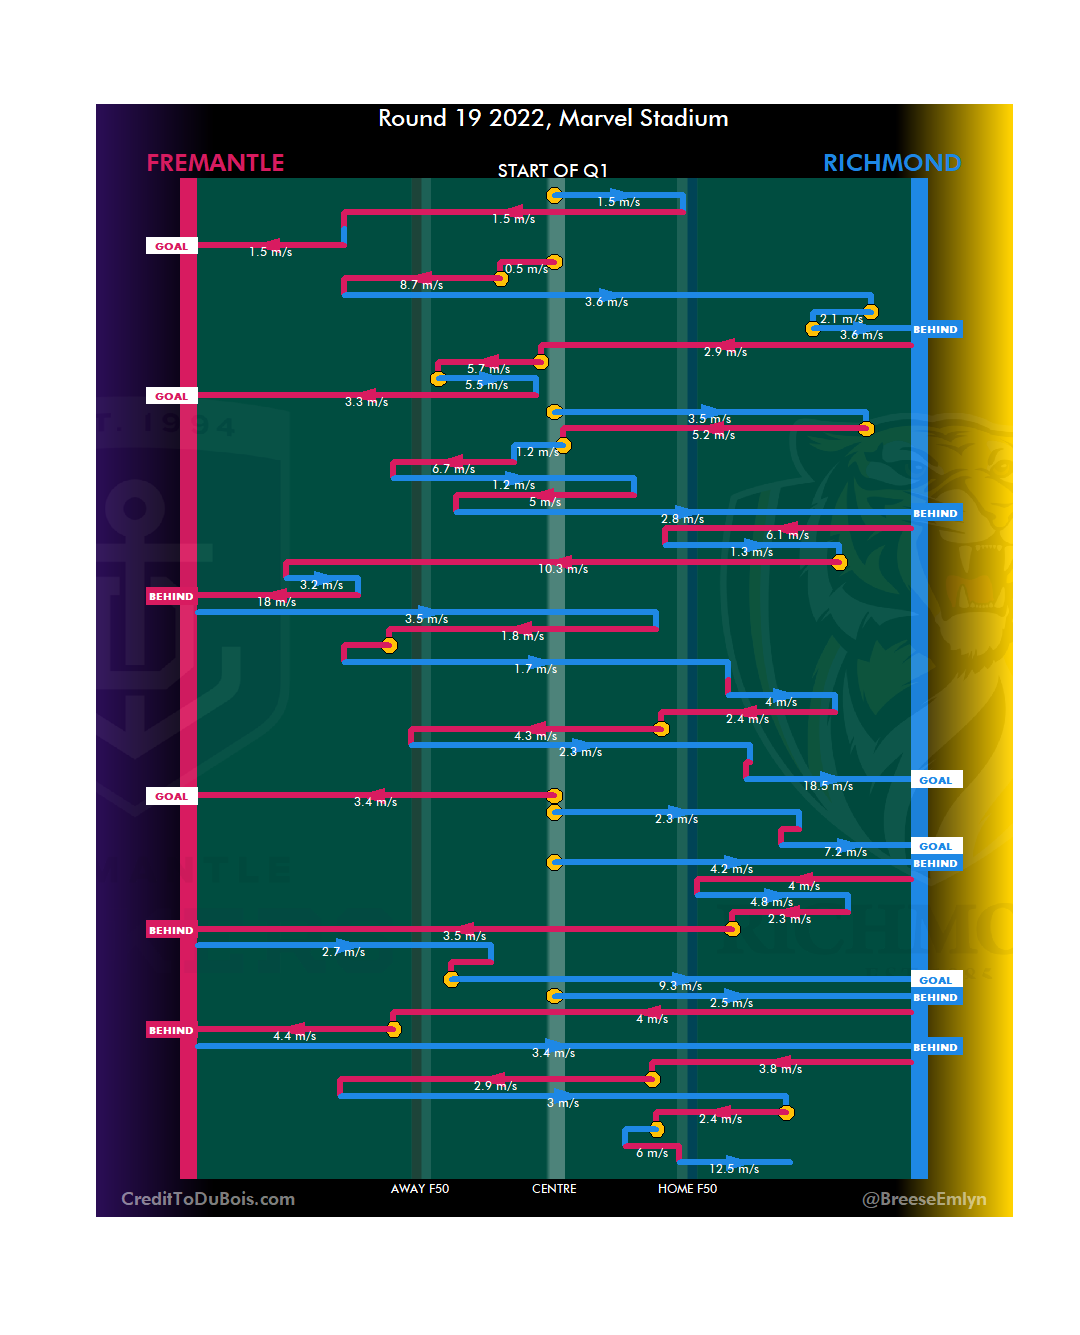
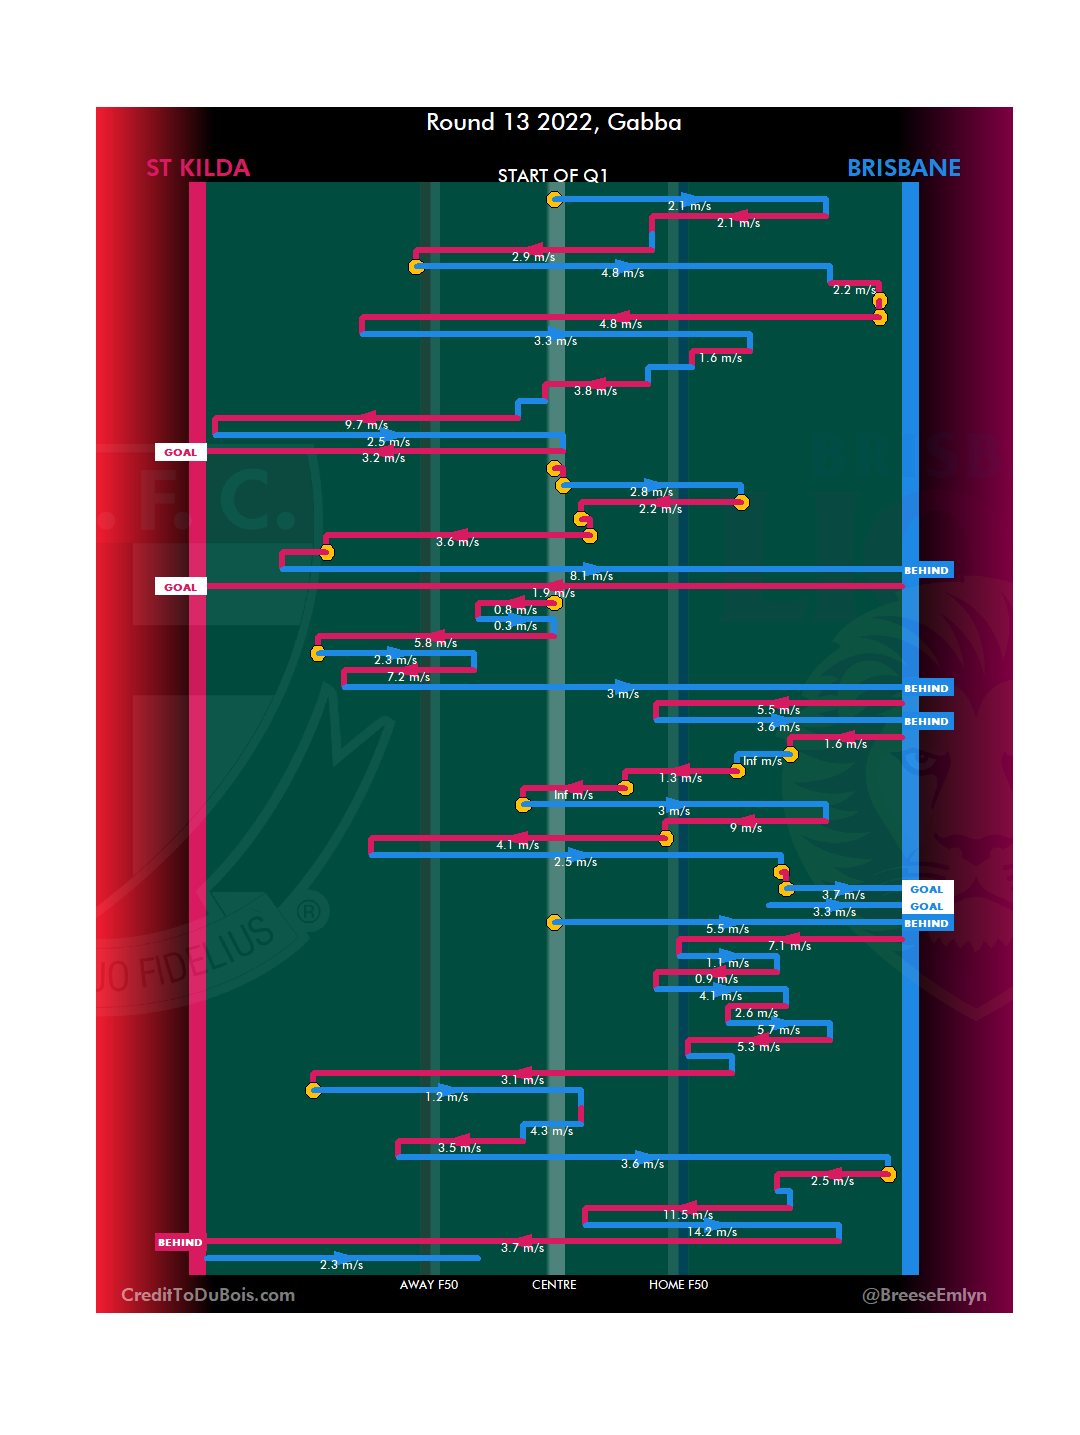
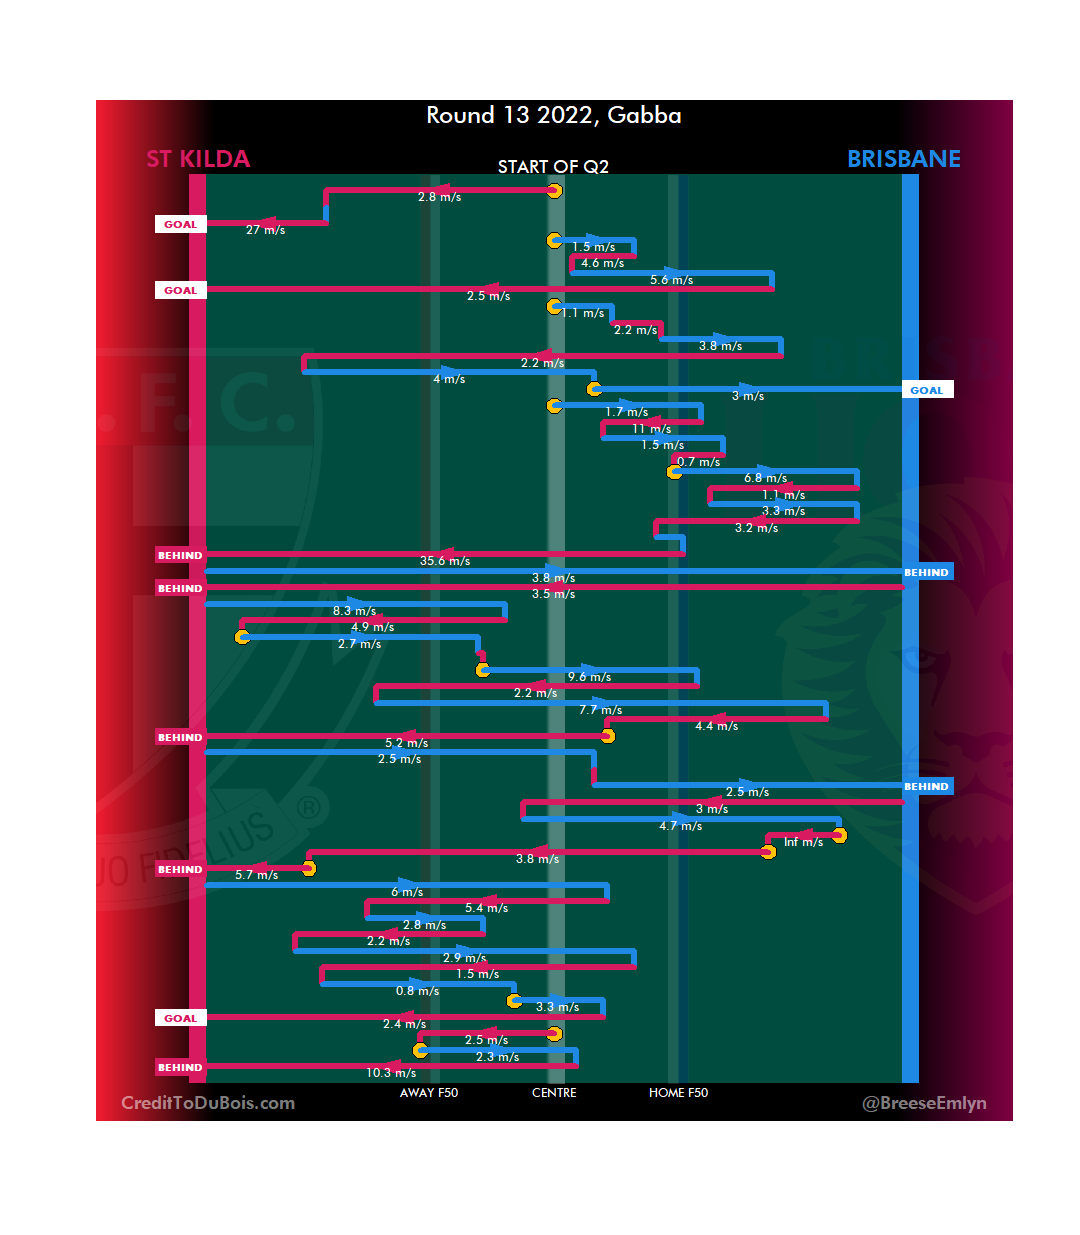
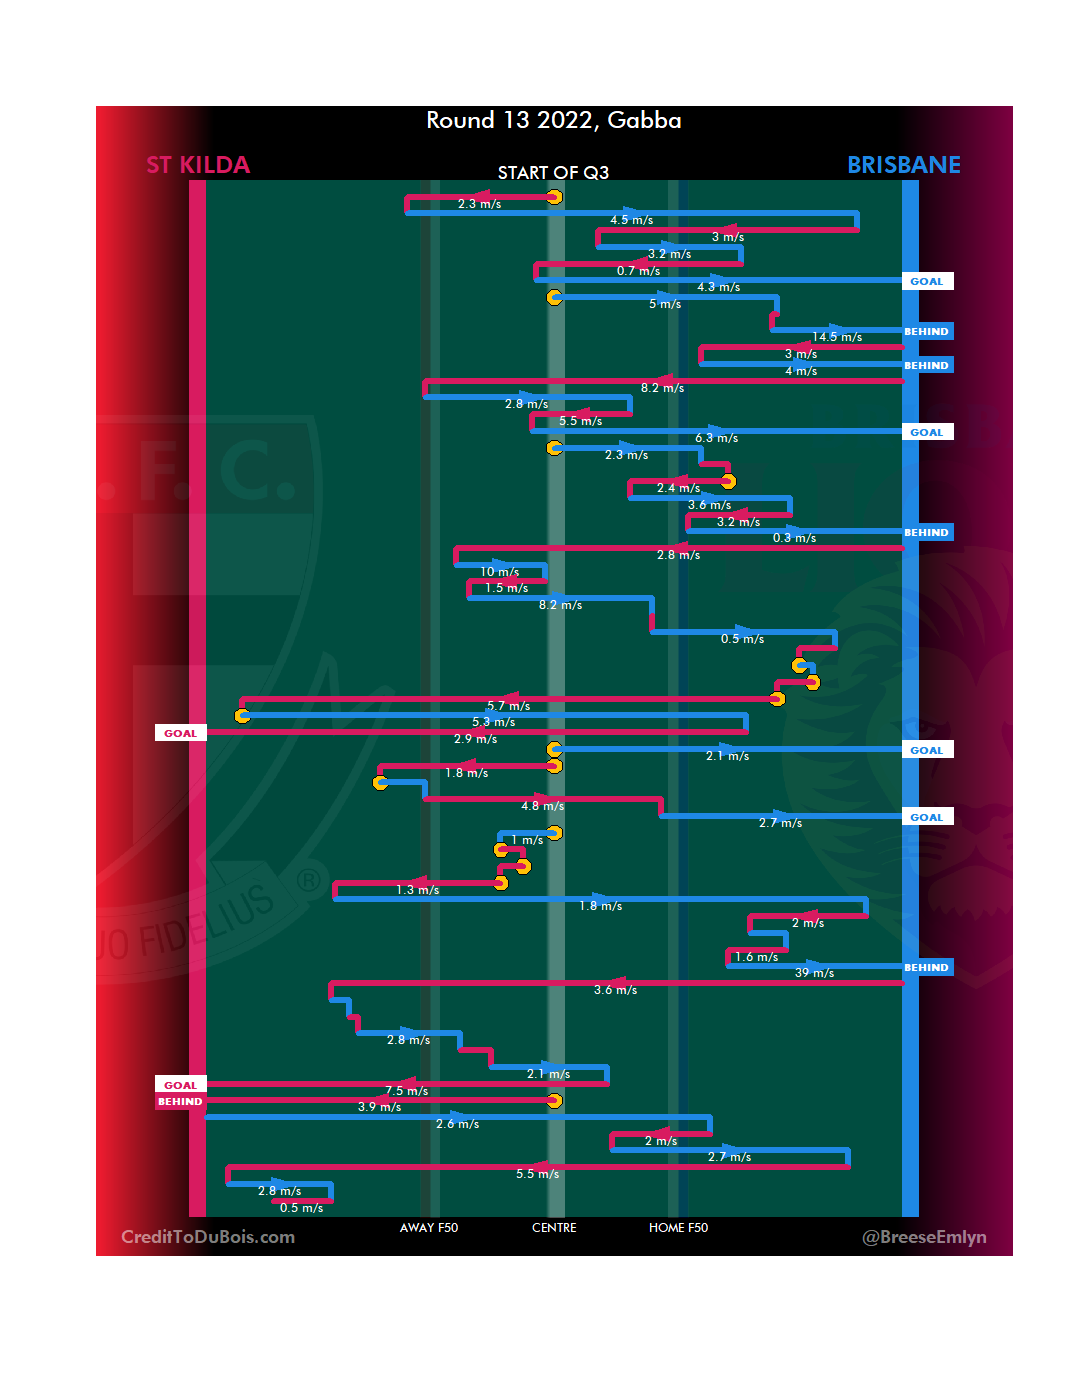
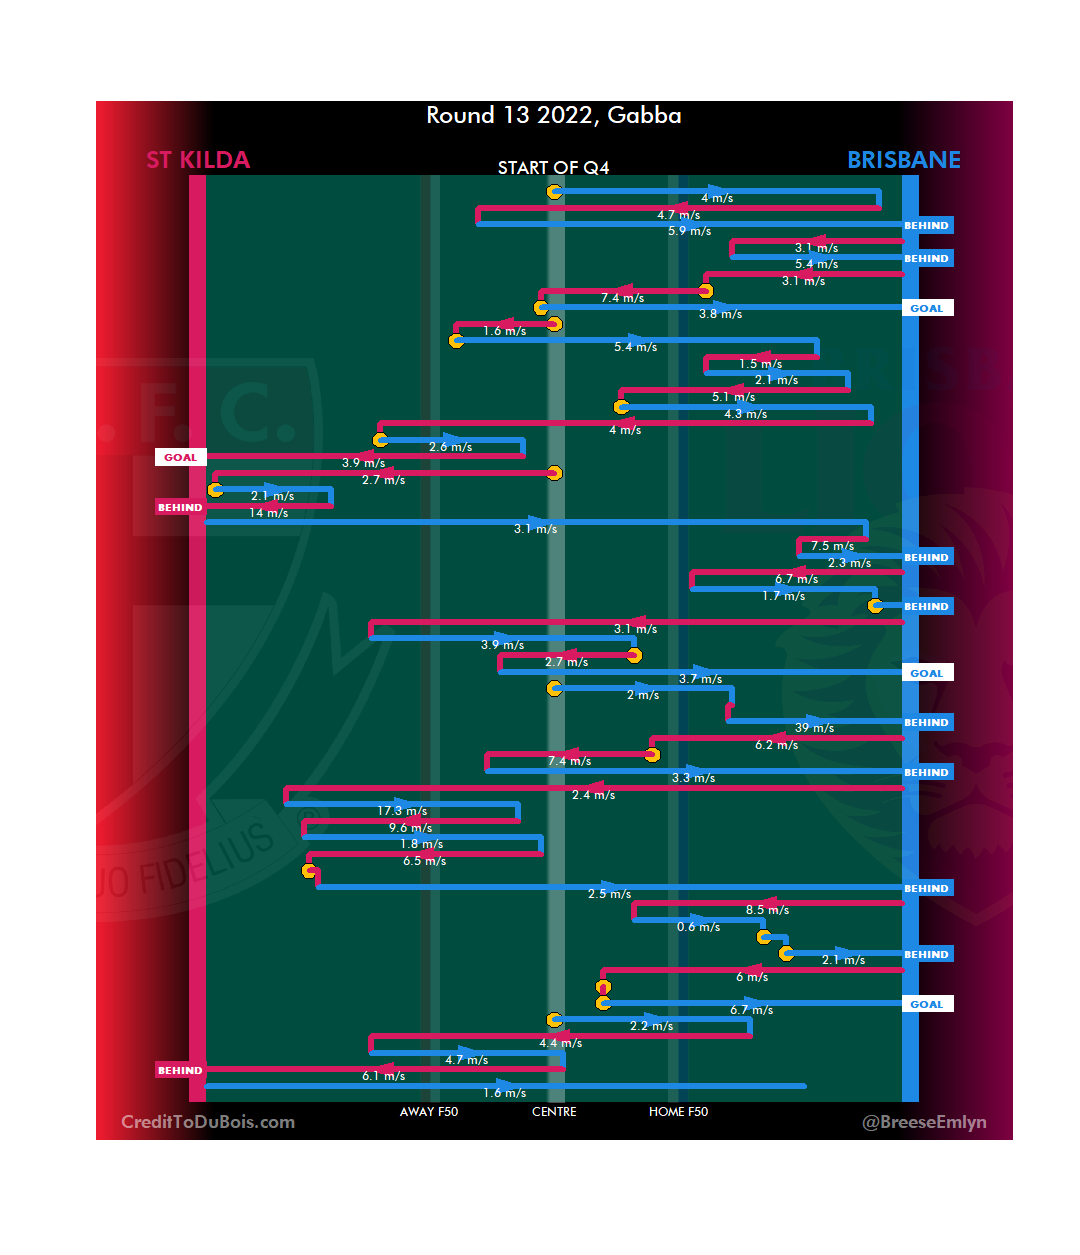
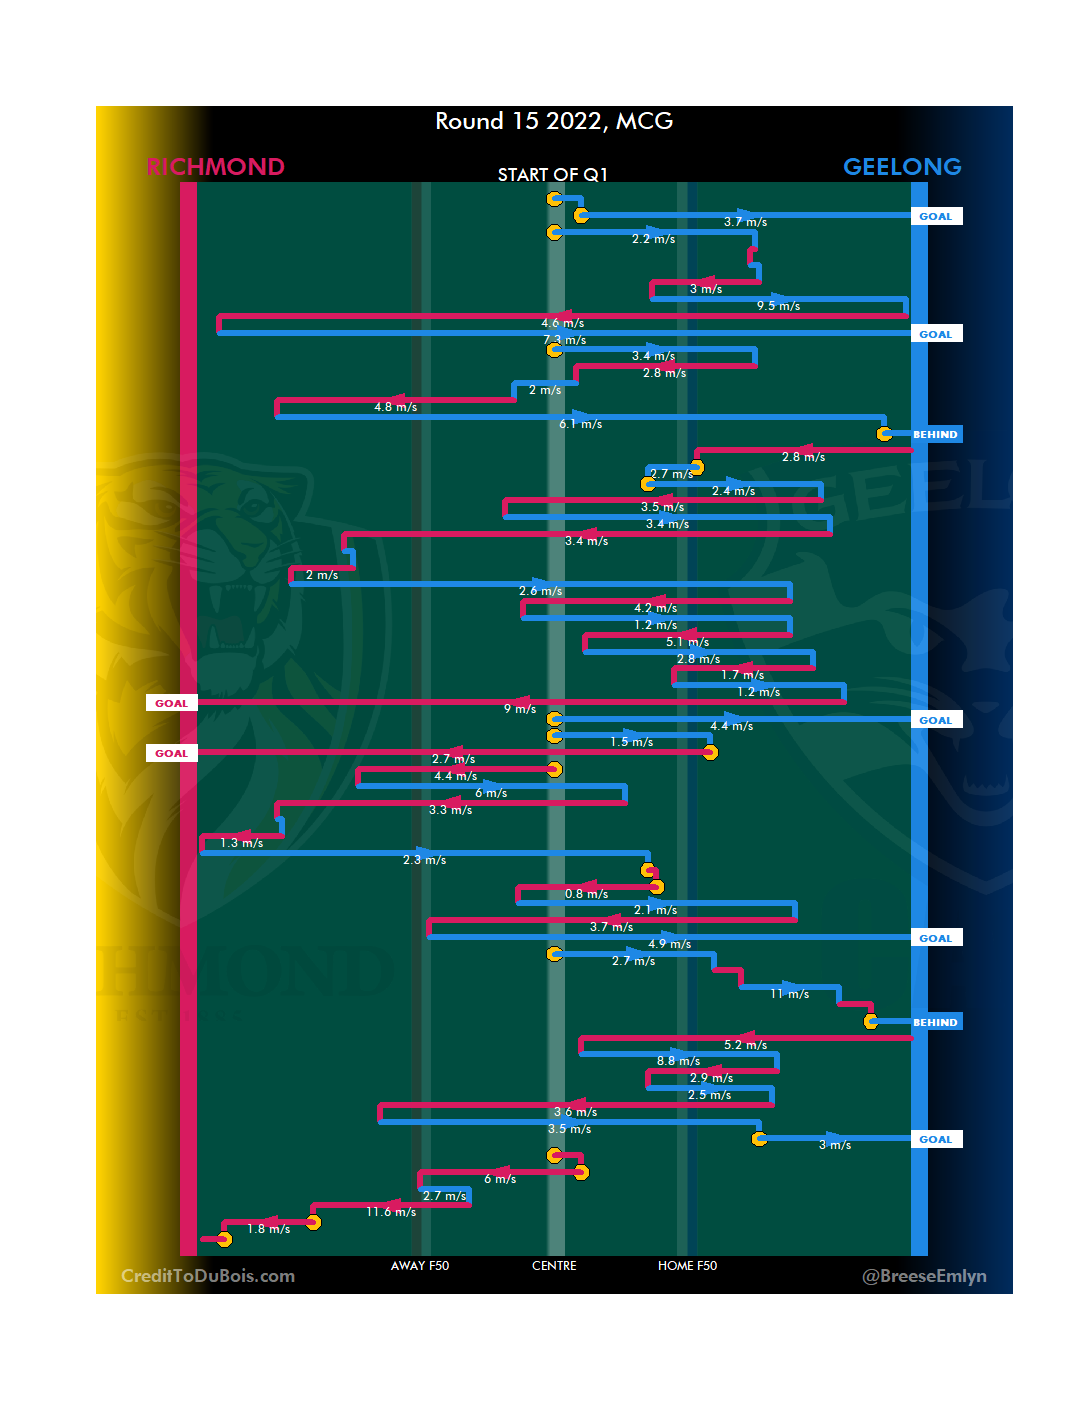
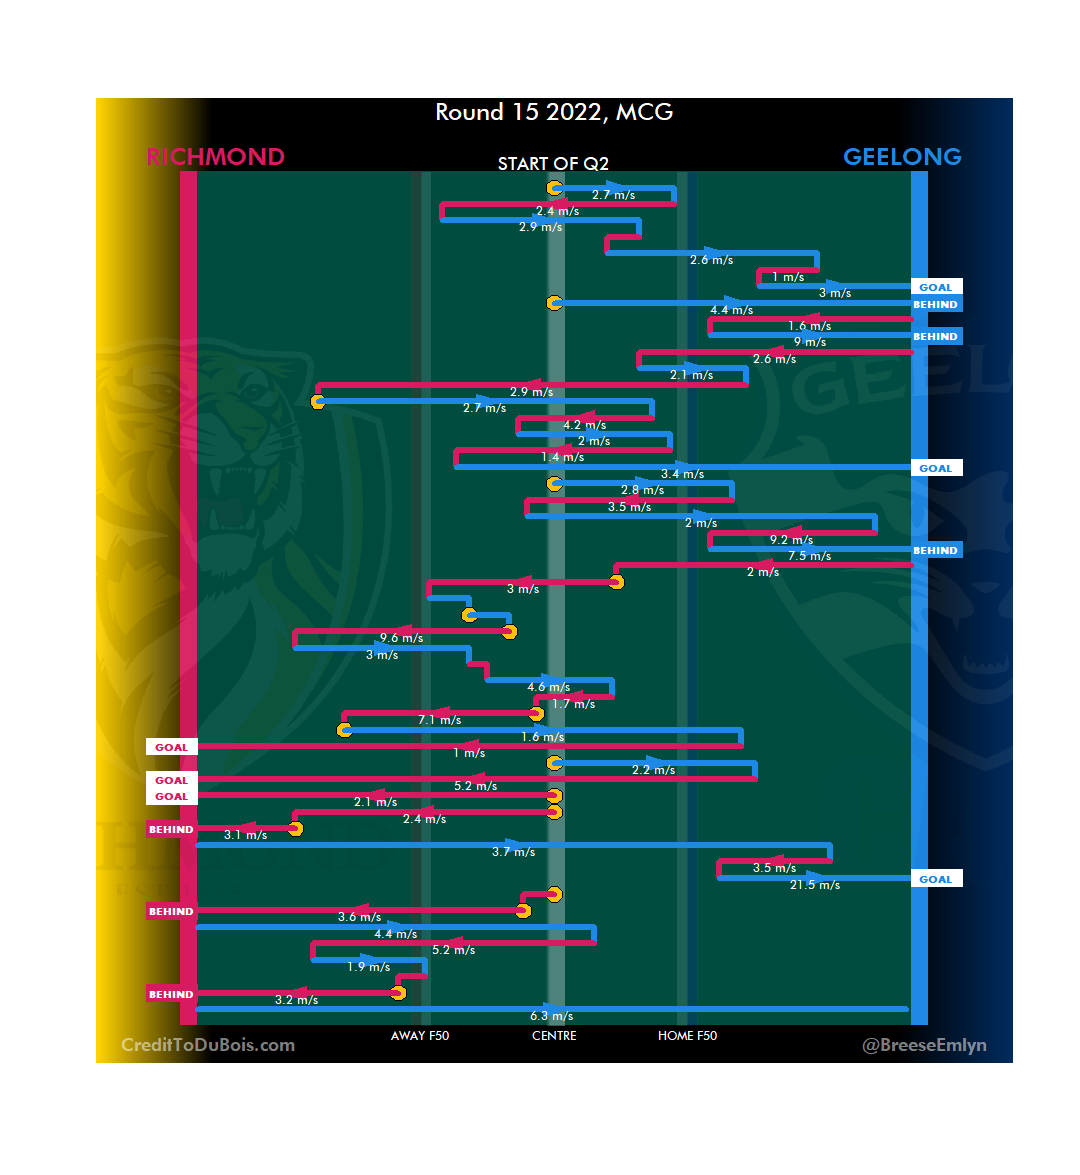
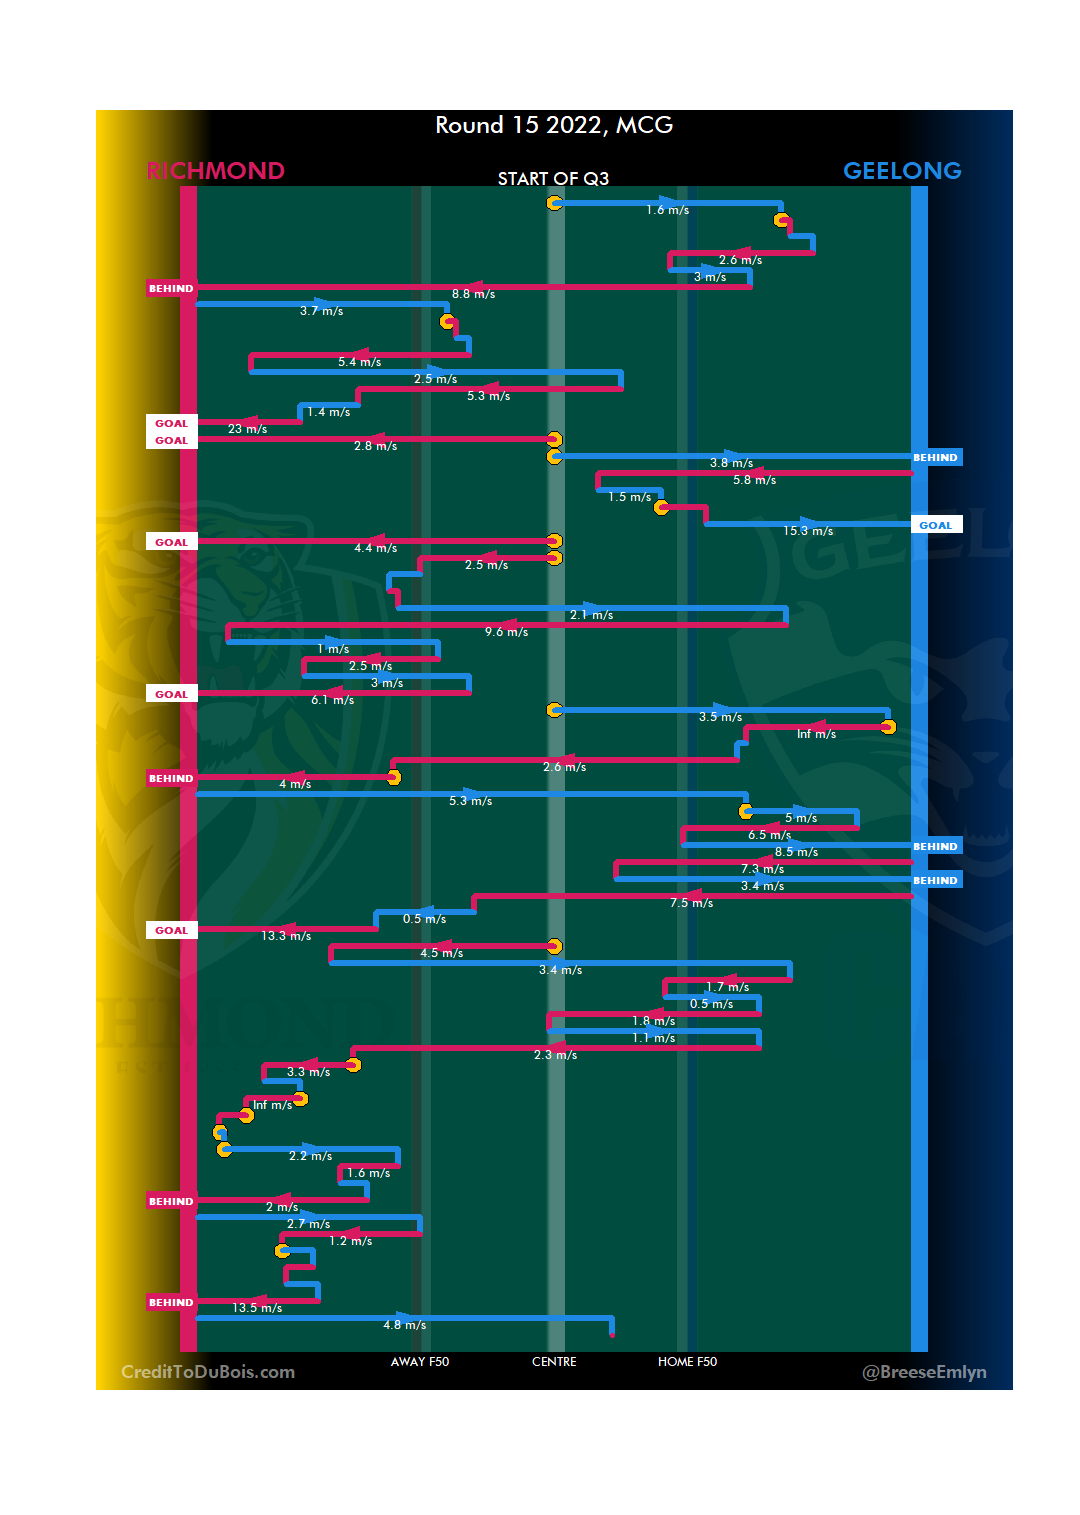
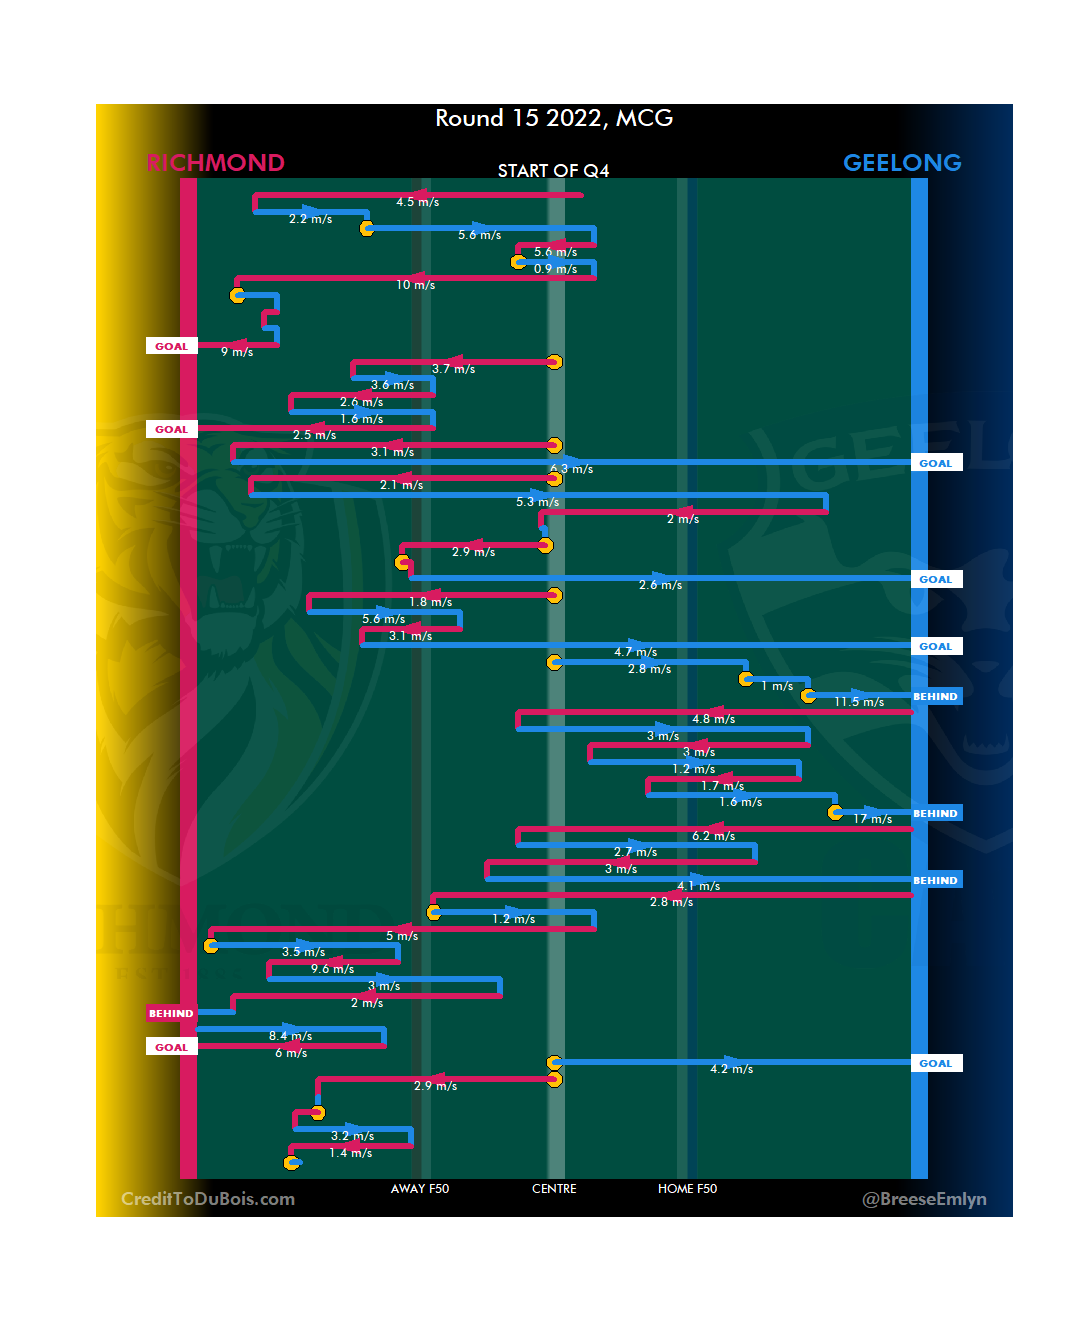
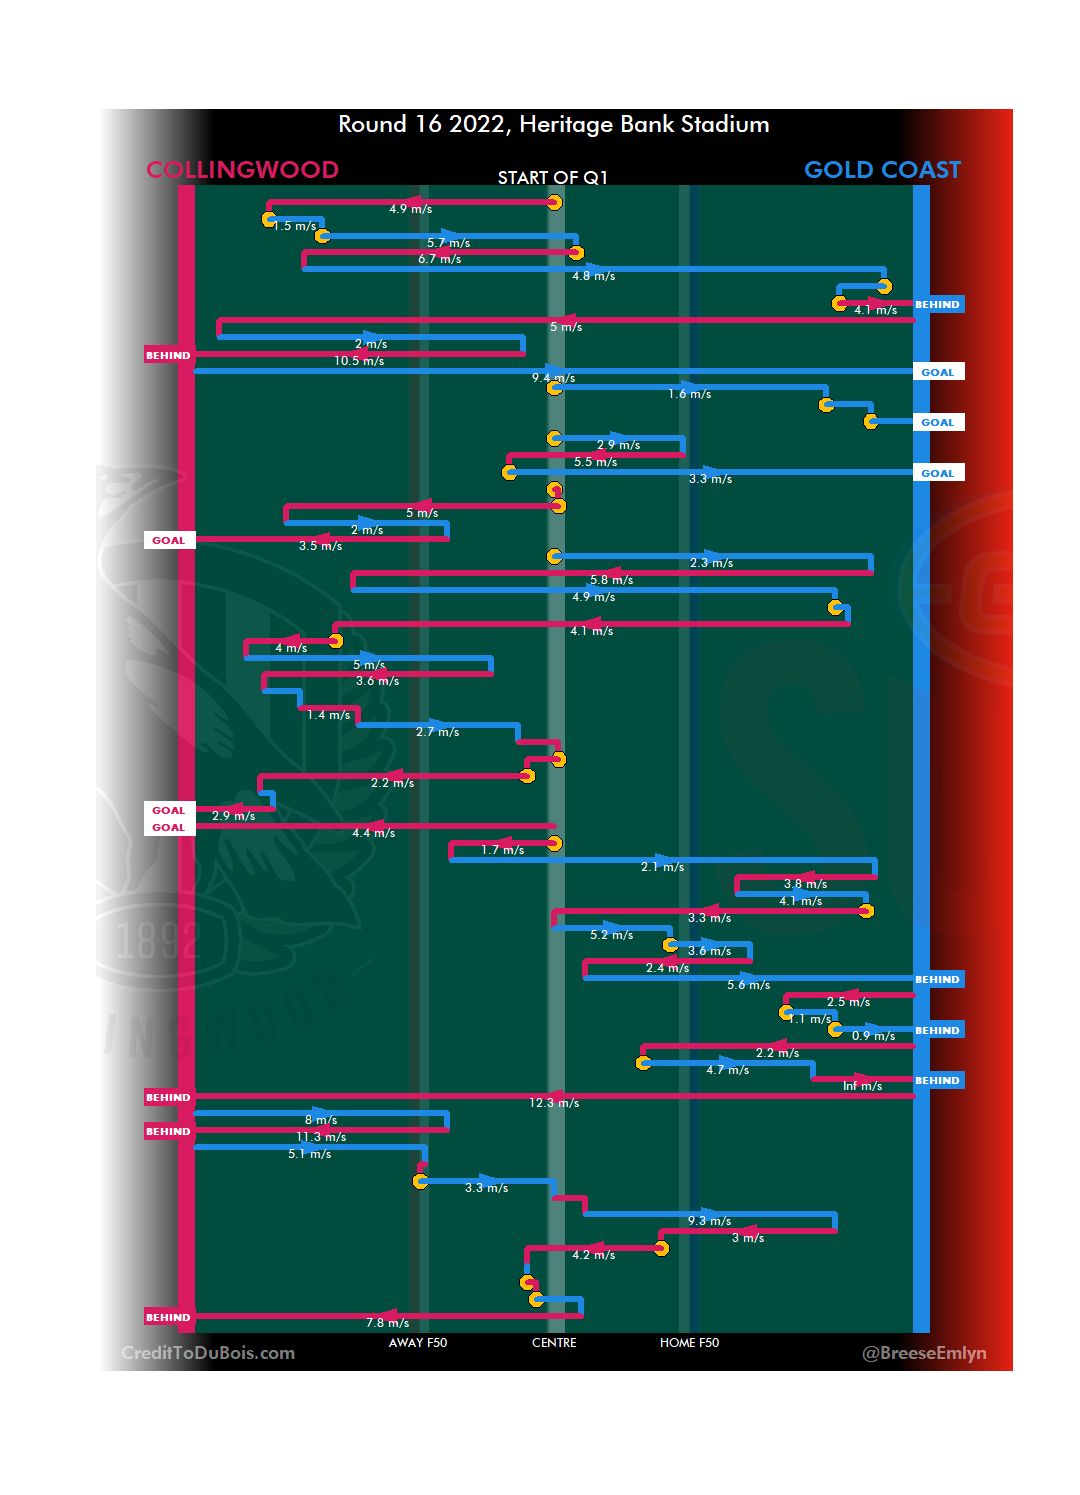
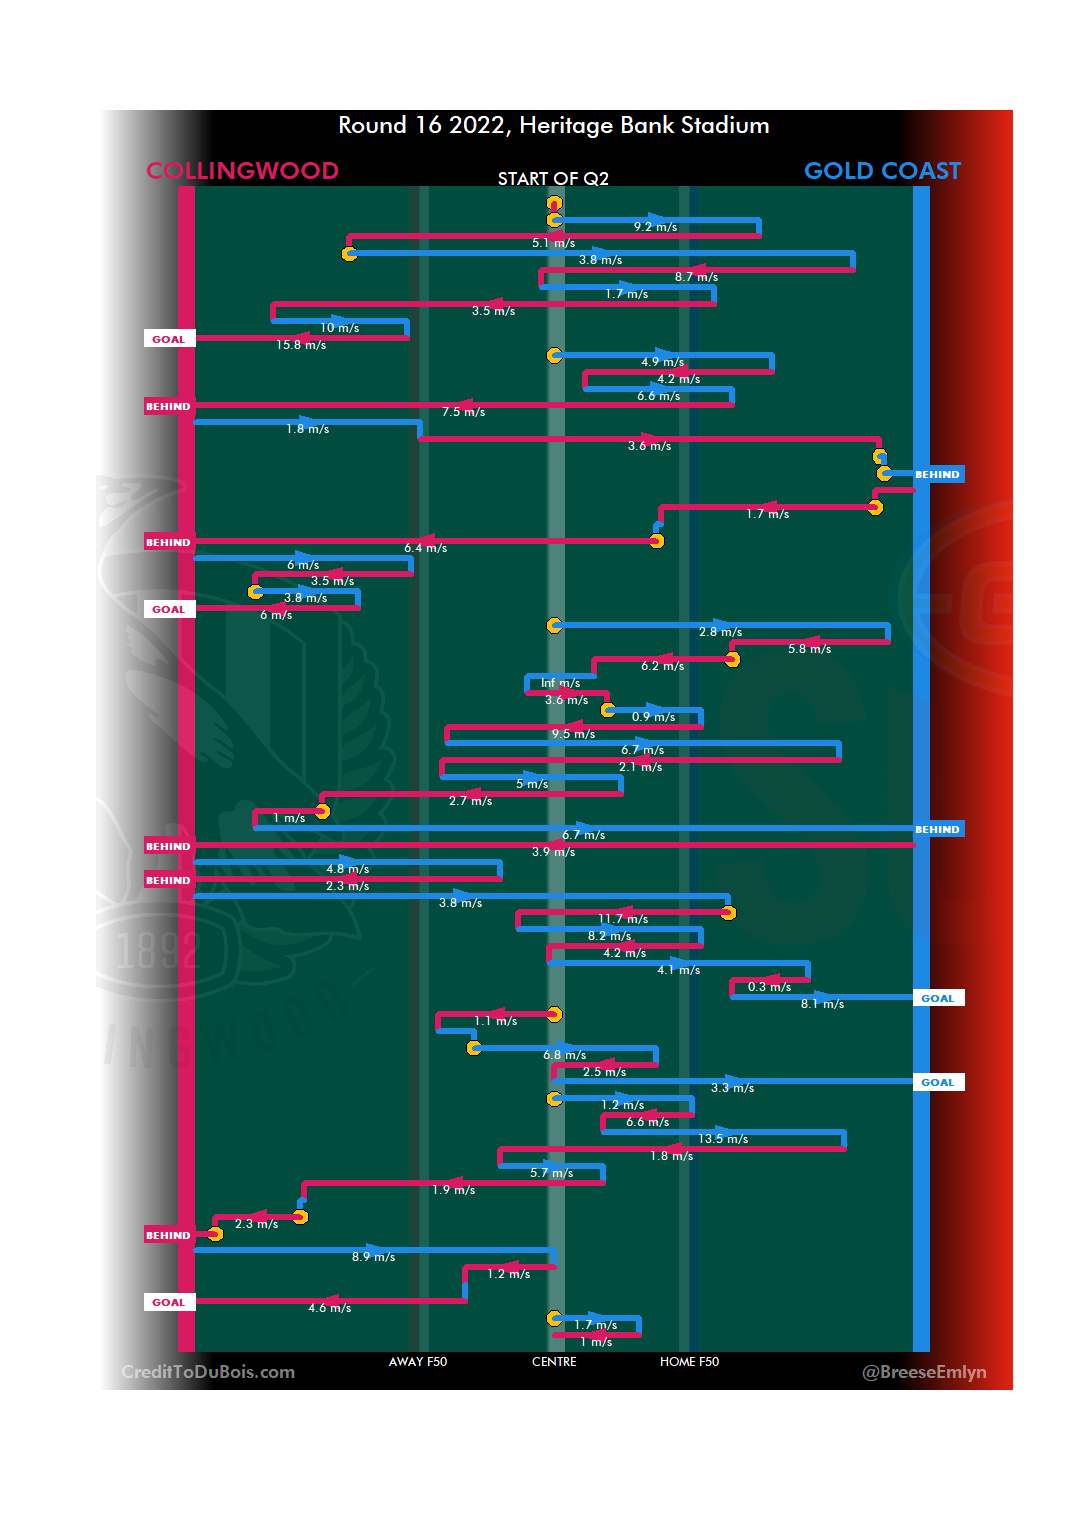
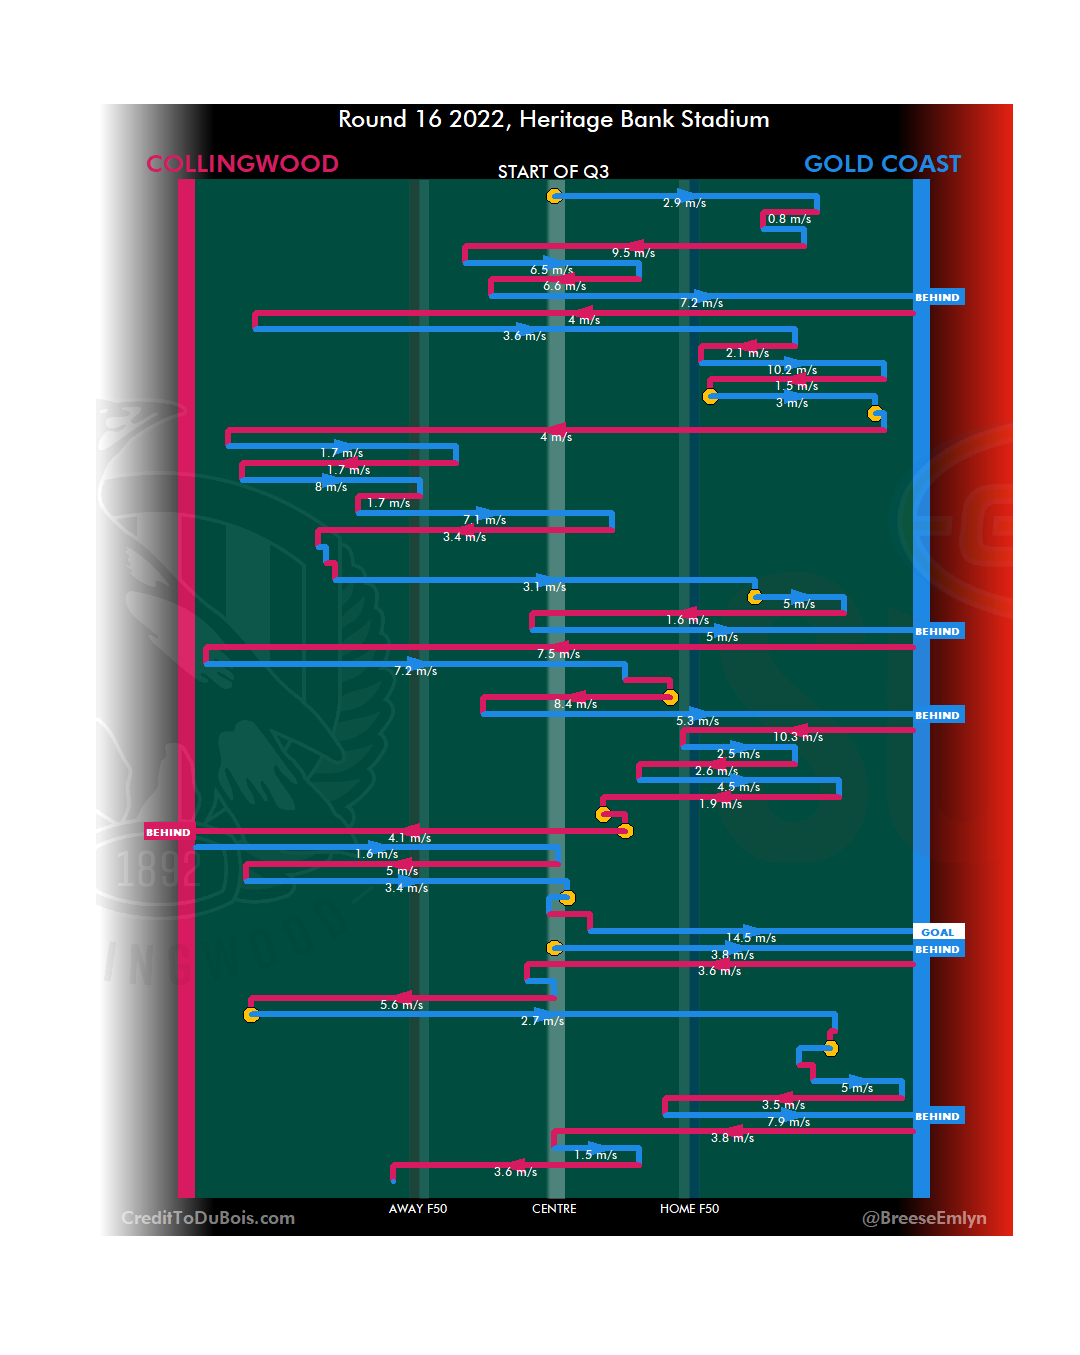
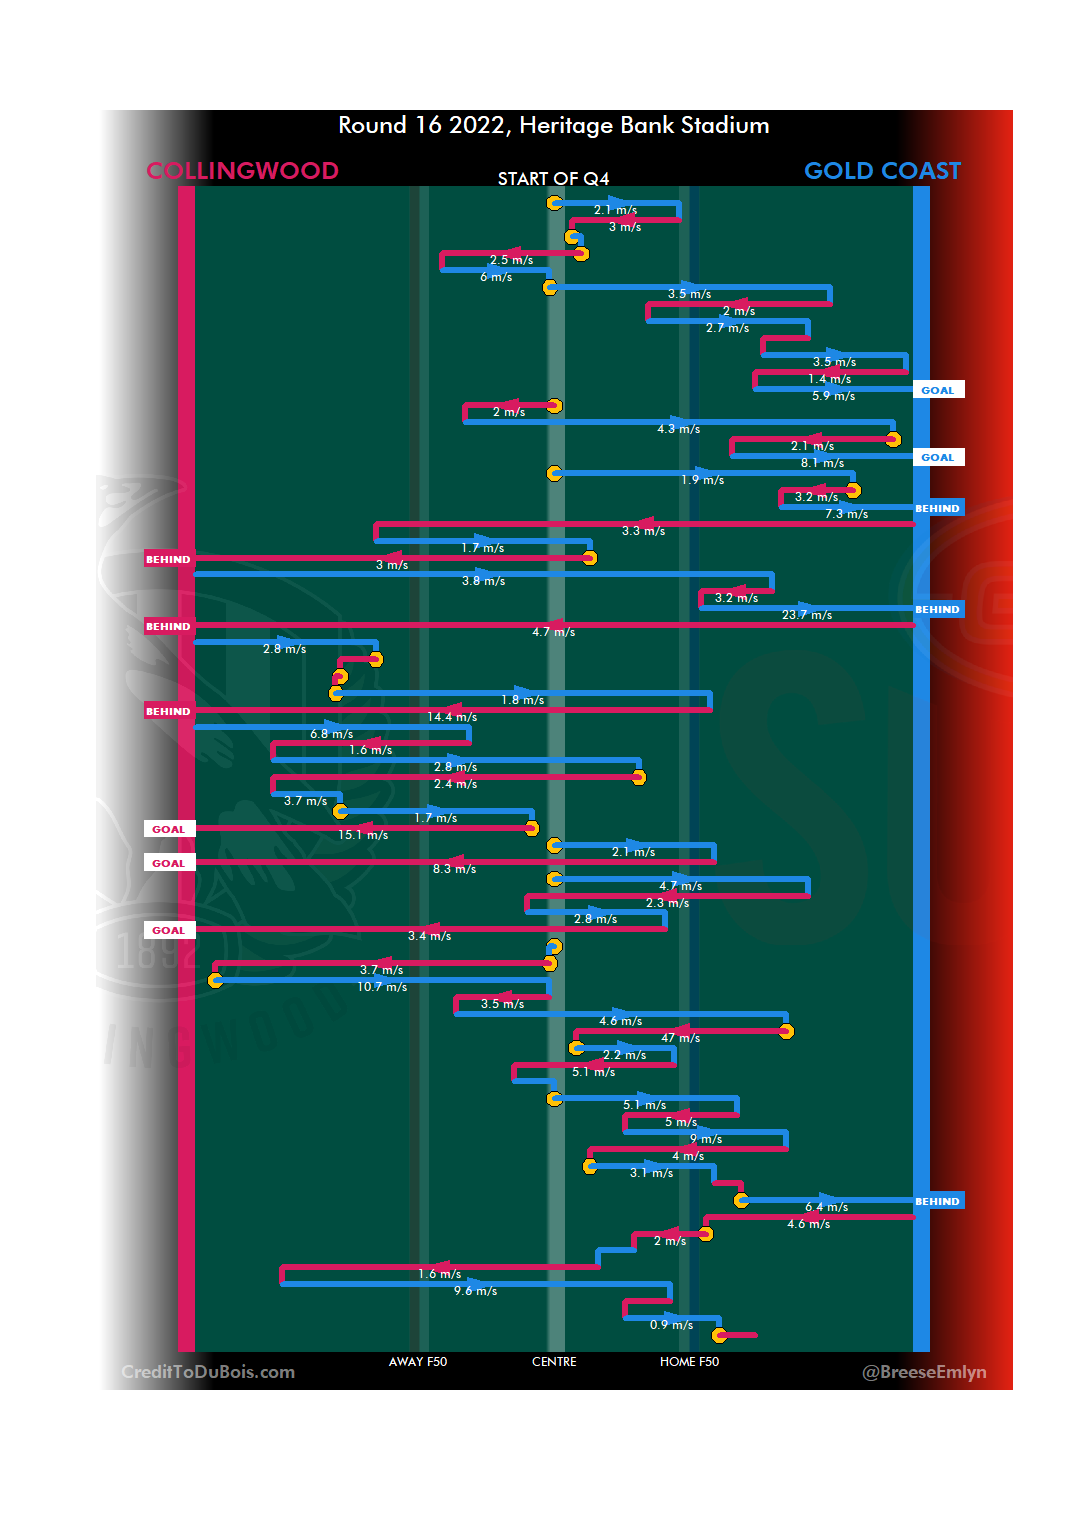
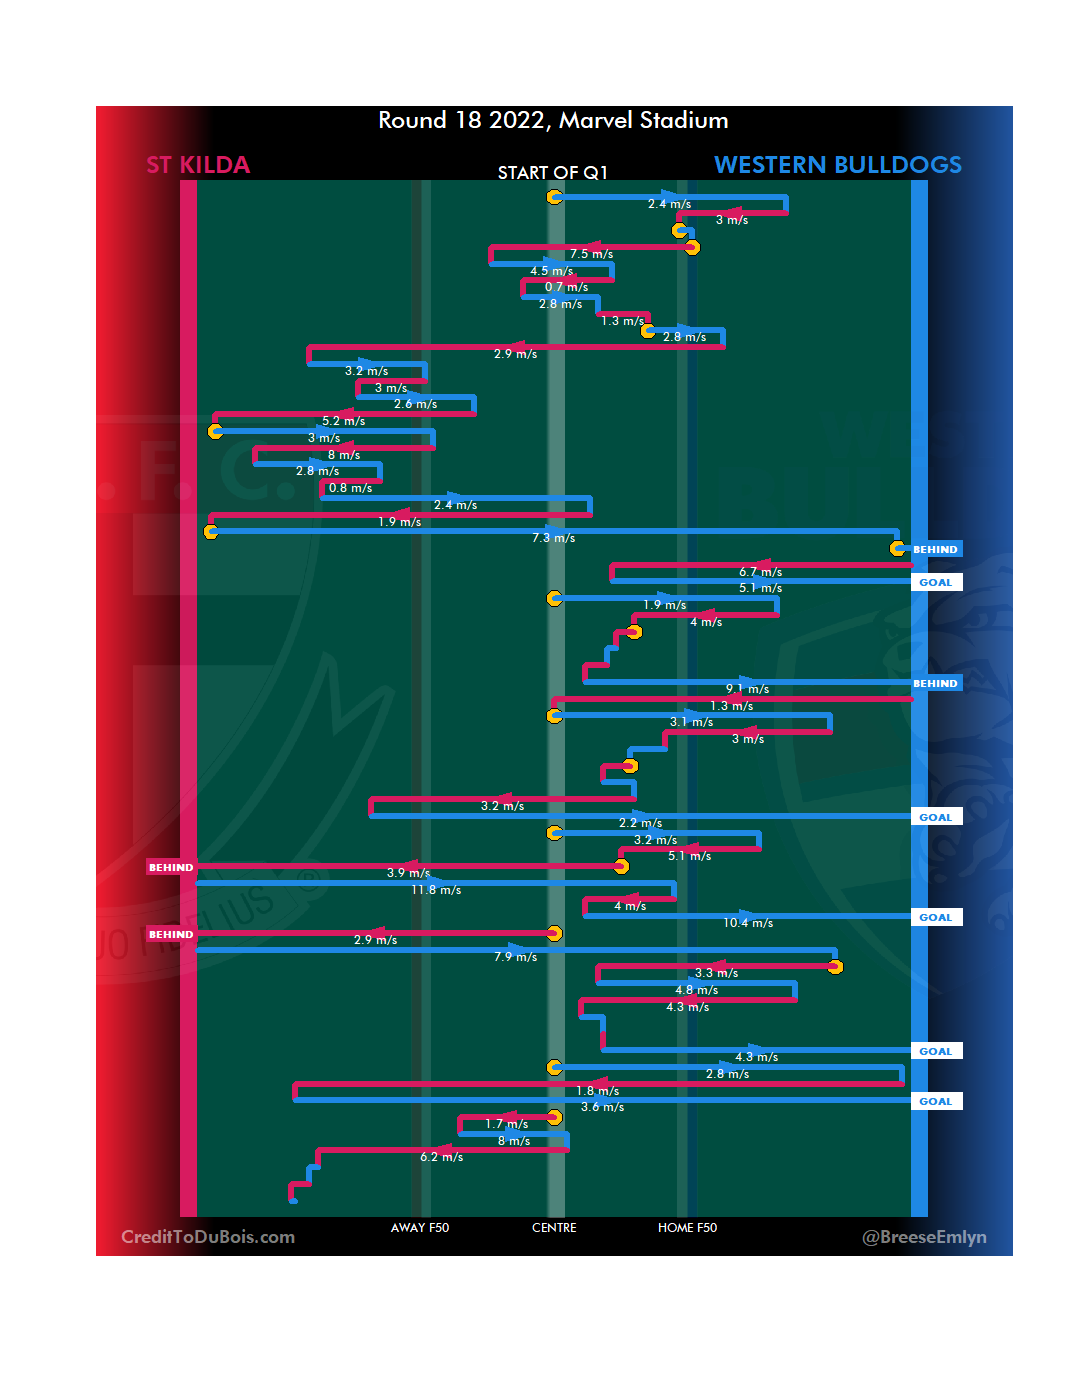
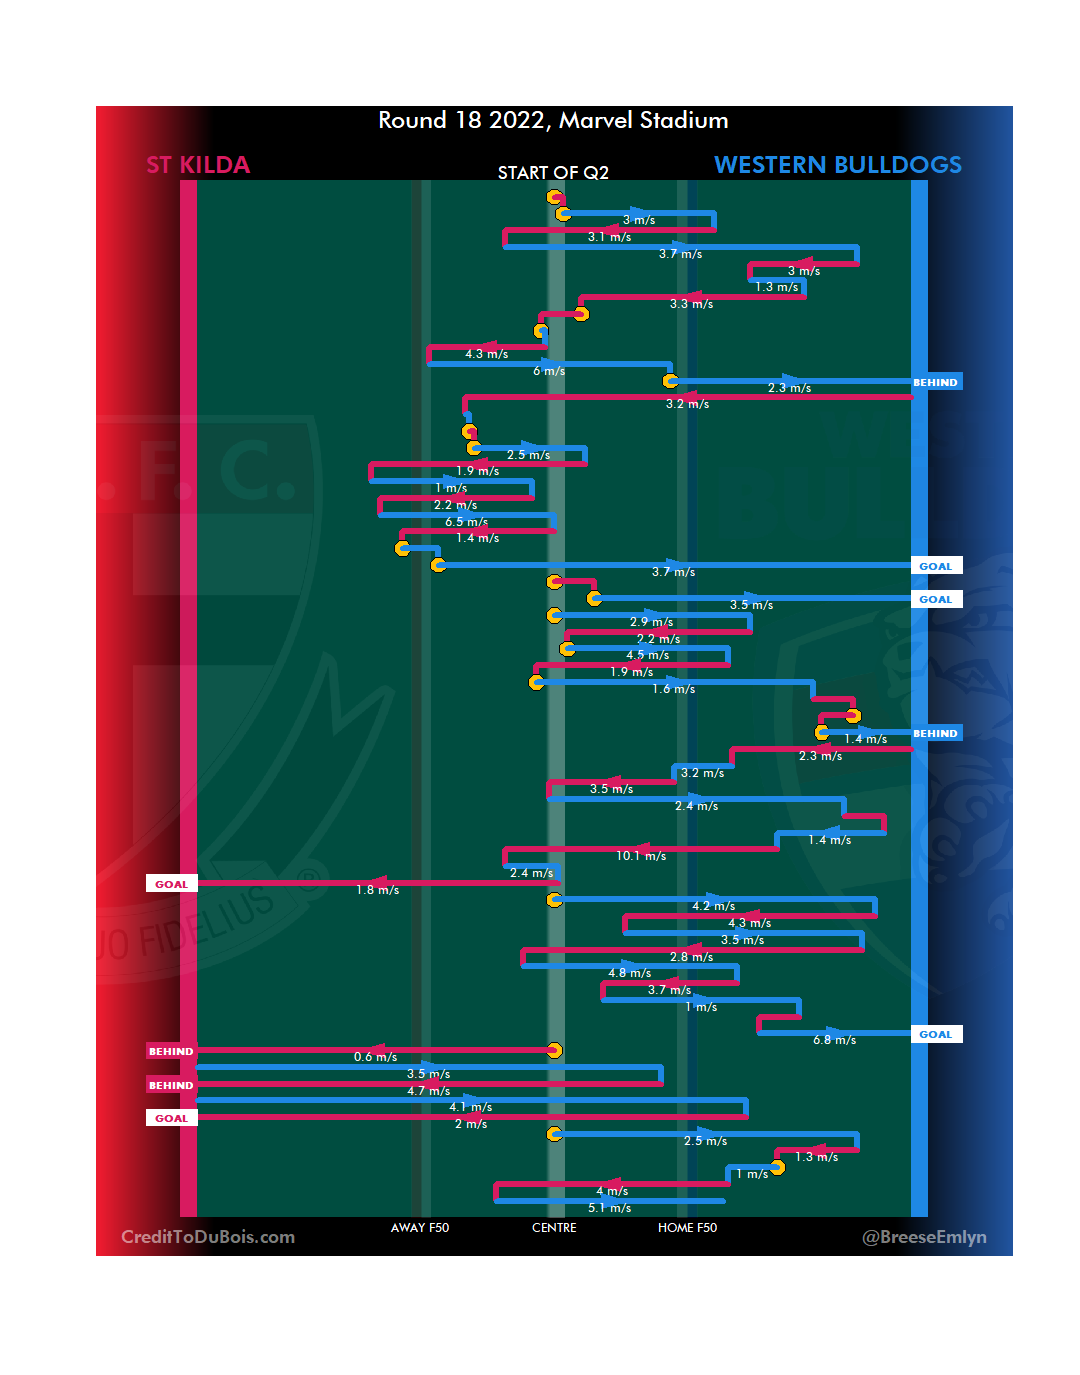
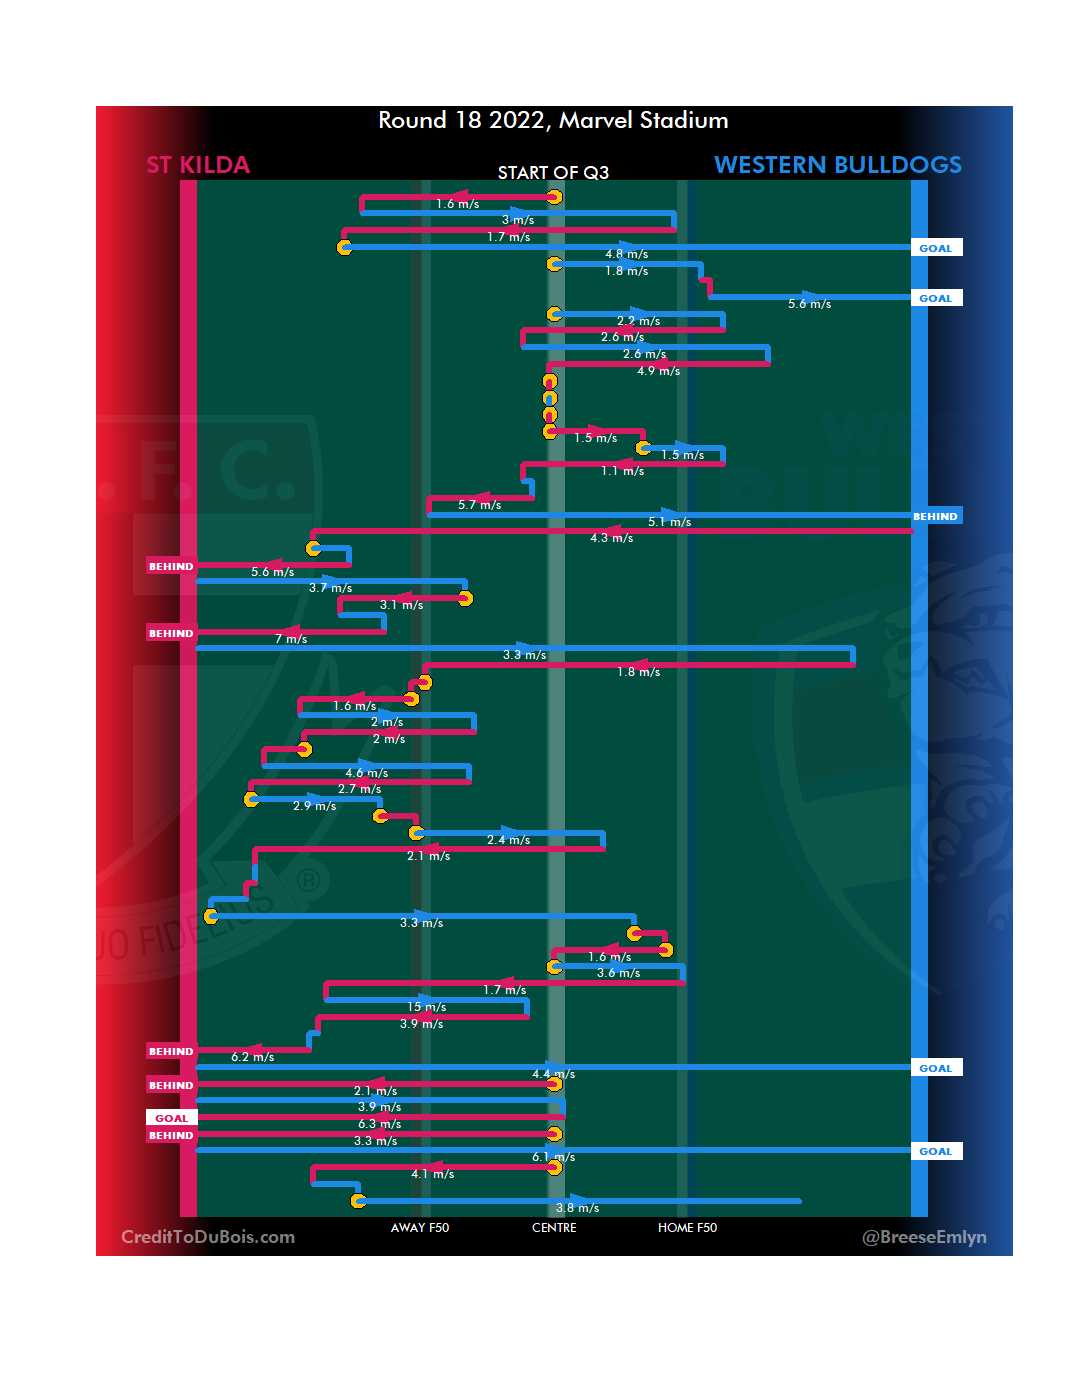
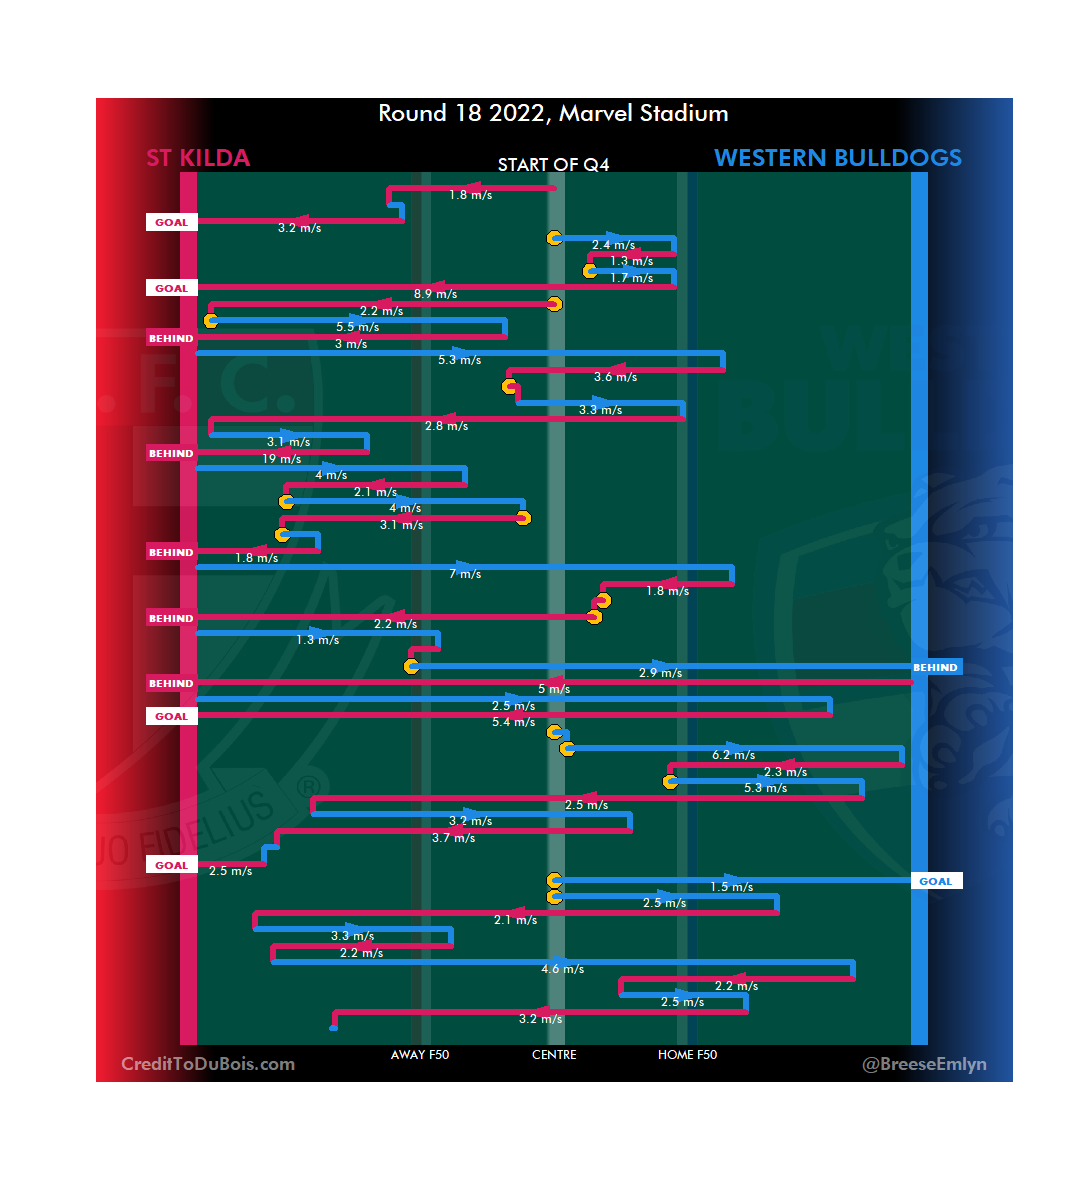
In doing this rounds territory charts I thought I’d have a quick look at how well Melbourne controlled the game after Richmond levelled and regained the lead mid-quarter.
Here it is by territory
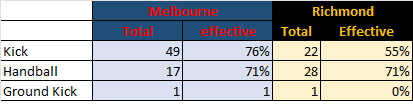
What does it look for sheer numbers? More than twice as many kicks, and at a much higher efficiency