Author: admin

  • Showdowns and letdowns

    Showdowns and letdowns

    Sometimes it’s fun to just light some fires. What better way to do that than to attempt to rank the marquee games in the AFL fixture (and before that, annoy people just by deciding which games get included in the rankings to begin with).

    My list of marquee games is as follows:

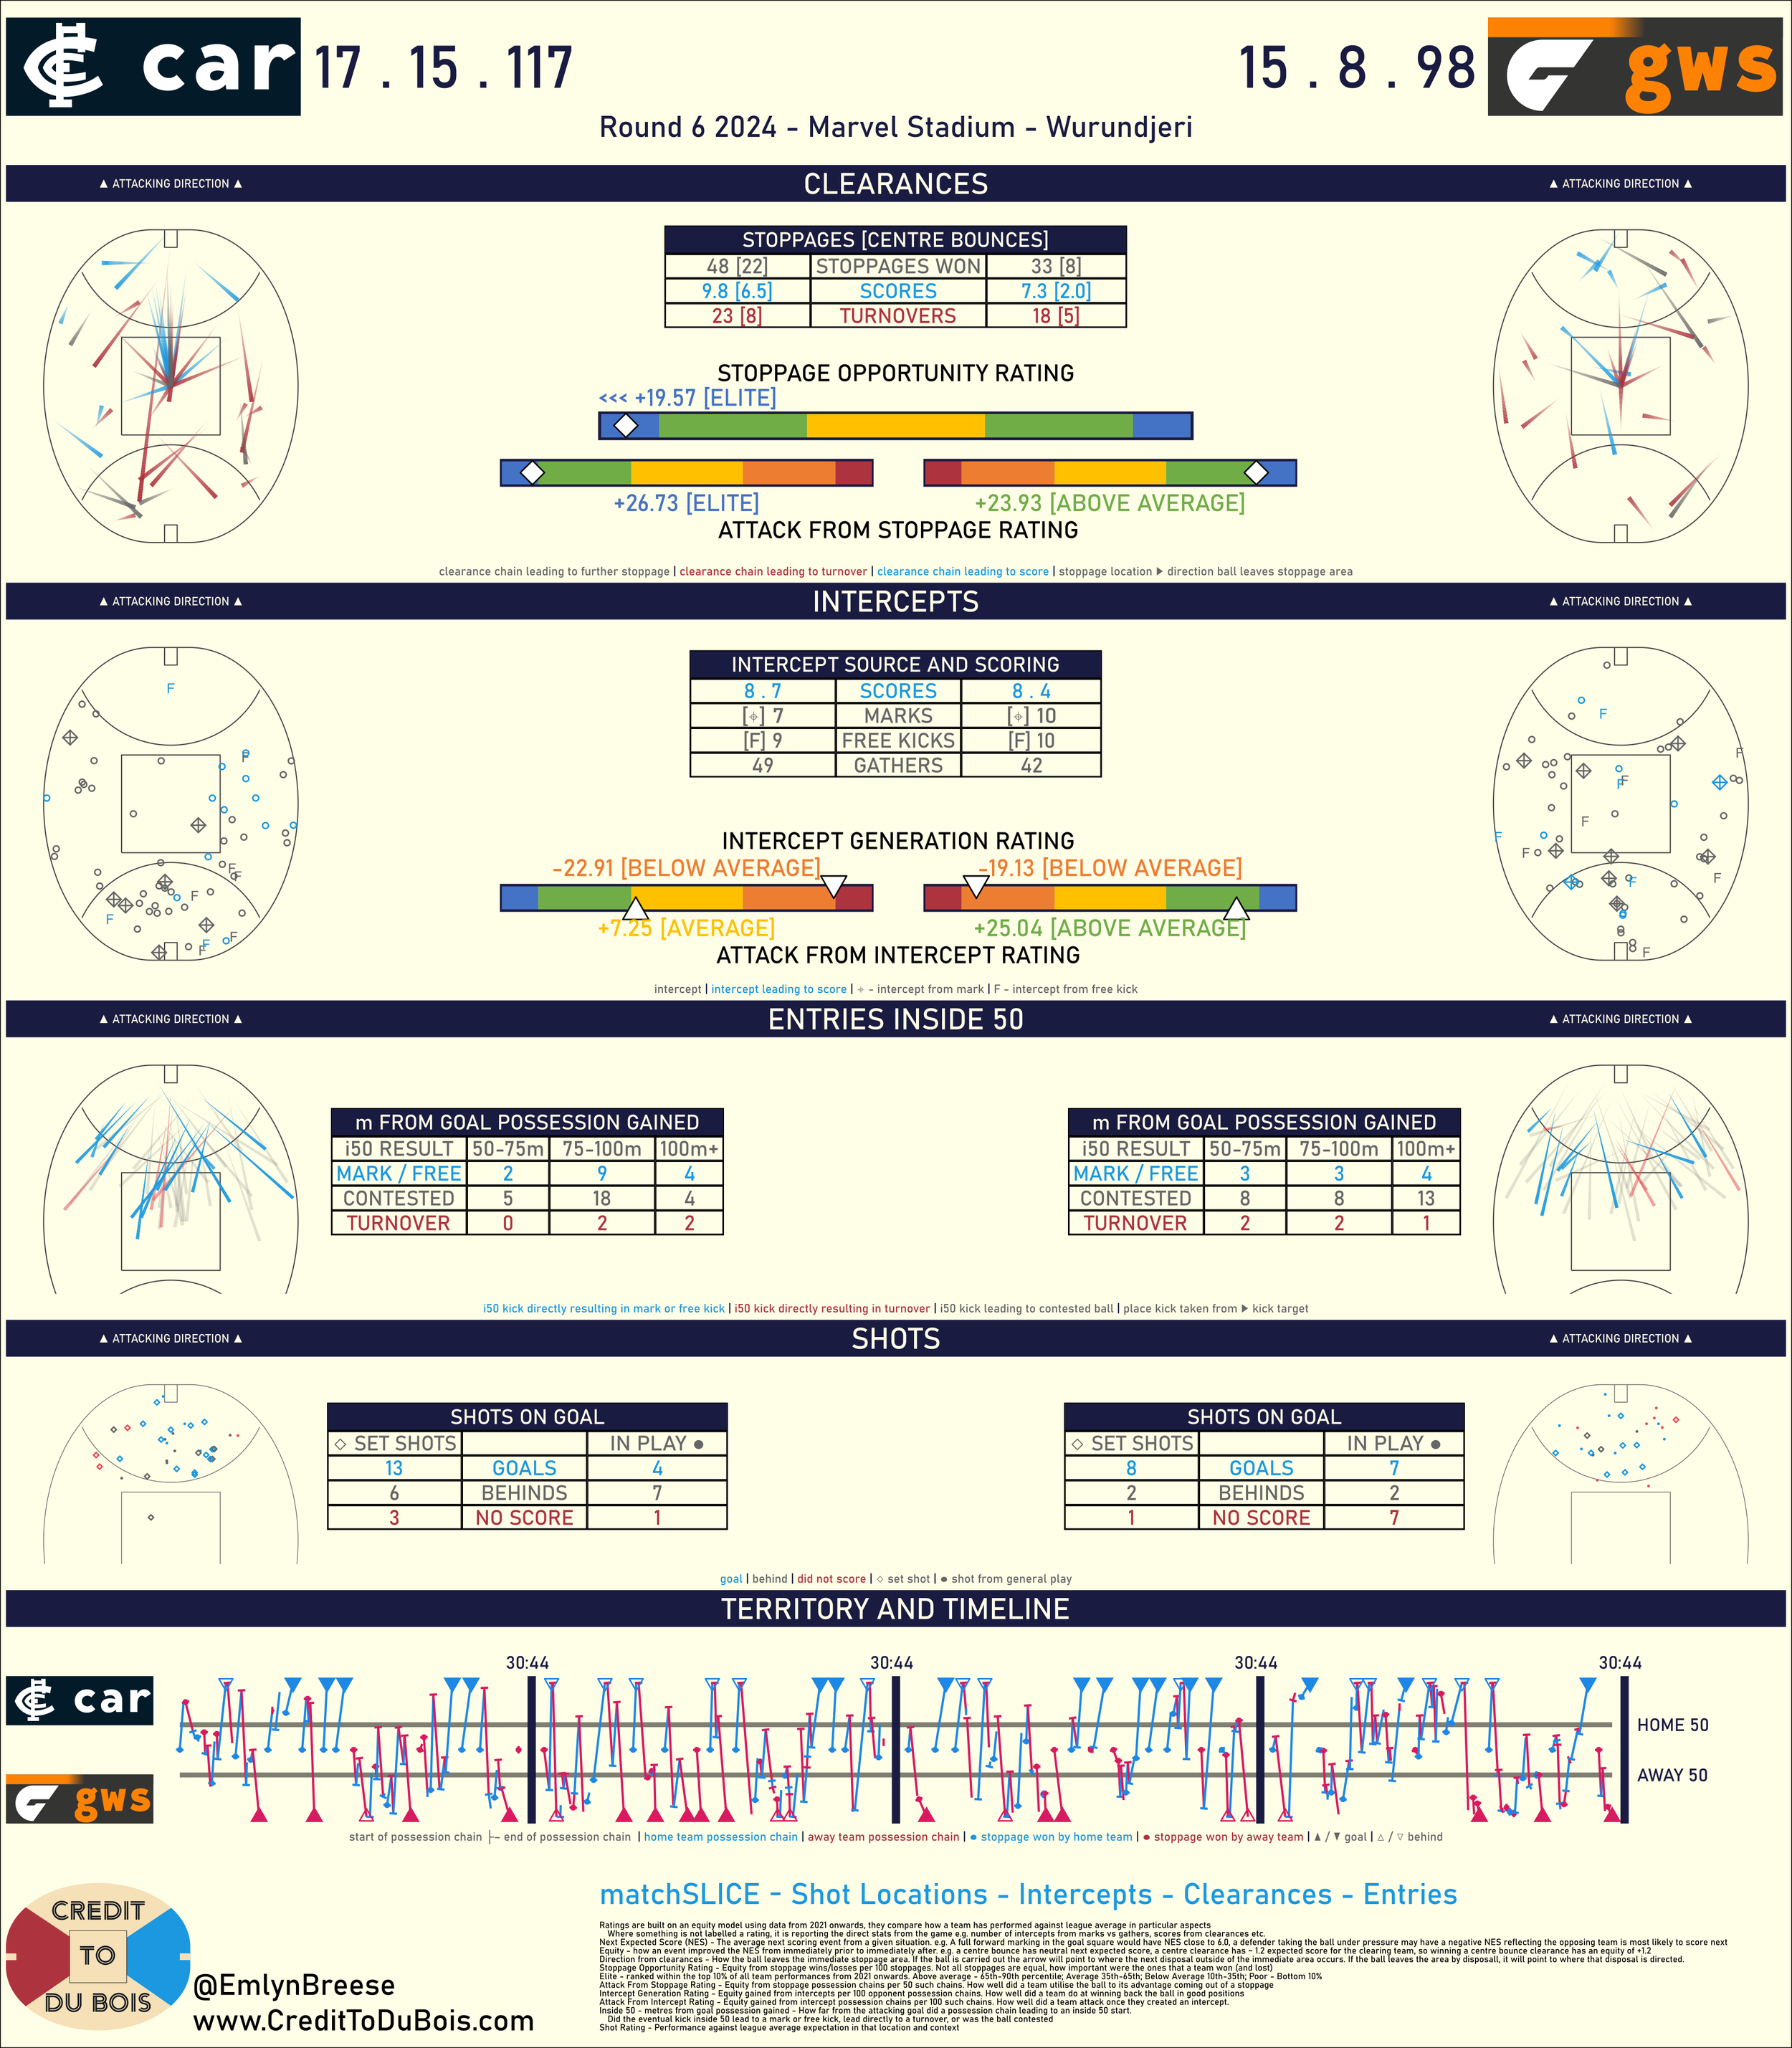
    • Round One – Carlton v Richmond

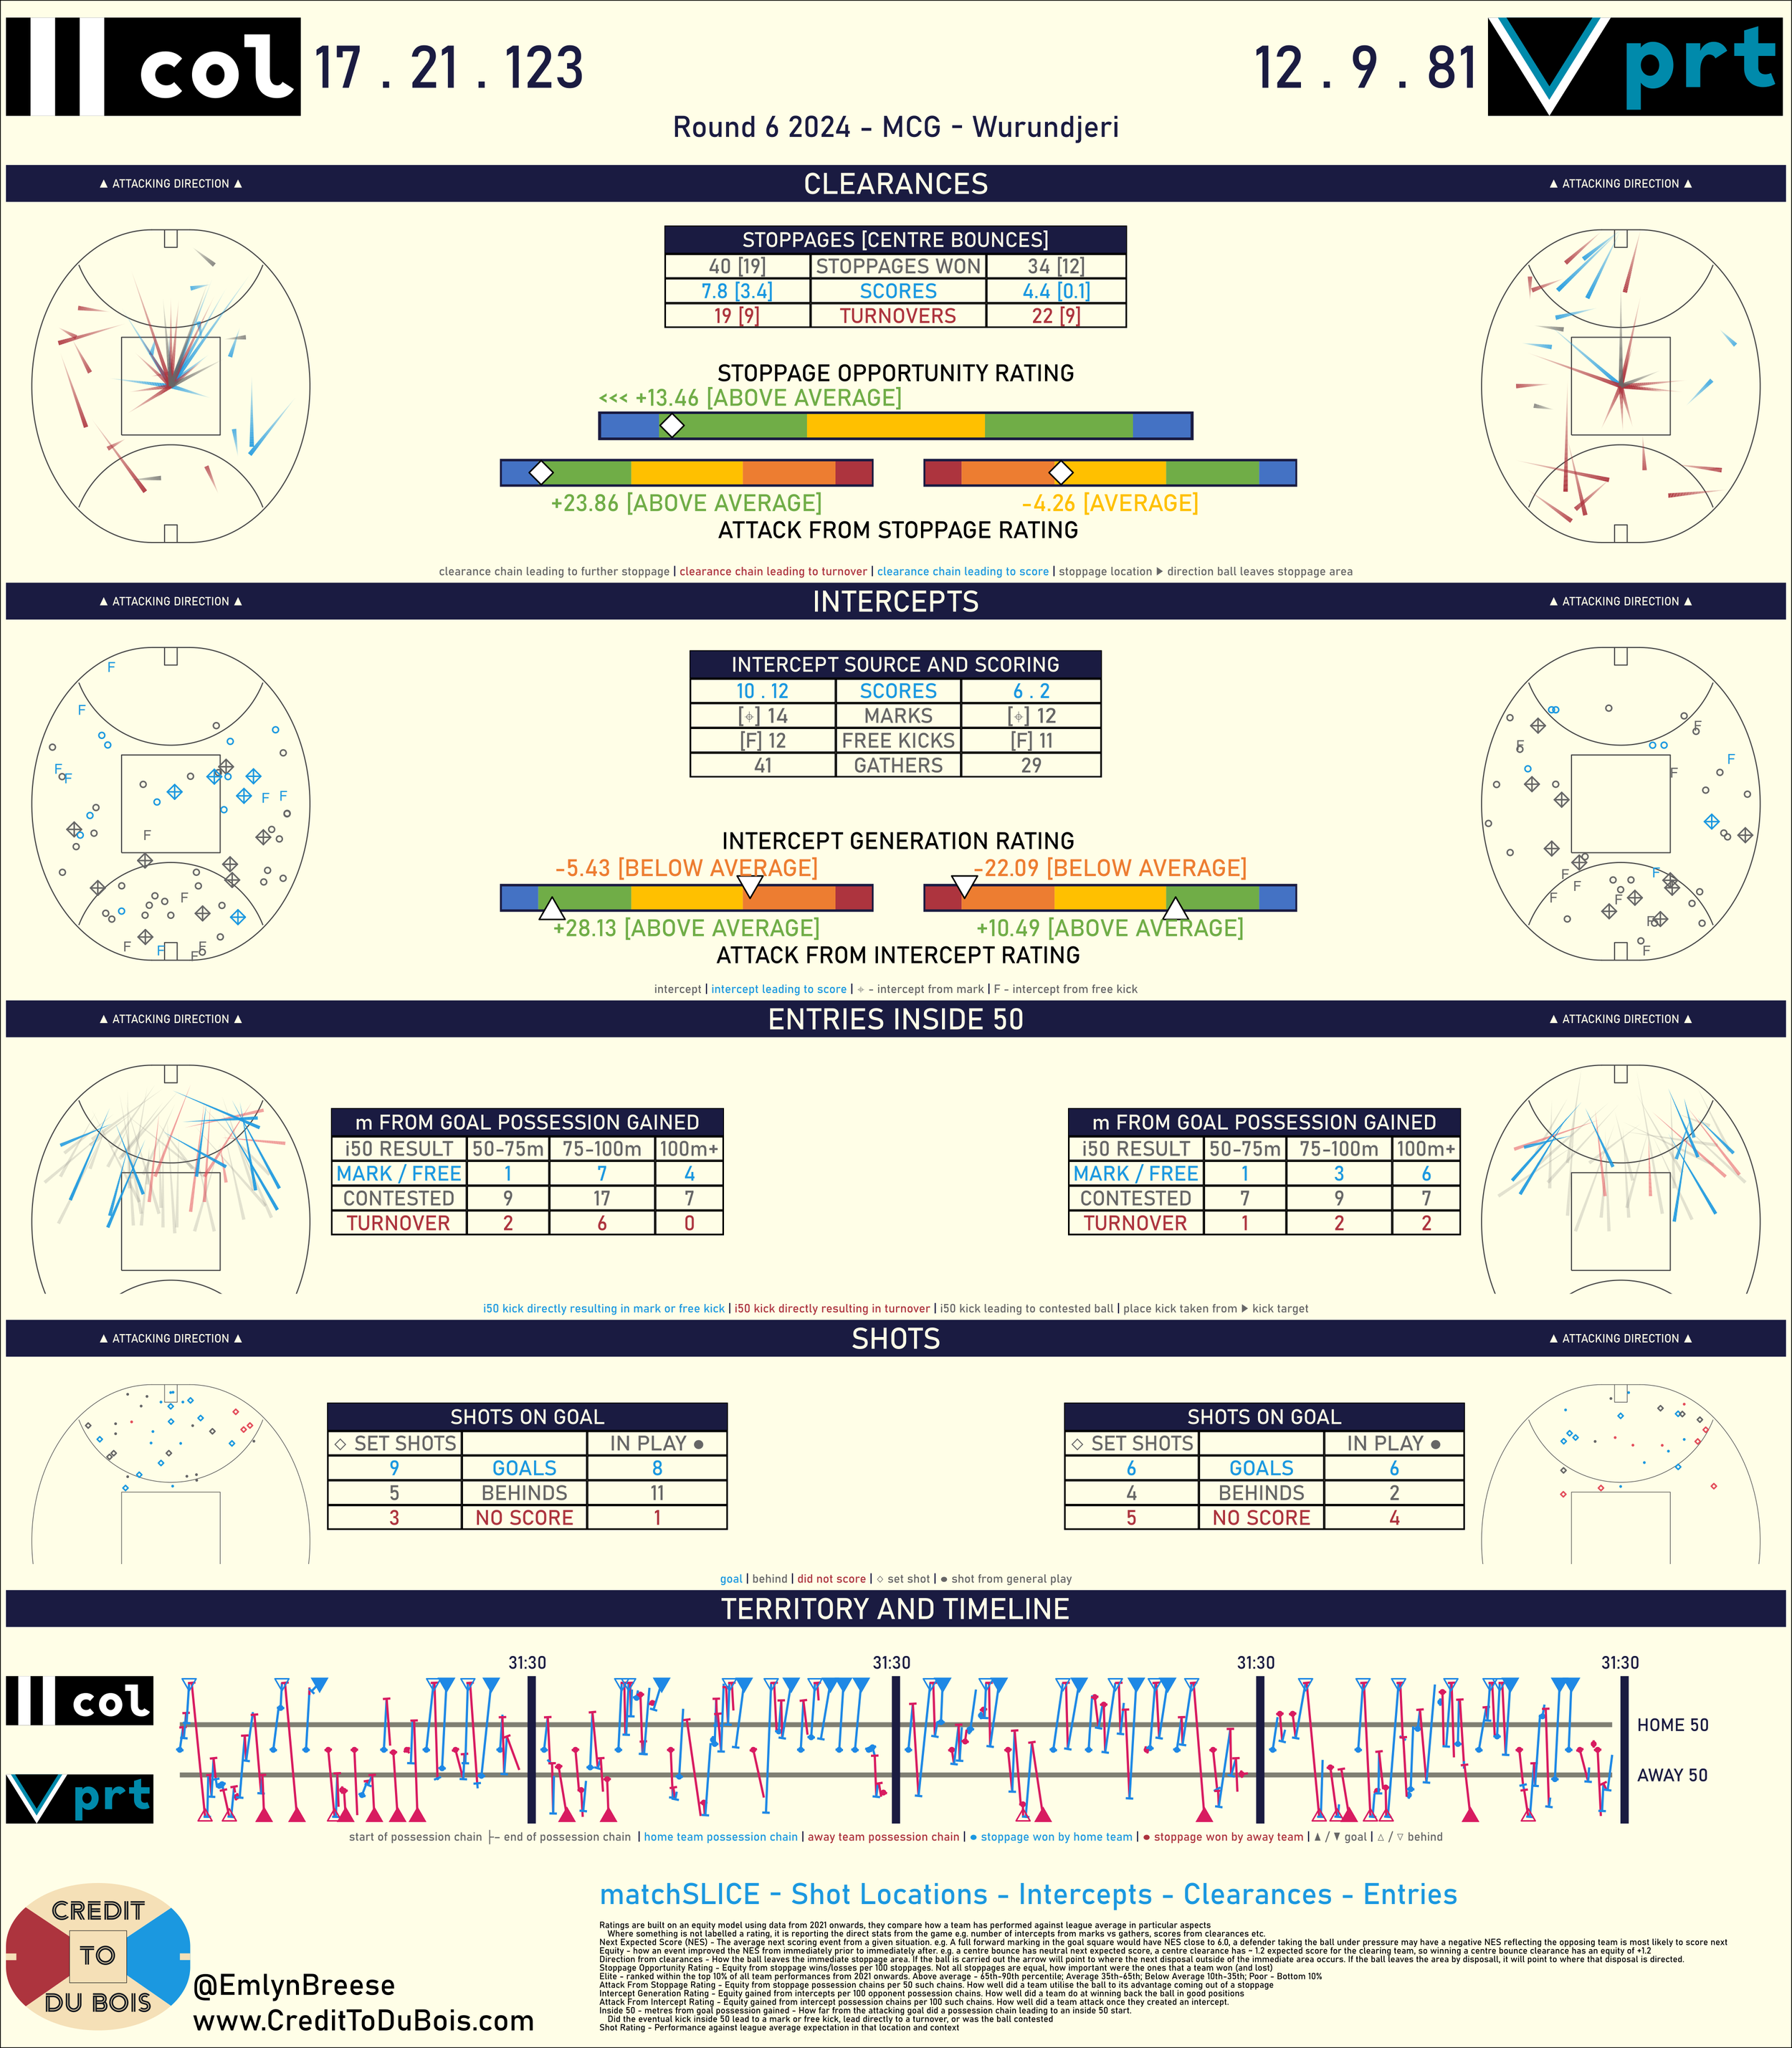
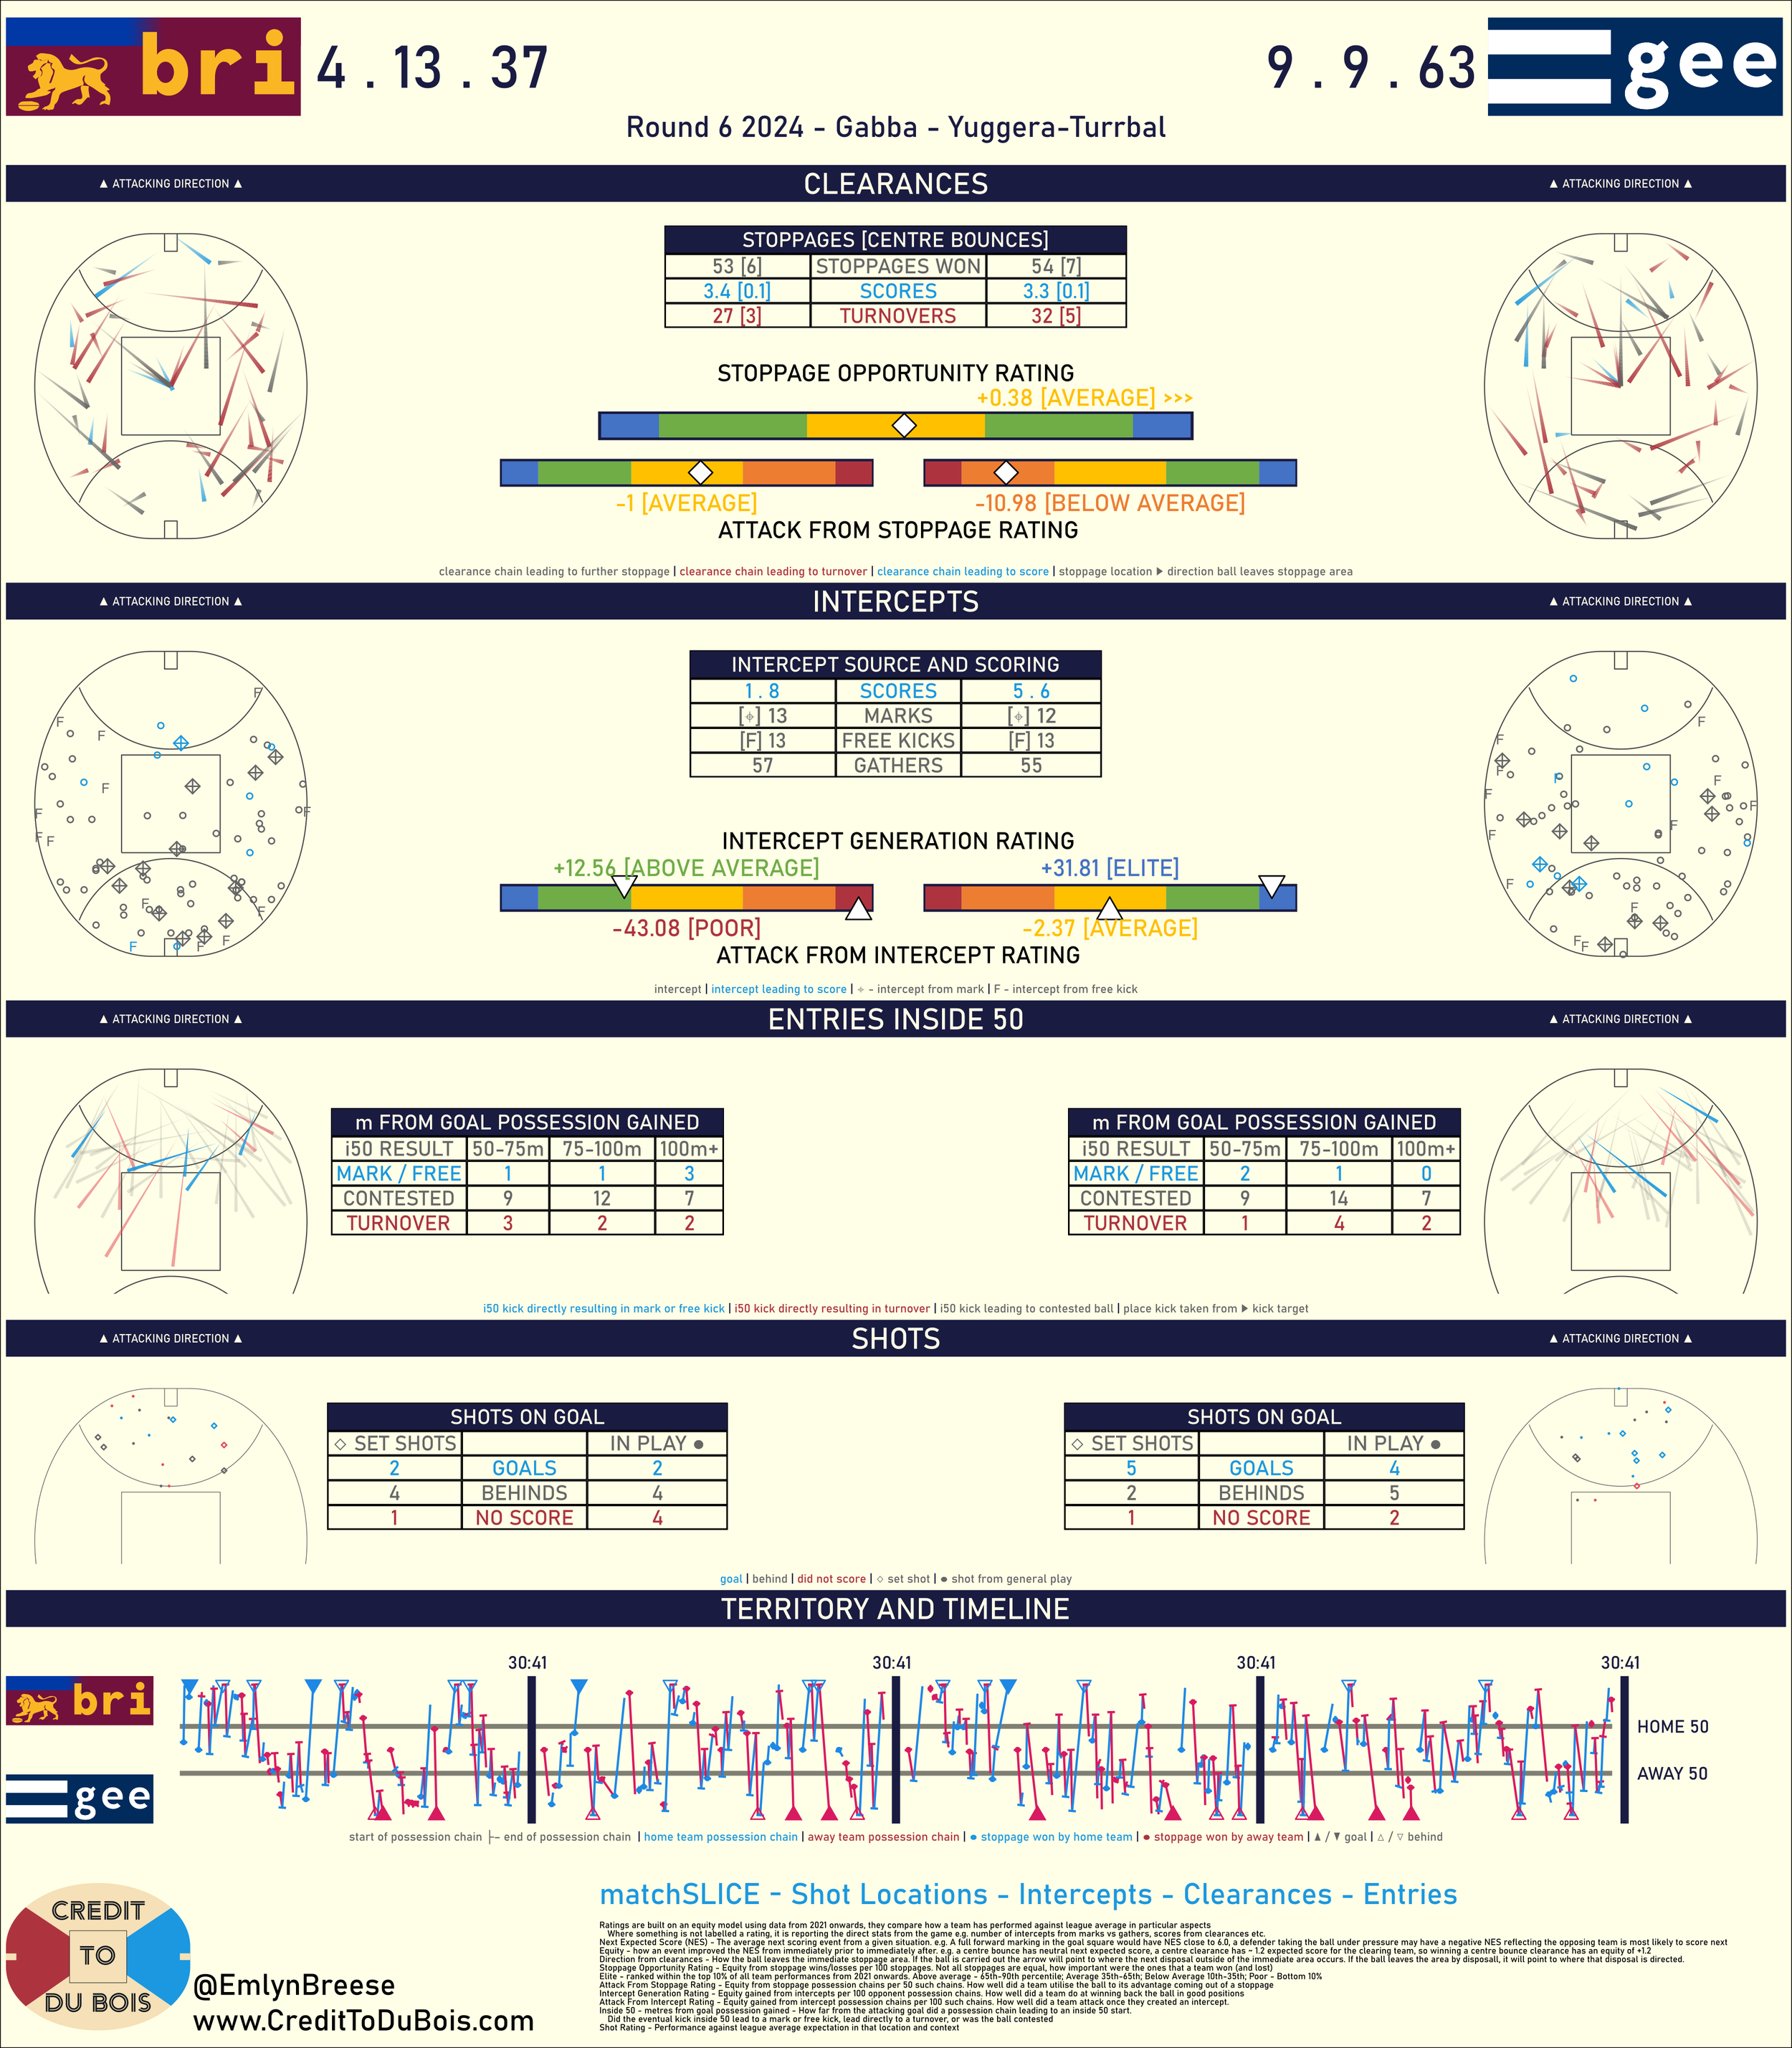
    • Easter Thursday – Brisbane v Collingwood

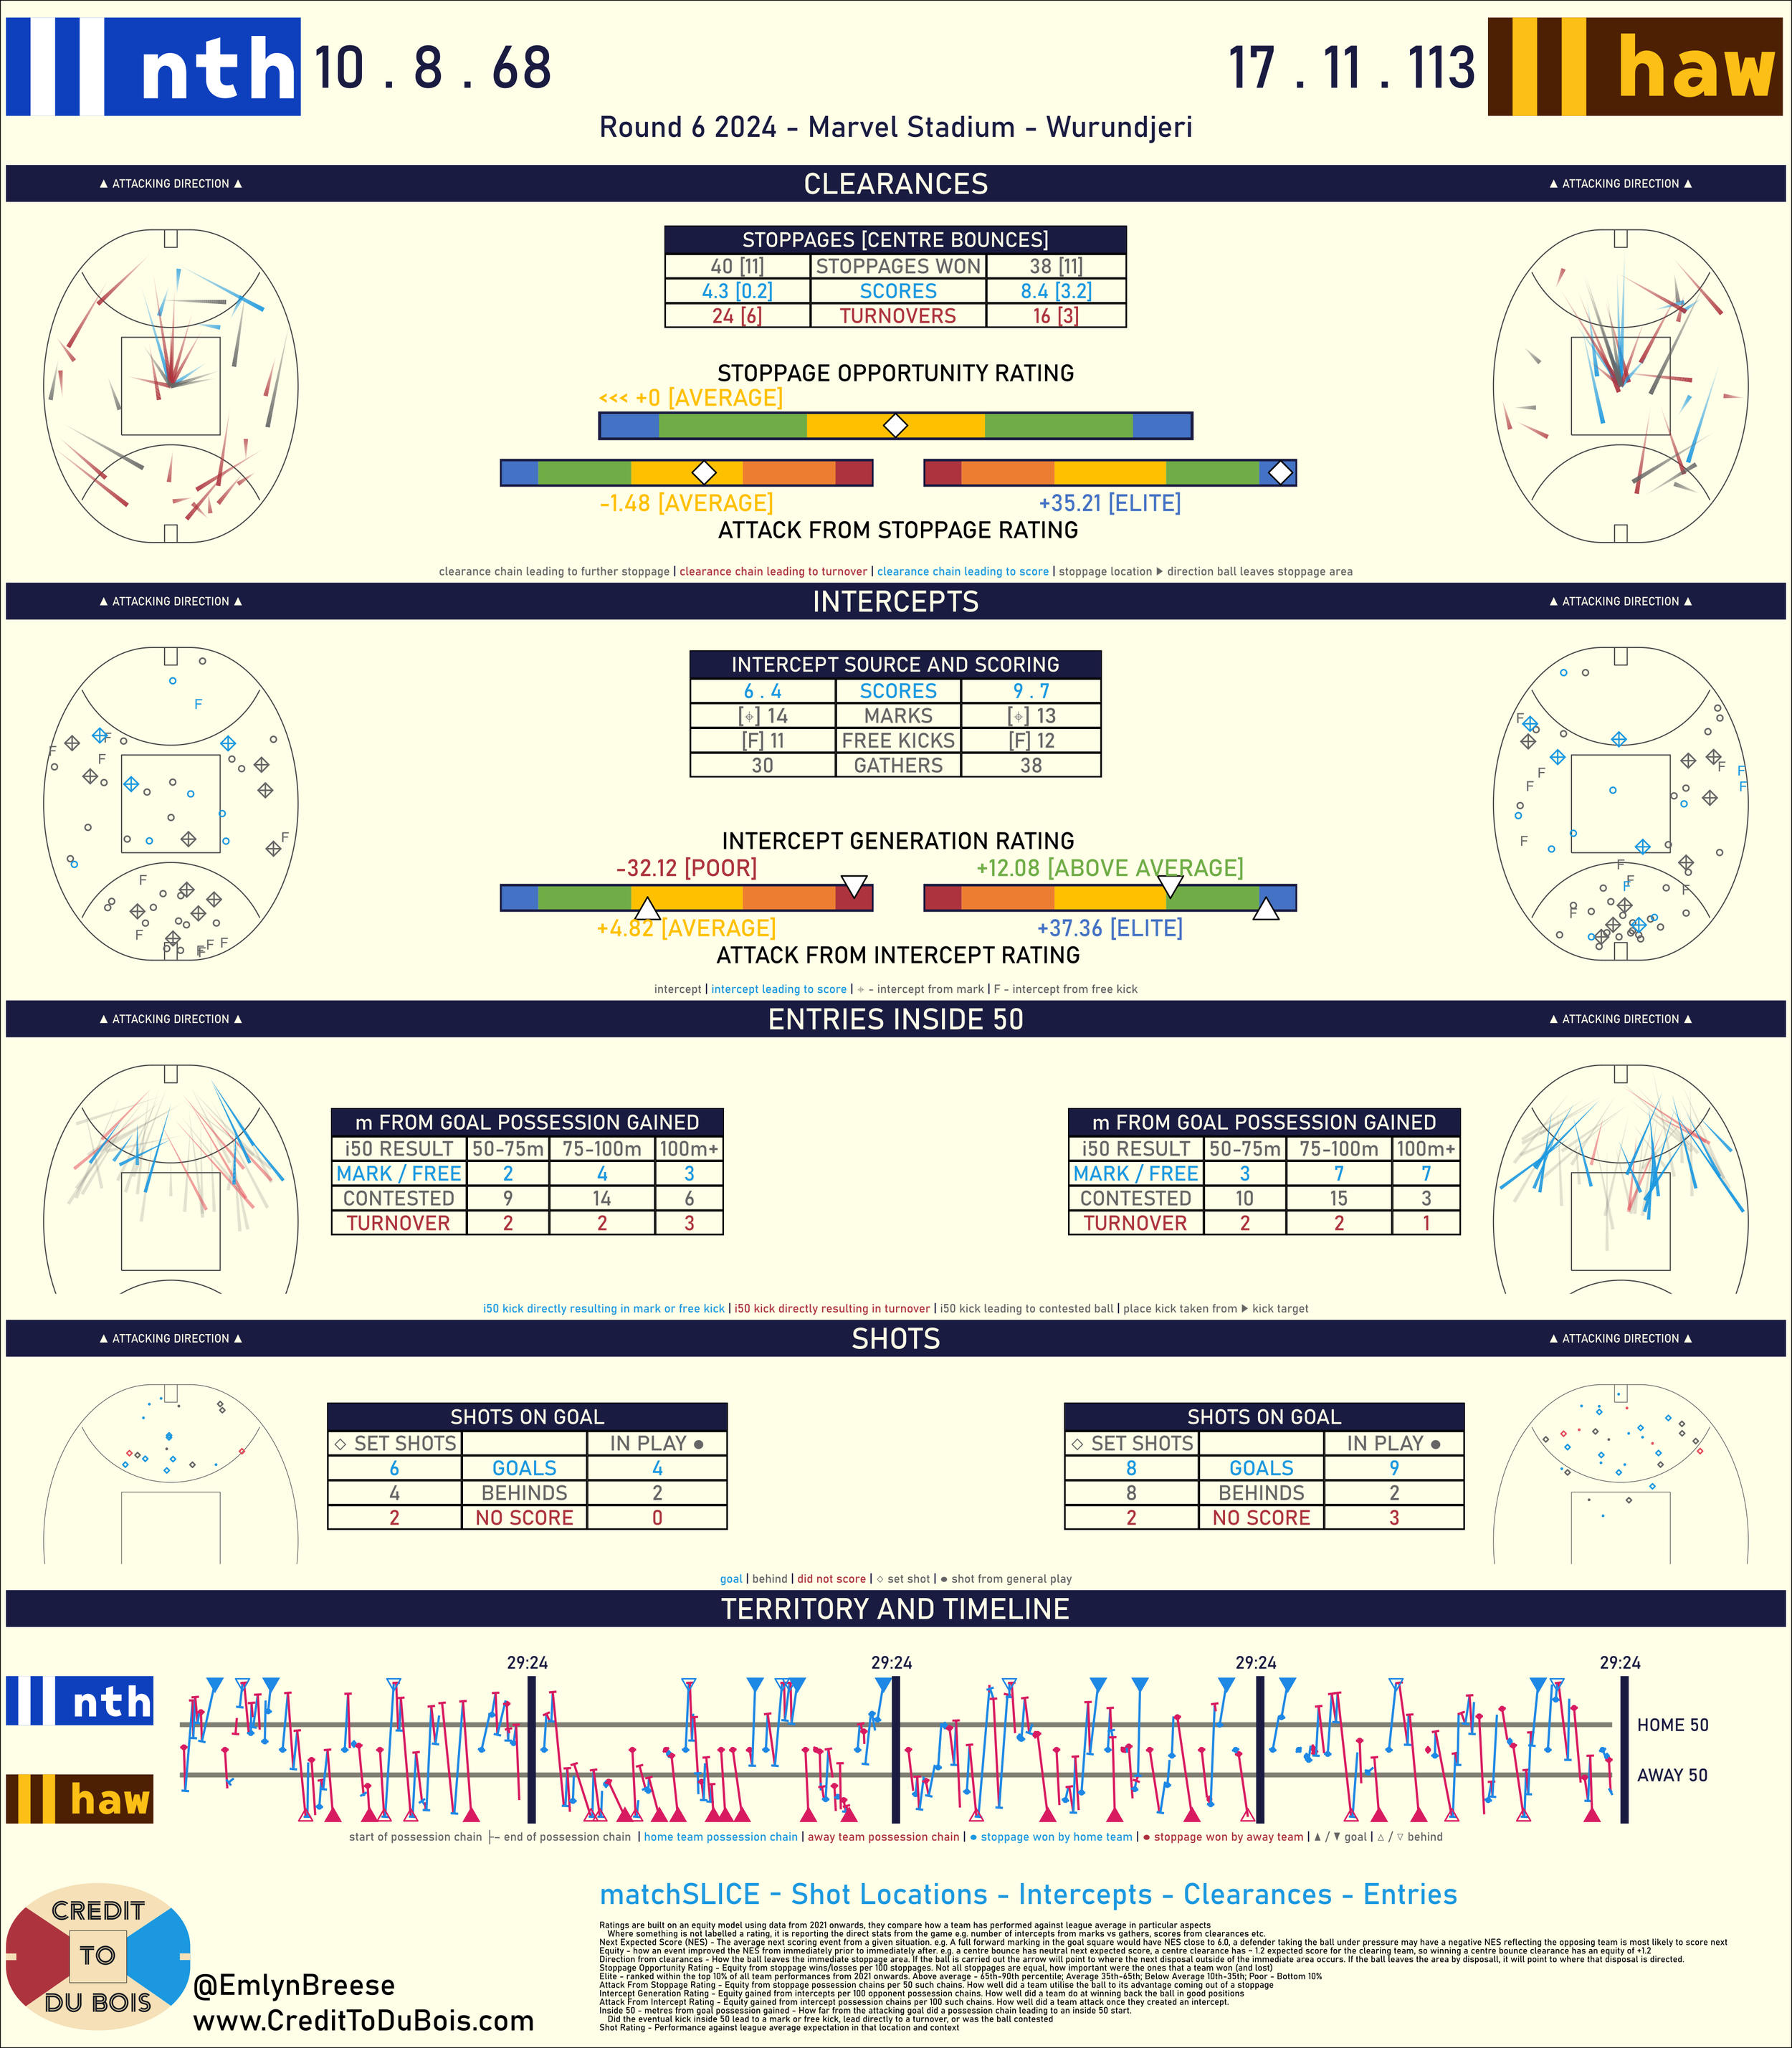
    • Good Friday – North vs Miscellaneous

    • Easter Monday – Geelong v Hawthorn

    • ANZAC Eve – Melbourne v Richmond

    • ANZAC Day – Collingwood v Essendon

    • King’s Birthday – Collingwood v Melbourne

    • Dreamtime At The ‘G – Essendon v Richmond

    • The Derby – Fremantle vs West Coast

    • The Q Clash – Brisbane v Gold Coast

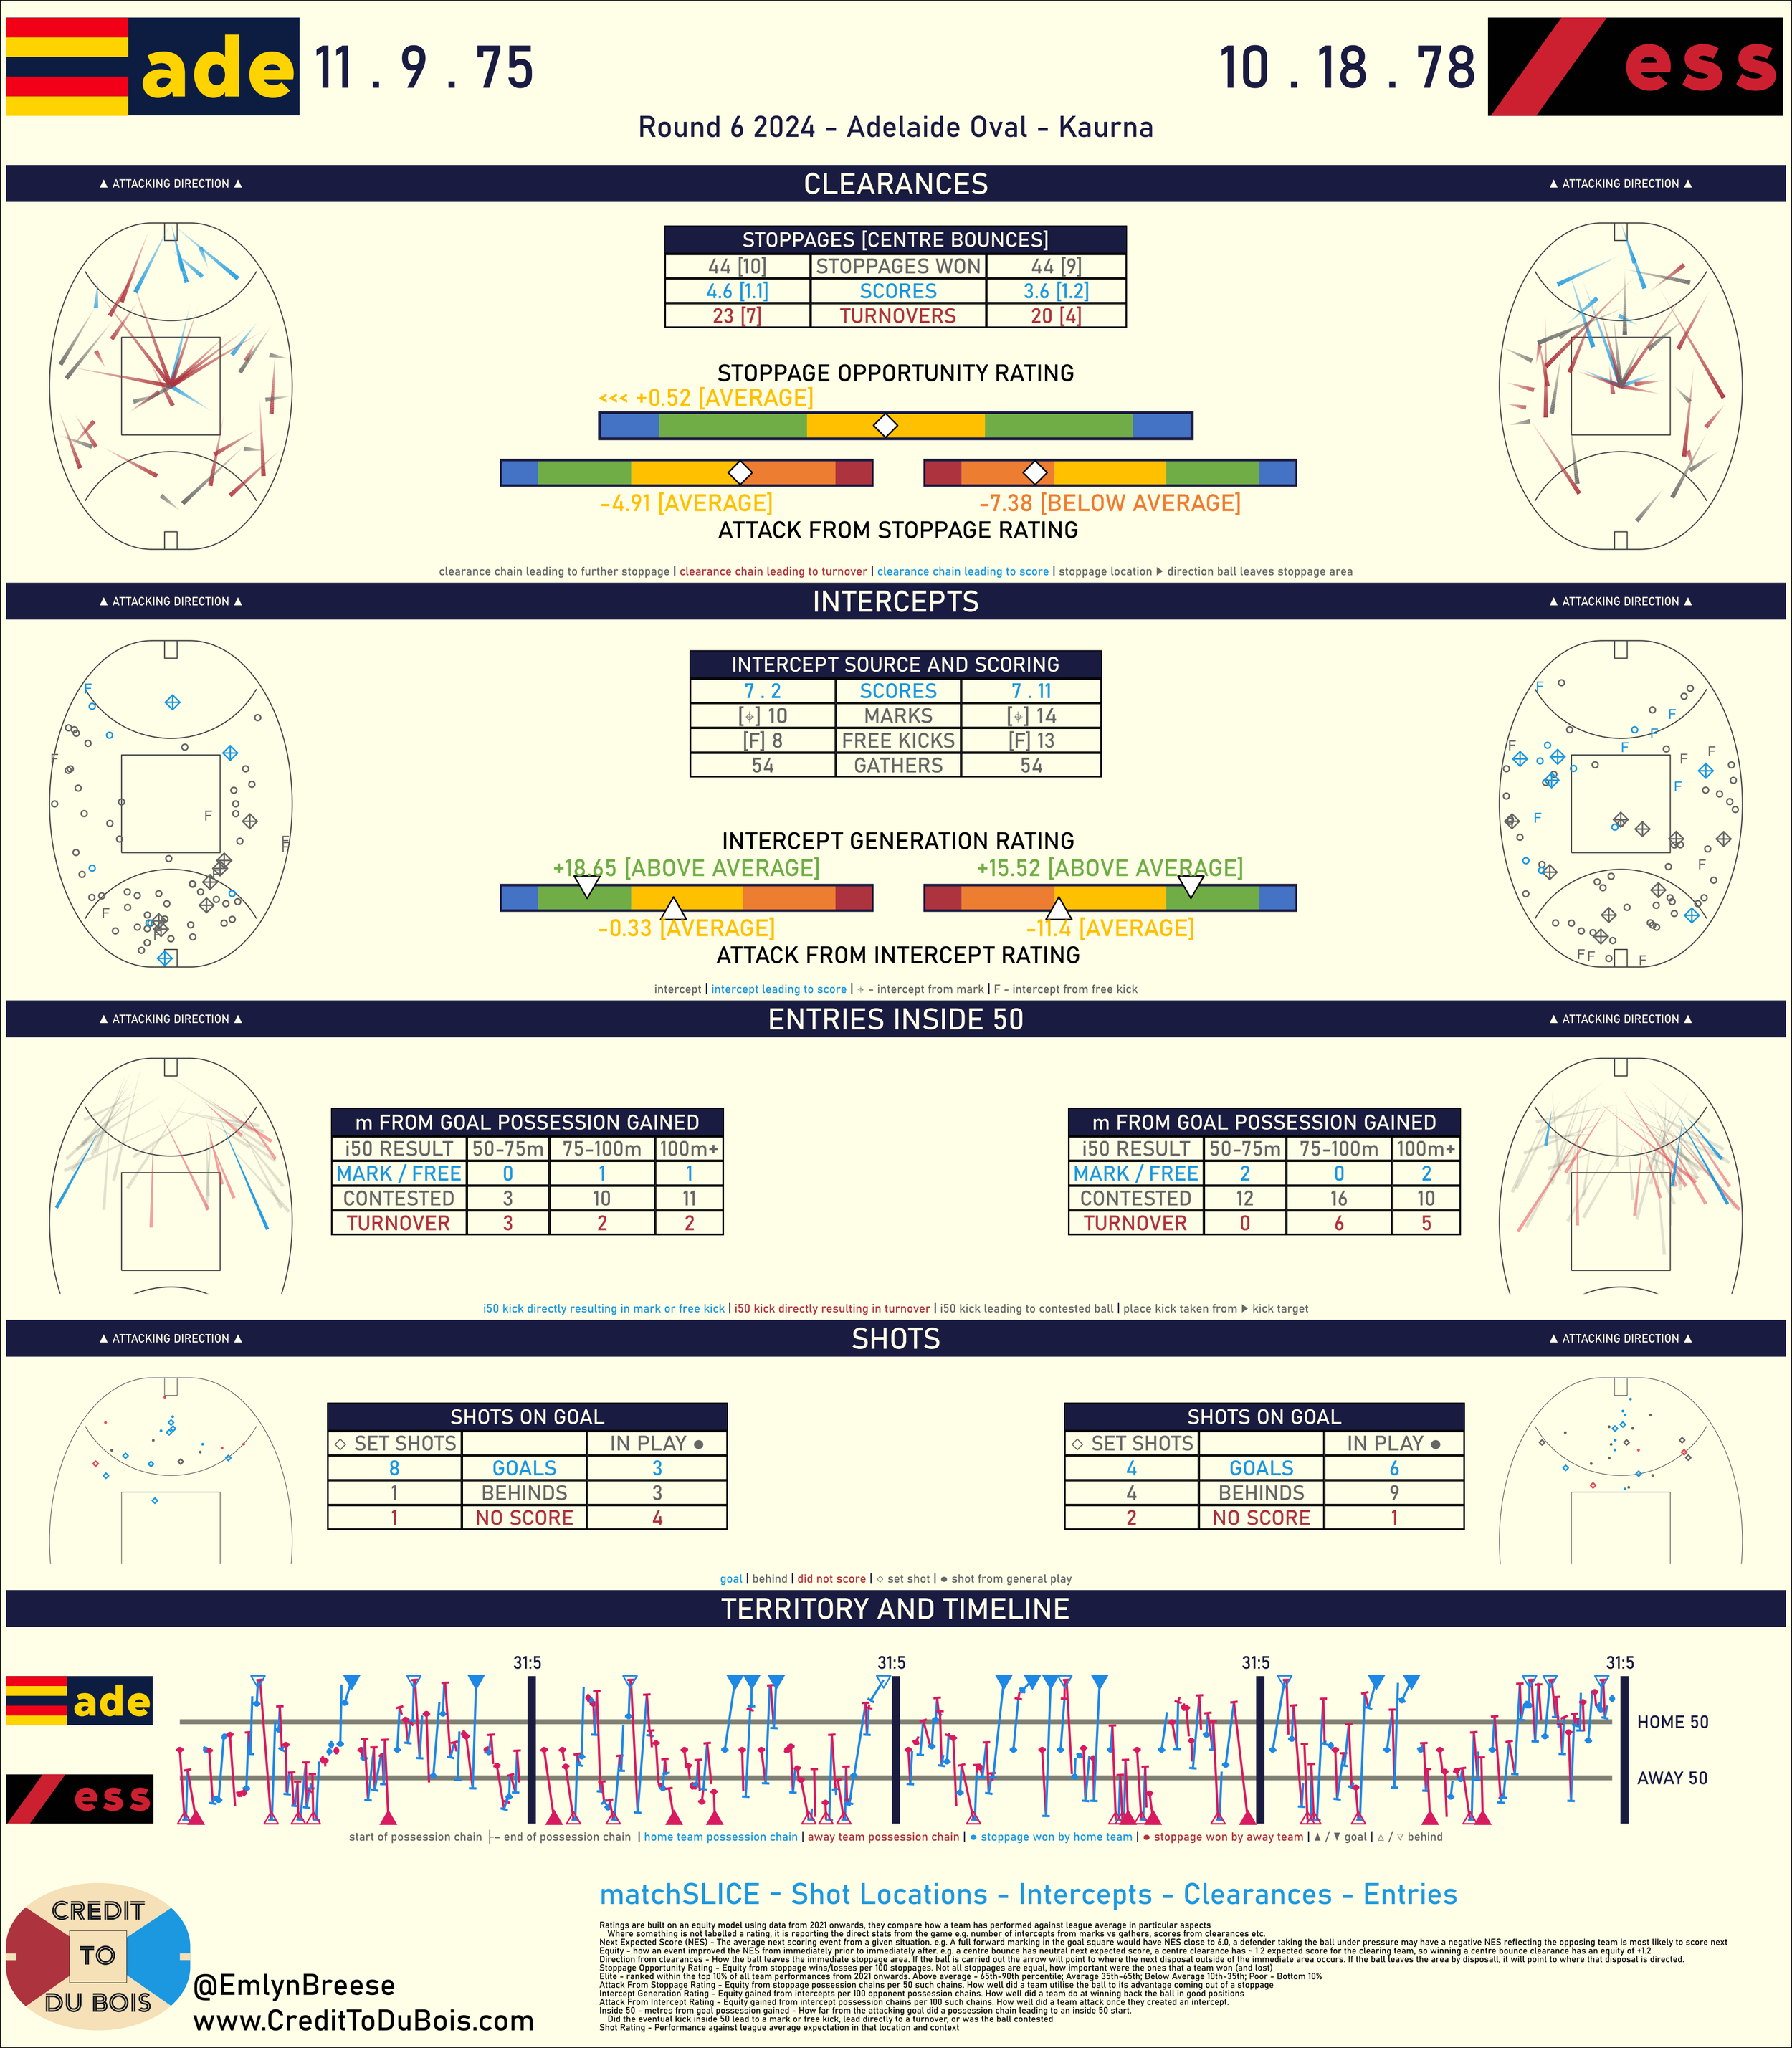
    • The Showdown – Adelaide v Port Adelaide

    • The Sydney Derby – GWS v Sydney

    I’m going to be rating them across several criteria based on the most recent 10 occurrences:

    • 50% Competitiveness

      • Evenness of win-loss record

      • Mean margin (absolute, not team-specific)

      • Proportion of games decided by under two goals

    • 25% Player engagement

      • MRO sanctions resulting from matches

      • Frees Against

    • 25% Fan engagement

      • Attendance (Both raw and as a proportion of capacity)

      • Perceived rivalry/dislike

    So, let’s get into it

    Competitiveness (50% of total)

    Win-Loss Record (15% of total)

    A pretty simple one here, we want to look at the team with the winning win-loss record and see how far above 50% that record is.

    So let’s start off with that, proportion of games won by the series winner, and subtract 50%. A 50-50 win-loss split will yield 0, a 10-0 sweep will yield 0.5

    Let’s multiply those results by 30, and then subtract the result from 15.

    That will mean a perfectly even split will get the full 15 points on offer, while a sweep will get zero.

    Mean margin (15% of total)

    The highest mean margin we’ve got is just under 60 points, so we’ll set our baseline there. I think it’s reasonable that if the average match in the slot is a 10 goal blowout you don’t get any points here.

    Based on that we take a quarter of the average margin and subtract that from 15 to get our points. Here we are looking at the margin regardless of who won – a match where one team is 10-0 but the average margin is 20 points will still score relatively well in this category.

    Proportion of close games (20% of total)

    This does result in a little bit of double-counting with the previous measure, but I think the concept of a two goal margin being a close game is well enough established that it warrants consideration.

    Take the percentage of games decided by 2 goals or less and double it to get our points.

    Player engagement (25% of total)

    MRO sanctions (12.5% of total)

    Look, I don’t want to glorify violence. Personally I think the league should take a much tougher stance on things like intentional strikes, regardless of impact. That being said, I think the sanctions handed out during a game can provide some degree of insight into the dislike two teams feel for each other.

    For this, I’ve gone back through to the start of 2023 looking at each MRO report. Prior to that I didn’t have any confidence that I was able to surface every match, so I’ve drawn the line there.

    Where a suspension has been recommended by the MRO I’ve graded it a number of points based equal to the weeks suspended. Where a financial sanction has been recommended I’ve awarded that as half a point. I’ve also excluded umpire contact from the sanctions in this criteria as I don’t feel they get to what we’re after.

    Taking the average points over the matches in the sample period gave a maximum of just under 3, so we multiply the result by 5 to get our points here.

    Frees Against (12.5% of total)

    Sanction by the MRO is a pretty high bar to clear, so I also wanted to look at a marker for lower-level ill-will and bad blood.

    To do that I looked at the total frees against by each team, and compared that to that team’s average for that season. For 9 of the 12 games there was an increase, and the range of change went from -12% to +24%.

    We’ll add 25% to it (producing a figure of up to 50%) and then halve it to give us our 12.5 points.

    Fan engagement (25% of total)

    Attendance (12.5% of total)

    Crowd absolutely has to come into this, and honestly I may be undervaluing it in the ratings a fair bit. I want to recognise both the sheer number of people, and the degree to which a stadium is packed out.

    I’ve taken the average crowd over the last 10 matches (excluding games impacted by COVID) as well as the average proportion of stadium capacity filled. I don’t want this to just be whichever match happens to happen at the MCG being on top, so I’ve weighted the proportion of capacity more heavily than the raw crowd figures.

    I’ve taken the average crowd divided by 10,000 and then multiplied that by 1.25 – giving a maximum of 12.5 for an average 100,000 crowd.

    I’ve then taken the average percentage of capacity filled and divided it by 10 (giving a number from 0-10) and multiplied that by 3.75 (a number from 0-37.5). That gives us a total of 50 points, which we’ll divide by 4 to fit into our 12.5.

    Perceived rivalry

    The guys over at The Back Pocket have very kindly given me a sneak peek at their 2025 fan rivalry survey. The survey asks which team you support, and which three teams you dislike (not in a specific order).

    I’ve used that to create a list of the three most disliked teams for each supporter base and given 3, 2, 1, or 0 points depending on position. Add that to the reverse and we’ve got a rating from 0-6 which we’ll then scale up to between 0 and 12.5.

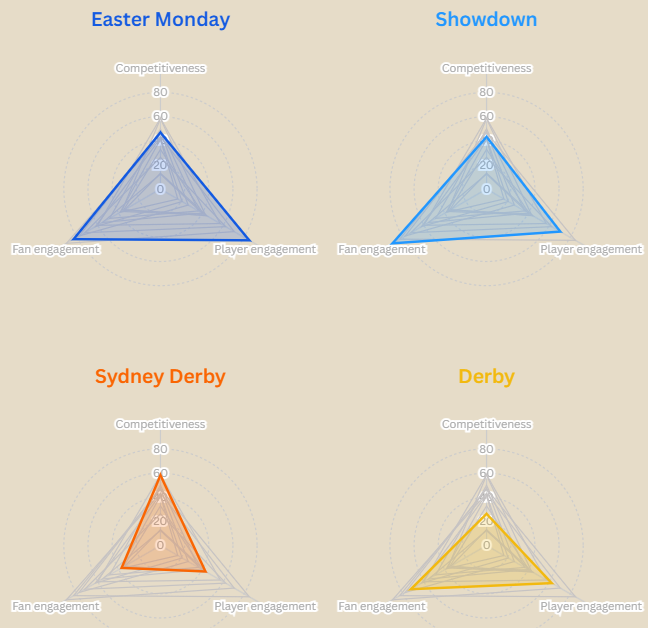
    Combining those elements gives us the following ratings out of 100, and our final rankings.

    Overall I’m pretty happy with these rankings – it matches up fairly closely to my interest level in watching the various fixtures from a neutral perspective.

    To further visualize where each match-up is assessed as stronger, this radar chart converts each component to a rating out of 100.

    There you go, an objective and scientific approach to ranking the marquee games. Feel free to come yell at me on bluesky about how you disagree.

  • Creating credible threat

    Creating credible threat

    This week I want to talk about how to dissect a bubble (carefully I guess).

    Last week on This Week In Footy Jasper Chellappah talked about bubbles when examining Carlton, after Adam Simpson brought it up on his segment on AFL 360.

    In the modern game teams generally defend space more than they defend players. Cody Atkinson and Sean Lawson wrote about this for the ABC back in 2020. In the broadest and simplest terms, a defence will be relatively happy if they can make close options risky, and long options easy to neutralise – the attacking team want to do the opposite.

    To maximise their chances, the attacking team needs to pose as many credible threats as possible. Even if you don’t use them on a given play, the more places a team feels like it needs to defend, the weaker its defence will be in any one spot.

    Consider a simplified example below. The attacking team in blue is seeking to advance the ball from a half-back flank.

    The first team is known for not utilising switches or short sharp passes. Three defenders are able to guard the 30-55m range with a lot of overlap. There aren’t any kicks in the attacking team’s comfort zones that are good options and they likely end up kicking it long and hoping for a stoppage or a contested mark.

    The second team has good foot skills, they utilise short kicks and are capable of switching effectively too. Defenders need to move forward to be able to guard the 20-30 metre kicks which then creates opportunities for long kicks. They need to actively guard against a switch creating more space again. That space will be filled by defenders further up-field, but we are still stretching them thinner across the whole field, and putting them out of position if the ball does get through.

    In fact, it’s actually compounded when you look at the second line of defenders. Not only do they need to move up to cover some of the first disposal possibiltiies.

    I’ve been wrestling for a  couple of weeks now for how to look at how a team creates credible areas of threat (short of having access to GPS data or behind the goals footage and another 40 hours in my week).

    What I do have is where the ball has gone. It seems pretty logical that a threat is only really credible if it gets used sometimes, so if we look at where the ball has tended to go, we can see whether a defending team can limit the space they’re guarding, or have to stretch themselves.

    As a starting point I’m looking at just intercept possessions at what I’m calling true half-back – 40-60 metres from defensive goal, within the width of the centre square.

    My first instinct was to go with heatmaps of where the ball tends to have gotten to within the first X seconds after the intercept possession. You can see an example below, and I may return to that, but I really wanted something that could help me categorise rather than just visualise. Each ring represents 25 metres from the point of intercept, and up is towards attacking goal.

    My second attempt, and what I’m still iterating on, takes inspiration from Richard Little’s game style previews which included a graphic on direction exiting stoppage.

    Like in the above gif, up represents towards goal, and each ring represents 25 metres from the point of intercept. There’s a couple more things to unpack though.

    The diagram is divided up into sectors – Forward (within 30 degrees either side of straight ahead); Left and Right 45 (30-60 degrees), Left and Right Lateral (60-120 degrees), and Backwards (greater than 120 degrees).

    Each of those sectors is depicted through two things – colour saturation, and radius. The colour saturation represents the proportion of intercept chains that were within that sector X seconds after the intercept. The radius of the wedge represents the distance from the point of intercept they reached (radius is drawn at the 80th percentile of distance for chains in that sector, or put another way 4 out of 5 times the ball is within the shaded distance). Given these represent a point in time after the intercept, it’s probably more helpful to think about the radius as representing speed rather than just distance.

    So we can see in the above that generally 6 seconds after an intercept the ball is most frequently in the front sector for all types of chains. For scoring chains we can see a relatively even spread across 45 and lateral zones and it’s less frequent for the ball to still be behind the point of intercept. The most obvious thing however is speed of movement. For chains ending in stoppage, 4 in 5 of the frontal chains have been contained to within less than 25 metres of the point of intercept. For scoring chains this is doubled to 50 metres.

    Let’s now look at the whole league.

    A couple of quick things to consider:

    • Wedges are drawn at the 80th percentile of distance from the point of intercept in that sector – that is, for 4 in every 5 intercept chains the ball will be within the drawn areas 6 seconds after the point of intercept. Wedges are shaded darker based on the proportion of chains that are within that sector.

    • For every team other than Essendon (and St Kilda very marginally), the front sector is the most used

    • For every team other than Essendon, the front sector is the most used for their opponents.

    • Carlton and the Giants’ opponents aren’t going forward quickly – 80% of chains in the forward sector have travelled around 12 metres or less – contrast to Essendon, Richmond, and Sydney where that’s around the 50 metre mark.

    • St Kilda have one of the most balanced threat profiles, pretty well spread across front, lateral, and right 45s. They are also still in the back sector, but with the distance involved it looks like this is probably more from being behind the mark rather than actively moving the ball backwards.

    • Richmond favour long,lateral movement to the right.


    There’s a few important provisos here to keep in mind:

    • This is very much a work in progress, and it’s something I’ll likely keep iterating on through the season

    • The chart presented here doesn’t differentiate between intercept marks and non-marks

    • This is primarily about style, not effectiveness. I haven’t represented retention rates at all here.

    • We are still early in the season so sample sizes are low – things will be impacted by single game anomalies and which opponents a team has faced.

    As always, this is very much a work-in-progress. If you have feedback the best place to yell at me is over at bluesky – http://bsky.credittodubois.com

  • Eppur si (non) muove

    Eppur si (non) muove

    This article was originally published on This Week In Football.

    In news that will surely make David King’s heart sing, Fremantle are by one metric the most stop-start team of any from 2021 onwards.

    In the season to date, only 26.4% of frees or marks to Fremantle sees them do something other than taking the kick from behind the mark.

    The next lowest is also Fremantle – in their 2021 incarnation – at 27.5%.

    This year has an outlier at the other end also  – This year’s Giants are the highest from 2021 onwards at a rate of 38.7%.

    Now, the lowest from 26.4% to the highest at 38.7% gives a relatively narrow band, so let’s see if we can unpack it a bit more. A decent chunk of frees and marks in the forward half will be in viable scoring range. Most of the time a team is going to go back and take the shot – or at least think about doing so and then potentially find a pass in a better position.

    If we only take marks/frees in the defensive half the differences become far more apparent.

    Fremantle in 2025 are still the lowest we’ve got on record at 28.2%, but the highest we’ve got is up at 52.3%, and they’re another 2025 team.

    In fact, the four highest on record are all from 2025 – Gold Coast (52.3%), Port Adelaide (46.0%), Essendon (45.2%) and GWS (44.3%).

    If we limit it even further just to defensive half intercept marks and frees Freo are yet again the lowest in our records (17.6%), and four 2025 teams are on top, although not all four are the same – Port Adelaide (43.5%), Sydney (43.0%), GWS (41.9%), and Collingwood (41.7%)

    Now, this may change over the course of the season. Small sample sizes will often lead to outlier results, but it’s certainly something worth keeping an eye on.

  • A history of the double comeback

    A history of the double comeback

    This article was originally published on This Week In Football.

    A quick one from me this week while I’m on holiday (got to see my first game at Adelaide Oval, great stadium!).

    This came to my attention from a comment on r/AFL – the idea of a double comeback. Team A gains a significant lead, Team B reverses that into a significant lead of their own, but Team A comes back again and wins the match.

    Originally a thirty point margin was floated as the threshold. However, since 2001 (the start of score-by-score progression on AFLTables) there have been 29 games in which both teams have held a lead of 30+ points at some point.

    But in none of those did the team who surrendered the initial lead secure the win (including the Essendon v Carlton draw in Round 23 2014.)

    If we drop our threshold down to 24+ points we get 5 examples of the double comeback, any of which are well worth a revisit (unless you were on the wrong end and the wounds are still too deep) and some are genuinely classics:

    Adelaide v Melbourne 2002 Semi-Final

    • Adelaide lead by 40 points

    • Melbourne lead by 28 points

    • Adelaide win by 12 points

    Sydney v North Melbourne 2006 Round 10

    • Sydney lead by 27 points

    • North lead by 32 points

    • Sydney wins by 7 points

    Brisbane v Carlton 2008 Round 21

    • Carlton lead by 24 points

    • Brisbane lead by 32 points

    • Carlton win by 6 points

    Carlton v West Coast 2014 Round 6

    • Carlton lead by 24 points

    • West Coast lead by 1 point

    • Carlton lead by 19 points

    • West Coast lead by 24 points

    • Carlton win by 3 points

    Brisbane v Melbourne 2023 Round 18

    • Melbourne lead by 25 points

    • Brisbane lead by 1 point

    • Melbourne lead by 5 points

    • Brisbane lead by 28 points

    • Melbourne win by 1 point

  • Homegrown or headhunted – how 2025 AFLM squads were assembled

    Homegrown or headhunted – how 2025 AFLM squads were assembled

    Here’s a display of how each men’s squad was assembled for 2025 – through the draft or through trades and free agency.

    The criteria I’ve applied is a homegrown player is one who entered the AFL environment through their current club, whereas a headhunted player was on someone else’s list. Players are shaded a lighter colour until their club debut year.

    Game totals should reflect to the end of 2024. With several hundred players I haven’t checked through each individually, so if you notice someone is incorrect (particularly bigger things like missing debutants) yell at me on bluesky about it (link in the banner).

  • There’s no stat for that

    There’s no stat for that

    This article was originally published at This Week In Football.

    What better way to kick off a new column than having a niche axe to grind?

    It happens numerous times each season, I’ve already caught a few this year, but every time it’s like fingernails on a chalkboard to me.

    An expert commentator says something to the effect of “he won’t get a stat for that” in reference to something that is categorically recorded as a stat and has been for over a decade.

    Today I’m talking about knock ons. Champion Data’s public glossary gives us the working definition:

    >
    Knock on: When a player uses his hand to knock the ball to a teammate’s advantage rather than attempting to take possession within his team’s chain of play.
    — Tom Wills, probably?

    Knock ons can also be recorded as contested. Effective contested knock ons are also included in a player’s possession count, as demonstrated in the below venn diagram I prepared earlier (frankly, I don’t see what the confusion over the definition of possessions is, it all seems perfectly clear to me).

    What to do with our newfound knowledge of knock ons and their statistical validity? I’m going to make a completely objective list of the top knock ons (from 2021 onwards – the most comprehensive data set I have access to only goes back that far).

    I’ve got 11,432 knock ons coming up in my data set so clearly we’ll need to set some criteria to cut that down to a more reasonable size.

    I’m only going to consider contested knock ons, that is ones that happen when the ball is in dispute rather than the ball has been directed to a player by their teammate. That leaves us with 9,411.

    Next let’s restrict it to knock ons that take possession away from the opponent, as that’s a more drastic change of game state than simply keeping possession and gaining territory. Down to 3513 now.

    Next, let’s cut to the chase and say only knock ons that contributed to a goal-scoring chain. This no doubt excludes many meritorious knock ons, but if we’re getting to a manageable number sacrifices are going to have to be made, and after all do any stats other than goals really matter? This gets us down to 329.

    Let’s be really unfair here and filter not just on the result of the individual chain, but the result of the match. We’re only going to consider games where the margin was a goal or less in favour of the team that scored a goal following a knock on. Down to 35 and now we’re really talking.

    In a moment I can only describe as serendipitous, I applied one final filter – only looking at the final quarter of games which brought us to an even 10.

    I’ve ranked them (again, extremely scientifically) based on three criteria:

    Technique – Does it go to a teammate’s advantage? Were there better options available (like taking possession)? How much pressure was it under?

    Play context – How much did it impact the play? Were other teammates around that would have caused the intercept anyway? To what degree did the player’s efforts contribute to the eventual goal?

    Match context – How much time is left in the final quarter? What is the current margin? Is this a go-ahead goal (or the final go-ahead goal)?

    Where necessary the tiebreaker will be the vibe of it.

    So without further ado,

    The completely objective top (and only) 10 (contested) knock ons (that launched a goal-scoring chain in the final quarter and the scoring team drew or won by a goal or less) in the history of the AFL (from 2021 onwards)

    #10 Jeremy Howe v Hawthorn 2022 R12

    Not so much a knock on as an unpenalised throw, combined with it being pretty early in the quarter consign this to the bottom of the list.

    #9 Ed Allan v Fremantle 2024 R11

    I actually rated this one high on technique, it’s the one on the list that really gains some territory which I feel is the more archetypal knock on. It scores lower on context, particularly match context as Collingwood were already three goals up and a long way to play in the quarter.

    #8 Callum Wilkie v Gold Coast R13 2024

    High on match context (go ahead goal with a few minutes remaining) low on play context due to the goal coming from a long-range down the field free, and the technique not great either as it was a second bite at what should have been a cleaner disposal.

    #7 Kyle Langford v North R12 2023

    Like Howe’s earlier, this scores a 0 on technique because it’s absolutely a scoop that should have been called as a throw. The context of a F50 recovery and a late go-ahead goal bring the score up though.

    #6 Ben Miller v Carlton R1 2023

    Low on technique (three on one with the one opponent on the ground, so really could have been a gather and handball) but the context bring it up significantly.

    #5 Dan Houston vs St Kilda R7 2022

    Decent technique (under direct physical pressure and in challenging conditions) and a F50 recovery see a solid score.

    #4 Ben Miller v Hawthorn R23 2021

    Critical point in the game here, but the knock on and the context within the play were average.

    #3 Patrick Lipinski v Hawthorn R12 2022

    Judged the ball really well and sent it to advantage, does get dinged on technique slightly because he puts it down to chance a bit by grounding the ball rather than delivering straight to his teammate.

    For context if he didn’t manage to redirect it there wasn’t really anyone else who could. A go-ahead goal helps too, marked down slightly for how much time was remaining.

    #2 Nick Blakey v Geelong R16 2023

    High marks for technique – the ball is speeding away, he’s under direct physical pressure, and he taps it perfectly to a teammate’s advantage.

    Some extra points from being the one to deliver a good kick inside 50, as well as the fact that Guthrie would have had a great look forward had Blakey not cut the ball off.

    Loses some points because there’s still 7 minutes left to play and honestly because Fox’s shot wasn’t the actual goal. I’ve clipped it for brevity but somehow there’s another two kicks before they score between Fox’s shot dropping short and being marked by McLean, and McLean deciding he doesn’t want to take the shot either.

    #1 Sam Powell-Pepper v Adelaide R21 2021

    I’ve got this as the best technique of any of the ten, sharking an opponent’s handball and putting it right down your teammate’s throat is sublime.

    If SPP didn’t intercept, the Crows had a really good path out of defence (despite being two players down with a really nasty collision seconds before).

    The only thing I could mark against this was that it happened at the start of the quarter rather than at the end but it is still a very worthy winner.

    Not bad for something that purportedly isn’t even a stat.

  • Goals goals goals (also behinds) – AFLW

    Goals goals goals (also behinds) – AFLW

    Having discovered a few new data sources, I’ve been focusing on AFLW data a bit lately. Partly because Melbourne’s performance and overall vibe is far less depressing in the W, partly because many datasets run across the entire 9 seasons of the competition.

    This post focuses on a few things I’ve been able to draw out from score progression data in AFLW from the first match up to the end of the 9th Home & Away season in 2024.

    Time in front

    Time in front is a metric commonly used across sport. Let’s cast our nets broader than a single game. Below I’ve ranked the teams based on how much of their total gametime (in home and away games, not finals) they’ve spent in the lead.

    The composition of the top four shouldn’t be much of a surprise to long-term followers of the league although the order might be. Leading up to this post I ran a twitter article asking who people thought would be ranked #1, with Adelaide being the #1 choice. This is understandable given they’re in the lead on premierships, but as we’ll see a bit later they haven’t been without their dips.

    There’s a clear gap between the top 4 and the rest on this metric. We can see a fairly even tapering off through the remaining teams right down to West Coast.

    Now let’s look at individual seasons, again only for Home and Away games. In the below graphs we’ve just isolated time in front, and I’ve highlighted the team that would go on to win the premiership in each year (2020 having no premiership awarded after the season was abandoned due to the COVID-19 pandemic.)

    As I mentioned, you can see Adelaide has a fair bit of up and down there. Their characteristic more than anything else has been winning when it matters.

    As you’d expect there’s a relatively strong link between time in front and ultimate success. The highest time in front of a H&A season predicting four of the seven premiers so far and a runner-up.

    The single most dominant performance by this metric was Melbourne’s 2022 (s7) effort, leading from the first score to the final siren in 7 of their 10 matches.

    On the flip side the worst performance is clearly Richmond’s maiden campaign. In their winless 2020 they held the lead for 9m 4s in the first quarter against the Suns in Round 2, and two periods of 1m19s and 1m27s against Geelong in Round 4.

    We can also look at changes from season to season.

    The biggest season-on-season drop comes from the Bulldogs from their premiership in 2018 to 2019, and it’s one they’ve never fully recovered from. This is no real surprise, as they lost Emma Kearney (Club B&F winner 2017+18, Coaches Association MVP 2018, League B&F 2018) after the 2018 season, and this was compounded with the loss of captain and leading goalkicker Katie Brennan after the 2019 season.

    Adelaide provides both a dip and a bounce, with a poor 2020 season sandwiched between strong showings. Adelaide was perhaps uniquely impacted by COVID-19 public health restrictions, as portions of the list were Northern Territory based and the bulk South Australia based. This was compounded by Erin Phillips, clearly the dominant player of the game at the time, playing only two of a possible six matches as she returned from an ACL injury.

    Other than Adelaide’s rebound, the next best season-on-season improvement is the current McLelland Trophy winning Hawthorn squad. A lot of reasons have been ascribed to their rise but I’m firmly of the belief it rests largely on taking Eliza West and Casey Sherriff away from us at Casey Fields.

    Game by game

    Let’s zoom in now to looking at individual games. Tony Corke over on MatterOfStats has done some super interesting work in trying to categorise archetypes of games in AFLM based on how the margin progresses over time (here and here for some examples).

    I’m not going to do anything as complicated as Tony has done (maybe at a later date, no promises though). Instead I’m going to try to identify close or interesting games by a couple of parameters.

    First, and simplest, most lead changes.

    The most lead changes in an AFLW game to date has been in Round 7 this year, Richmond vs Geelong with 11.

    The top 4 is rounded out by GWS v Hawthorn (R8 2022 (s7)), Collingwood v Adelaide (R7 2017), and GWS v St Kilda (R5 2022 (s6)).

    On the flip side, of the 582 AFLW games played to date just under a third have seen the loser never in front on the scoreboard.

    If we look at individual quarters there have been two occasions where the lead has changed 5 times in a quarter. Q1 of Fremantle v GWS (R2 2022 (s6)) and the 4th quarter of the aforementioned Richmond v Geelong game.

    Another thing to look for would be particularly intense passages of play. Where have the most lead changes occurred in the shortest period of time?

    The shortest time between two lead changes is 42 seconds in Round 6 2023. Jasmine Garner gave the Roos the first behind of the game at 0:39 before Aine Tighe put the Dockers in front with a goal at 1:21.

    That same section of play also gives us the quickest three lead changes, when Tahlia Randall returns the Roos to the lead another 97 seconds later.

    For the quickest four lead changes in succession we go to the second quarter of the 2023 Preliminary Final between Brisbane and Geelong.

    • Jacqueline Parry goals for a 1 point Geelong lead @ 13:04

    • Orla O’Dwyer restores a 5 point Brisbane lead @ 14:39

    • Chloe Scheer puts Geelong back in front @ 15:56

    • Dakota Davidson goals for Brisbane @ 17:54

    Let’s also have a look at where a team has snatched an unlikely win – represented by the least time spent in front by the eventual winner.

    There’s a clear winner here – it’s Fremantle vs Melbourne in Round 4 2024 in which Aisling McCarthy kicked a goal after the siren with the dockers never having led during the match.

    The dataset I go off has this recorded as holding the lead for three seconds of game time – I think representing the gap for the umpire to signal the goal, but common sense dictates us to record this as a flat 0% time in front for the win.

    The next closest also came this year in Round 10 with Gemma Houghton snatching victory for the Power at the absolute death. While Freo had tied the scores up against Melbourne for a bit, the Power had trailed ever since 2:21 into the first quarter.

    Player by Player

    That brings us nicely to our final section on player by player breakdowns.

    Let’s start off with which players have kicked their teams into the lead most frequently.

    With that kick last week Gemma Houghton (17 times with a goal and 5 times with a behind) tied Caitlin Greisier (16 x goal, 6 x behind) – leading the competition in having put their team into the lead on 22 occasions.

    Within the one game, on 5 occasions a player has taken the lead three times in a single game:

    • Three of Sarah Perkins four goals resulted in a lead change for the Crows in Round 7 2017.

    • Each of Richelle Cranston’s goals put Melbourne in front in Round 1 2018.

    • Teagan Cunningham was responsible for all three times Melbourne took the lead in Round 3 2019.

    • Jacqueline Parry put the Cats in front three times in Round 7 2024.

    • Katie Brennan put Richmond ahead of the Bombers three times in their draw in Round 9 2024.

    The last thing I want to look at today is career goals progression.

    Eight players have held (individually or tied) the record for most career goals in AFLW at some point during the competition.

    Jasmine Garner, Darcy Vescio, and Lauren Arnell were the first three goal scorers in the competition in Round 1 2017.

    Darcy Vescio kicked another three that day taking the outright lead, leaving Garner (8 minutes 53 seconds) and Arnell (1 minute and 22 seconds) with modest reigns.

    The most recent change is Kate Hore reclaiming the title from Danielle Ponter at 2:02 last Saturday.

    And below you can find the progression over time. I tried for a long time to get it reflecting changes within matches, but Flourish was having absolutely none of that (ended up being too many individual points in time I think).

    That feels like about enough for now. Hopefully this serves as a fun distraction in some quite shitty times. If you’ve got suggestions for things you’d like me to look at in future the best place to hit me up are socials on the top banner.

  • Graphing AFLW Player movement (v2)

    Graphing AFLW Player movement (v2)

    I’d previously done a post on charting AFLW player movement. Since then I’ve learned some new techniques and tools so thought it was time for an update.

    In the below PowerBI dashboard you can filter by which teams players have left or joined, seasons, and whether you want to look at movements that happened from one season to the next or where there was a gap (still only reflecting one team to the next, so Tayla Harris would appear as Brisbane to Carlton and Carlton to Melbourne, but not Brisbane to Melbourne.)

    The visualisation will adapt to whatever filters you select, and there’s a list down the bottom of all the player movements meeting those criteria.

  • Worked example of player ratings – FRE v MEL R19 2024

    Worked example of player ratings – FRE v MEL R19 2024

    Saw this from one of my mutual follows on twitter and thought it would be a good chance to do something I’ve been wanting to for a while

    I think there’s a fair bit of misunderstanding of the AFL Player Ratings system. I think a lot of that is self inflicted. I also think it’s something I have a decent enough understanding of to try to help correct.

    First, a few provisos:

    1. I don’t have access to Champion Data’s player rating formulas. I do have a reasonable understanding of the thesis Dr Karl Jackson wrote that is the basis of the system (available here)

    2. I don’t have access to defensive data like pressure acts, tackles, etc except for where they’re represented on the post-game stats sheet

    3. Most of my work is on chain-by-chain performance, rather than individual actions which are the basis of player ratings

    That being said, here we go.

    Basics

    Rating points are built on the idea of field equity. AFL is an extremely complicated game statistically. 36 players are on the field at a time, there are very few limits on their positioning, there is no offside rule, and play flows freely. This makes it hard to determine the effect of any given individual action on the field, compared to a sport like baseball.

    The best method we have is to look at whether an action makes that player’s team more or less likely to score. Play resets after a score, so we can break play into these chunks.

    For any given scenario on the field, whether it’s taking a mark at half-back, winning the centre ruck contest, or forcing the ball out of bounds in the pocket, we can look at all the data we have from previous matches, identify the similar scenarios we’ve witnessed before, and look at which team scored next. By getting the average of those scoring events (weighted for how exactly similar they are to the current situation, usually how close in field position), we arrive at the current field equity.

    By comparing the next expected score at different times, we can work out how much value each team has added in that time. Expected Score (xScore) works on the same principle – What would you expect the outcome to be before the kick is taken, and what was the outcome after the kick was taken – find the difference between the two and you have an answer for the value the player added.

    For a centre bounce contest, each team is as likely to score next as the other, it’s a true neutral ball so both teams field equity is zero. Once one team wins possession, the next expected score is roughly +1 point for them, so we can say the value of winning use of the ball at a centre bounce is roughly +1 point (and losing possession is -1 point).

    For a more detailed example: A team has possession in general play just forward of centre on their wing. Let’s say they’re at +0.5 field equity (and again, this means their opponents are at -0.5). They go in-board, but the defending team takes an intercept mark, and next expected score has now flipped to +1 for the team now in possession (the corridor being a better attacking position compared to the wing, and having the ball from a mark considered more advantageous than the ball in general play). This change of 1.5 points will be shared partly between the kicker who turned the ball over (as a negative), and the defender who took the intercept mark (as a positive). For some reason, the intercepting player kicks directly to the boundary, and the ball ends up going out of bounds on centre wing – another neutral ball, and the entirety of his team’s change in equity (1 point) is deducted from his rating total.

    Now, for the game in question.

    Player by Player

    I thought I’d start with the lowest hanging fruit first. As per Andrew Whelan’s excellent site WheeloRatings Michael Frederick had 5 shots for goal, at an expected score of 13 points, and his return was 3 behinds. That starts him off at -10 rating points just from his goal kicking.

    Forwards are extremely accuracy dependent when it comes to their rating points. Take a shot with an expected score of 3 (A 50 metre set shot with no angle for example), if a player kicks the goal he nets 3 rating points from the kick. If he scores a behind he loses 2 rating points, and if he doesn’t score he’s at -3.

    Jye Amiss had a stat sheet of 4 goals 0 behinds and 6 marks, which reads pretty well. Jacob van Rooyen scored 2.2 from 8 marks, also a healthy outing. Both were rated in the bottom 9 players on field.

    Amiss and van Rooyen ended up in the minor negatives from their goalkicking (-0.2 from 4 goals from 5 shots, and -0.1) so from a ratings perspective you should be reading their game as if they didn’t hit the scoreboard at all. It’s worth clarifying here that rating points attempt to measure the contribution of a player against what a theoretical completely average player would have done in similar situations. If you plucked the most average (actual average, not “bad” average) kick for goal in the league out, and gave them the opportunities Amiss and van Rooyen had, you’d expect them to get a slightly better return, for that reason neither get any ratings contribution from their goalkicking efforts.

    What else did Amiss do for the game? He had 2 effective handballs (one going 5 metres inbound, the other 6 metres backwards), and one effective inside 50 kick which resulted in a Walters mark and goal (this is probably where most of his positive rating points came from).

    What about his 6 marks? All 6 were uncontested, with one being on the lead. Excepting marks on the lead, player ratings don’t consider taking an uncontested mark to be a valuable contribution, they’re an expectation of an average player. A mark on a lead recognises that the marking player managed to work themselves in front of a direct opponent, so they and the kicker each receive a share of the rating points.

    None of Amiss’ possessions were contested, so much like the uncontested marks he receives no credit for them – being able to gather a ball directed to you is an expectation of the average footballer.

    Some other actions will also have contributed to Amiss’ rating: He dropped a mark from an O’Meara kick in the first quarter, and he fumbled a handball receive from Bailey Banfield in the 4th, both will have resulted in negative points. He also had 8 pressure acts, I have no further data available on those, but they will have provided him with some points.

    van Rooyen took 8 marks, however only 1 was contested and 3 were on the lead, so he won’t have got a huge number of points for this.

    He did have 7 kicks outside of his shots on goal, however they won’t have helped a lot. Only two resulted in Melbourne retaining possession, both of them going backwards to uncontested marks to May and Rivers. One was spoiled out of bounds, and the other four all resulted in turn overs. His 12th kick was a ground kick turning the ball over to Michael Frederick. I’m not 100% certain how the rating system ranks ground kick clangers, if it does assign them value this will be a costly one for van Rooyen as it gave possession to the opposition deep in Melbourne’s defensive 50.

    10 of Josh Treacy’s marks were uncontested, with only 2 of those being on the lead. He took two contested marks, but would have been debited for a fumbled mark from a Corey Wagner kick in the first quarter. His contested marks were complemented by a further 5 ground ball gets, all of which were loose balls though which are valued lower than hard ball gets.

    He got a minor return (+1.6) from his goal kicking and some contribution from 12 pressure acts and 2 tackles.

    Let’s have a look at his non-shot kicks.

    He gains reasonable ground, but there’s a number of factors that play against him from a rating points perspective. All but one of his kicks followed a mark of his own. A mark is considered the easiest context for a possession (opposition aren’t legally allowed to pressure you) so it’s effectively graded the harshest.

    Only one of his kicks led to a teammate’s mark. That’s a pure gain, they keep the same possession context (a mark), so the rating points impact will be purely positive based on the improved field position – in this case Treacy has moved it 40 metres closer to goal in doing so.

    All his other kicks have, to greater or lesser degree, traded field position for context. The worst of which is the kick that led to an intercept mark for the opposition.

    The kicks that lead to ground balls will also reflect poorly on him, even though some were eventually retained by teammates. The credit for winning the ball back from a disputed position is given to Treacy’s teammate, while the blame for moving the ball from a set position (the mark) to disputed lies with Treacy.

    I’ll finish off by looking at the May and Melksham comparison made in the tweet.

    Melksham would have received about +3.7 points from his goalkicking.

    Both players took 1 contested mark, but May took 2 intercept marks (one being his contested mark). Outside of his one uncontested intercept mark, May will have received no points for his 8 uncontested marks, whereas Melksham would have received points for his two marks on the lead out of his three uncontested marks.

    May had one more contested possession than Melksham, so my expectation is the difference will come in how they used the ball.

    May had 23 kicks compared to Melksham’s 6 (one of which was his shot on goal). However, many of May’s kicks wouldn’t have rated highly.

    12 of the 23 retained the same context – for example taking a mark and kicking it to a teammate who takes a mark – for a median 13.5 metres gained, so a fairly limited contribution overall.

    8 resulted in a deterioration of context – one going from a mark two an uncontested possession for a teammate, three resulting in a contest, and 4 resulting in the opposition gaining possession. Three resulted in May gaining the ball in general play and finding a mark for a teammate, and these will have rated reasonably with each gaining ~20 metres in the process.

    This isn’t meant to be an exhaustive explanation of the player rating system, but I hope it can make some contribution to understanding. I believe player ratings, while far from perfect, are the best single-metric player evaluation tool we currently have. I’m also a very strong believer in the use of next expected score to assess team equity in footy and use it extensively in my work.

  • The Round Up – 2024 R06

    The Round Up – 2024 R06

    I’ll aim to group a couple of things here from each round, starting with my rankings across a few categories based off my matchSLICE ratings.

    At the moment these rankings aren’t adjusted for opponent difficulty.

    They’re all based off an equity model – e.g. attacking from intercept looks at where you started your intercept chains and how much you improved your situation by the time you lose possession through a stoppage, turnover, or score. I’ve highlighted the top 4 and bottom 4 in each category. In the near future I’ll do a bit of a deeper dive into how these ratings are generated as part of explaining the matchSLICE report.

    For reference here are the rankings from the end of each of the previous three seasons in a rougher format.

    As we go forward I’ll aim to put a few interesting observations from each round, but for now I’ll finish off by chucking the matchSLICE reports from each game of the round (partly because I’m slightly nervous that if I don’t have them embedded directly in a page somewhere Squarespace will delete them as unused images…)